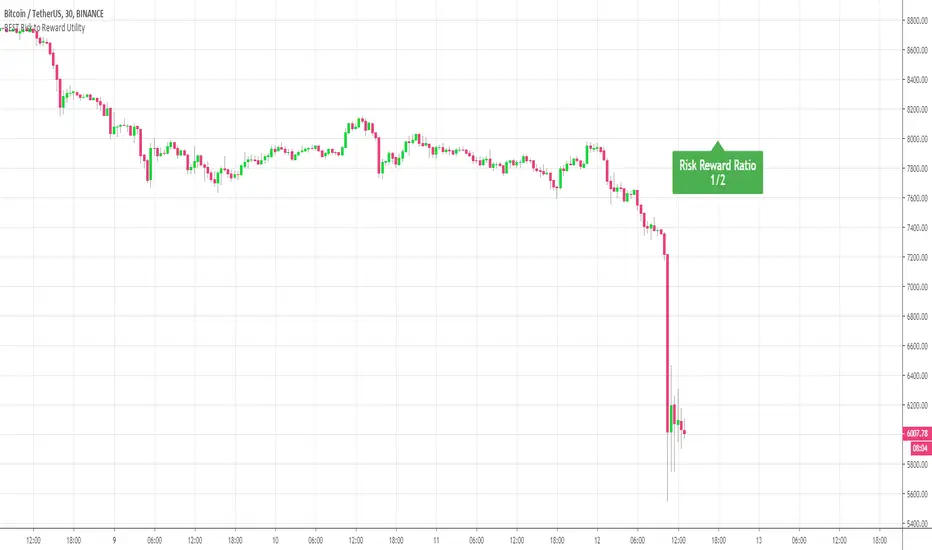
BEST Risk to Reward UtilityHello Traders
This is a proof of concept and a cool pinescript utility
It displays a risk to reward division as a fractional value.
For example
Risk: 300
Reward: 600
This will be displayed as 1/2 as we can earn 2 units for a potential loss of 1 unit
(600/300 = 2) for those wondering the NASA level mathematics behind :)
Best regards
Dave
Reward
Quansium Allocation RatioThis tool finds the most optimal allocation size for each trading setup. It has 3 modes.
Basic (it meets the minimum profitability requirements):
% Profitable: the probability of winning and is calculated by dividing the number of winning trades by the total number of trades.
Profit Ratio: a measure of the ability to generate profit instead of loss and is calculated by taking the average profit from all winning trades divided by the average losses on all losing trades.
Medium (it takes into account the maximum loss to stabilize the overall risk among the partitions):
Max Drawdown: the "worst-case scenario" for a trading period. It measures the greatest distance, or loss, from a previous equity peak.
Advanced (loss is not the only risk taken, the reward to risk ratio must also be accounted for):
Monthly Profit: the amount of average return a system provides on a monthly basis.
Monthly Loss: the highest loss given during the period of a month. It can be substituted by the Max Drawdown.
Notes :
The "check boxes" inputs are there as cosmetic separators.
"Basic" mode comes with preset values. To activate other modes, you must use a value higher than "0".
This shows the amount of percentage you should allocate for the setup you inserted the metrics for.
It is recommended to get values for each mode and find out on past data which works best for you.

ATR based Stop and Take-Profit levels in realtime Little tool to quickly identify stops and take-profit levels based on Average True Range. User can change ATR multipiers, as well as the ATR length used. Green and red lines show these levels; plot is visible over last 8 bars only to reduce clutter. Label showing the current ATR, up above the last bar

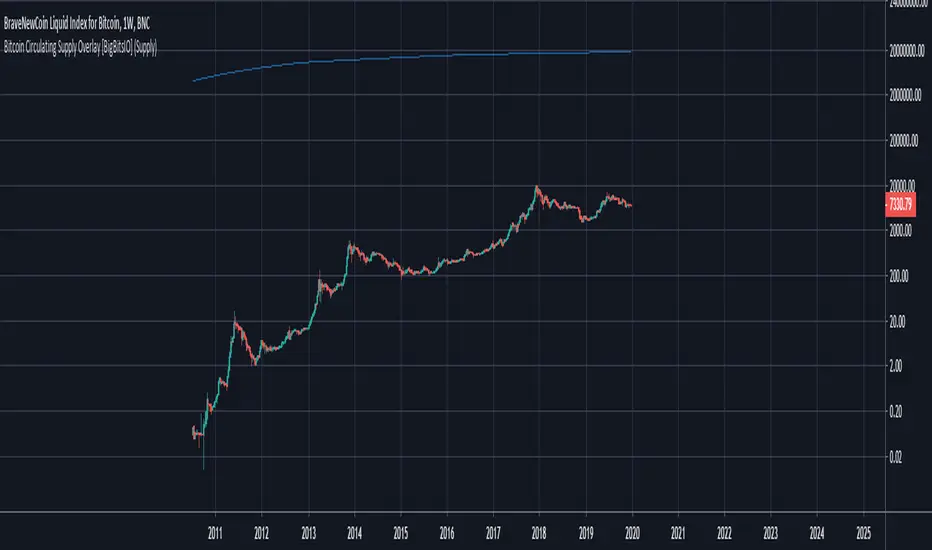
Bitcoin Circulating Supply Overlay [BigBitsIO]This script shows the estimated circulating supply of Bitcoin on any given day.
Features:
- Estimated Bitcoin circulating supply calculated daily
- Uses the Bitcoin reward schedule, past halving dates, and the next upcoming halving estimated date to calculate the current estimated supply.
- Optionally includes an option to use "Log Reduction" on the chart
*** DISCLAIMER: For educational and entertainment purposes only. Nothing in this content should be interpreted as financial advice or a recommendation to buy or sell any sort of security or investment including all types of crypto. DYOR, TYOB. ***
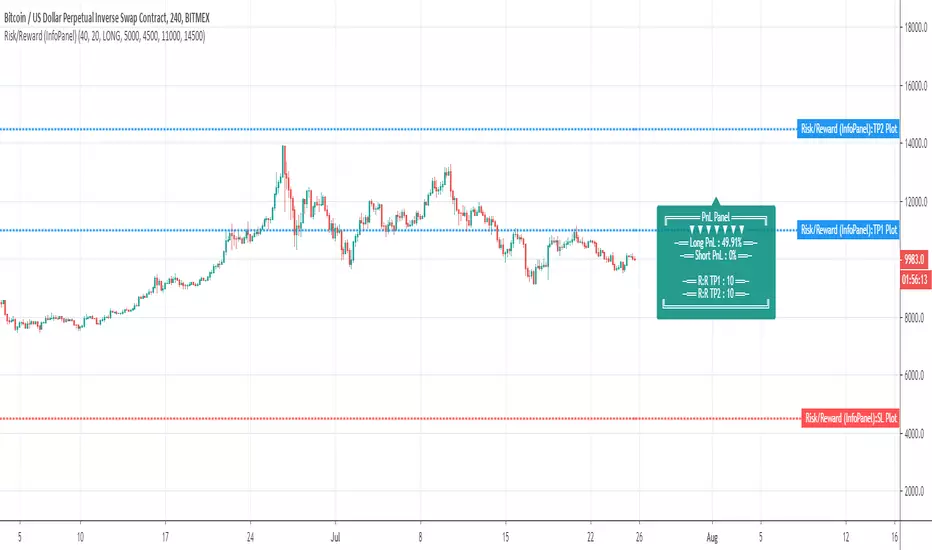
Risk/Reward (InfoPanel)Hello ladies (if any in my followers ?) and gentlemen
Here's your indicator of the day and once again given for FREE. What I'm going to say to my landlord if I can't pay rent because I'm not asking for $$ ?
I'll probably send the next indicators from below the town brige. Even then... I will still comply with my challenge to share 1 original indicator a day and not a copy of what already exists
The today indicator is to show you the great possibilites behind the TradingView Label object : Label
Profit And Loss LABEL
I thought about that one for a while and wanted to share how we can calculate dynamically a Risk to Reward ratio .
This indicator is not based on the price on the chart. I repeat before getting the question asked me privately 10 times This indicator is not based on the price on the chart.
"Then it's not useful dude, you're dumb". I agree and.... I agree... BUT you can now calculate your Risk to Reward ratio on TradingView directly rather than using an external Excel file. Who's dumb now :) ?
For those curious about it, I used this formula for the R:R ratio formula Calculating-risk-reward.asp
It will also display the Profit and Loss data based on your inputs only
ERRORS LABEL
I also added some basic errors management. If any error occur when you'll type your inputs, then a very mean Error label will appear and you'll have to fix the issues in less than a few seconds.
Otherwise your computer will explode (KABOOOOM) and your trading capital will be redirected to my own insurance fund (I have a family to feed, thanks for your sacrifices)
(end of joke)
In more seriousness, the engine will check if the TP1/TP2/Stop Loss/Entry price combinaisons makes sense. If not, you''ll be punished with an error label.
You can use this methodology for your own indicators in the futur to display dynamic messages based on users' inputs and/or current price on the chart
The educational video giving more details is coming right up.
You can watch it and should be located under "IDEAS"
Wshing you all a very fruitful end of your day and see you tomorrow for the last indicator of the week (baby David is tired and need his rest)
Dave