Scalp
CCI Stochastic and a quick lesson on Scalping & Trading SystemsHello traders
Still on holidays but I don't and will never forget you <3
I realize more and more that you guys don't only want some indicators and learn about pinescript. You also want some guidance and get some mentors providing you with comprehensive and simple trading methods and tricks.
I'm against those posting many scripts a day that in the end will make you lose your money because they don't give you the methodology to use them
It might look nice on the charts but we're not here to do some painting.... but to improve our lifestyle right :)
The today indicator is based on an indicator that I used for scalping : Fxcodebase CCI Stochastic
A CCI stochastic is very reactive and allows us to take many scalps trades per day with a few pips/USD gain for each trade. I don't recommend novice traders to use it and I strongly recommend everyone reading my disclaimer below basically saying "I'm not a financial advisor, don't be dumb, stay safe"
(I also recommend the few scripts copy-pasters to read my disclaimer as well)
What's a novice trader, sir? Well... thanks for asking. A novice trader is any trader with less than 5 years of live trading experience
From a pinescript perspective, this script will be however interesting for everyone :)
How to use it?
The indicator gives 3 possible entries for Longs and Shorts:
- Arrows at Enter - Will give signals whenever the Stoch CCI will enter in the BUY/SELL zone
- Arrows at Exit - Will give signals whenever the Stoch CCI will exit the BUY/SELL zone
- Arrows at Center - Signals whenever the Stoch CCI will cross the mid-line (50)
All arrows have different colors because ... painting is cool and nice.... kidding.... it gives clearer and more readable signals on the chart (but painting sir...)
A possible trading method could be to use the 3 modes at the same time to get the maximum of opportunities.
The safer bet is to use the "Arrows at Exit" only mode but for those who want to accumulate more scalping positions, adding the "Arrows at Enter" mode is an option as well. In other words, you accumulate a few scalping positions whenever the Stoch CCI get in the BUY/SELL zone and will stop accumulating whenever it will exit the BUY/SELL zone
You can add a few extra positions whenever the Stoch CCI will cross the mid-line as it often translates in a trend continuation
Life hack
Very important note : (probably the most important gem I shared until now) The inputs set by default will have to be changed for your asset/timeframe and can't be generic for everything. You have to play with the inputs until the signals will make sense to you
The indicator/strategy with a unique configuration that you'll never check or update according to the market condition DOES NOT exit.
If you find such a tool and prove me that you're making constant gains with it over a year, please patent it and then show it to me as I'd like to study it to replicate :) But most likely this is a myth/unicorn
Who I am to say this? Well, I worked in a Bank with real traders and I have a good sense of what works and what will certainly not work
My guru said scalping crypto in 1 second timeframe was the way to get rich quick. Do you agree sir?
But in trading, this is not because you take the maximum of trades possible that your gains will increase. This is the contrary.
There is a strong and proven inverse correlation between the number of trades taken and how fast you'll burn your capital. A swing trader taking 2/3 trades a month is more likely to beat 99% of the scalpers out there trying to predict all market movements. (and I'm not even talking about how dangerous it is to scalp with leverage)
You're starting to know me a bit more right now. I prefer to tell you what you need to hear vs what you want to hear because the second option doesn't allow to stay in the game very long.
I might lose some futures clients along the way by saying that but for my own conscience and ethics, I prefer to warn about the true risks of trading and to select who you listen very carefully (the advice also works for me, if you feel what I said doesn't make sense, this is totally your right but I hope this is because I'm french and not because of the content ^^).
See you tomorrow for another indicator or idea
Love you all
Dave
____________________________________________________________
Be sure to hit the thumbs up. Building those indicators take a lot of time and likes are always rewarding for me :) (tips are accepted too)
- If you want to suggest some indicators that I can develop and share with the community, please use my personal TRELLO board
- I'm an officially approved PineEditor/LUA/MT4 approved mentor on codementor. You can request a coaching with me if you want and I'll teach you how to build kick-ass indicators and strategies
Jump on a 1 to 1 coaching with me
- You can also hire for a custom dev of your indicator/strategy/bot/chrome extension/python
Disclaimer:
Trading involves a high level of financial risk, and may not be appropriate because you may experience losses greater than your deposit. Leverage can be against you.
Do not trade with capital that you can not afford to lose. You must be aware and have a complete understanding of all the risks associated with the market and trading. We can not be held responsible for any loss you incur.
Trading also involves risks of gambling addiction.
Please notice I do not provide financial advice - my indicators, strategies, educational ideas are intended to provide only some source code for anyone interested in improving their trading
The proprietary indicators and strategies developed by Best Trading Indicator, the object of intellectual property rights are and remain the exclusive property of Best Trading Indicator, at the exclusion of images and videos and texts free of rights or provided by the Company or external legal or physical person.
No assignment of intellectual property rights is carried out through these Terms and Conditions.
Any total or partial reproduction, modification or use of these properties for any reason whatsoever is strictly prohibited without the express written authorization of the Company.

Market Cycle & Scalping entry / exitCycle indicator is an oscillator commonly used to identify market trends and provide buy and sell signals to traders. The Cyle indicator is based on the assumption that currency trends accelerate and decelerate in cyclical patterns that may reflect the dominant price cycle of any stock, during any time frame. It works best on a 1 min chart for quick scalp plays.


SKARB Long/Short Scalping EURUSDThe indicator is specially created for scalping the euro-dollar
Best timeframes 5 m and 15 m

(ง ͠° ͟ل͜ ͡°)ง Larry Connors RSI-2 Scalping StrategyMore info here:
stockcharts.com
and here:
systemtradersuccess.com
Very interesting and simple scalping strategy with unbelievable results.
I added 4 versions that combines only the RSI OB/OS thresholds.
Also the single variable that you can change is the RSI, sometimes RSI 3 or RSI 4 works better then the original.
Also his exit point is not quite good in these days, so I added TP and SL to adjust it according to the market conditions.
Added re-entries.
It works in any time frame, so play with the TF, RSI and with all 4 variants until it fits to your needs.
Enjoy!
Zekis

ATR and RSI Buy / Sell Signal Beta 1.0This has been a long time coming for me.
I need to clean it up and add inputs for others to customize it that's why its protected.
This is configured for US securities.
Goal: Signal when to enter a trade on either side
Method: ATR and 2 RSI signals using:
3 Minute Chart Resolution
MUST have an active (can be hidden) BUILT-IN ATR ; length = 4 and set to RMA smoothing
MUST add the script; THEN go to the scripts settings and change the source to ATR. TV does not allow this to be set to default (that I know of)
I have default settings how I use them but you can modify:
ATR period (Length) =4
ATR multiplier = 0.9 (can edit by 0.1 increments.
The 1st Length/offset/resolution is defaulted to the 1 minute RSI.
The 2nd Length/offset/resolution is defaulted to the 3 minute RSI.
1)
OVERBOUGHT or OVERSOLD
*Please understand I use a length of 4 for this script, that is why the RSI OB/OS limits are so high/low.
Overbought conditions will light yellow if the 1m RSI > 90 and the 3min RSI > 85 and the time is between 09:42am and 16:00
Oversold conditions will light yellow if the 1m RSI < 10 and the 3min RSI < 10 and the time is between 09:42am and 16:00
The script ensures that if it is OB/OS under these conditions than it will not signal a buy or sell.
2)ATR
The script identifies reversals via the close breaking past the previous ATR on the preceding candle. ATR will not move UP on a short and will not move down on a long. It trails the last candle it was not broken.
The script plots labels up and down to identify the start of a reversal. Each start will have an accompanying line to display the continuation of the trend in one direction.
The script displays the value of the STOP as it trails price action. One could continue to mirror this value if you chose to. I use the fib tool for my targets and manage it as P/A demands.
3) RSI SIGNALLING
The script identifies a trend by analyzing BOTH RSI (1m and 3m) measures and requires that the current bar's readouts for BOTH measures are either greater or lower than the preceding candle.
The script also requires that both measures are above or below 50 to signal a trend.
The script will plot the trend as arrows up or down, it will display a (-) when the these conditions are not met.
Requirements to signal a BUY (LIME GREEN) or SELL (BRIGHT RED):
**Ensure your chart candle colors are faded so you can see the signal.**
**Precision is set to 0; remember TV rounds up or down for the visual measure but uses the exact measure for the script**
During the first 12 minutes:
----------------------------------
There are no OB/OS conditions as informed in section 1.
ATR stop line must be present OR the current bar close is higher than the ATR stop of the preceding candle whether it is a long or short stop signal. Quick whips are accounted for.
The current bar close MUST be higher or lower than the preceding candle's HIGH or LOW.
The script MUST identify the RSI signalling as detailed above in section 3.
The candle will light LIME or BRIGHT RED when these conditions are met and will not deceive the statements I have made.
It is important to understand that the signal may become null if the conditions do not persist through the final close of the candle. This means that a snapshot of the indicator does not accurately represent
what it will display at different times during each countdown of EACH 3 minute candle. Sometimes it signals to go long and once RSI gets too high it no longer signals. This is a good thing. Limits FOMO entries.
@ 09:42 until 16:00
-----------------------------------
OB/OS yellow candles will now occur as detailed in section 1.
Candles MUST clear the HIGH or LOW of the TWO preceding candles.
Candles MUST be trending as defined in section 3.
Candles MUST conform the conditions of the ATR stop.
I want to thank;
@pinescripters
@freedom_trader_
and I will even thank the manual lol
I have manually back tested this because I am working on the proper coding to have TV do it for me.
My strategy requires me to cover 25% of my position at 0.5 of the TV ATR 4 length RMA indicator.
Once the first target is hit than the STOP is moved to break-even.
If the target is not hit than my maximum loss is also 0.5 of the TV ATR 4 length RMA indicator.
I tested 3 full days, always on the 3min chart.
I tested 96 trades. All occurring immediately upon signal.
85 were wins and 9 were losses, 88.5% profitable.
Please understand that my intend is to cover enough quickly to cover commission costs and limit losses.
The remaining 75% of my position are sold off in the following pattern unless P/A demands that I override the FIB tool. Let them run when you can.
Position ENTRY
25% cover @ 0.5 x ATR
25% of remaining position cover @ 1.75 x ATR
25% of remaining position cover @ 2.5 x ATR
25% of remaining position cover @ 3.5 x ATR (APX 40% of the initial position)
I will further back test in the near future with an expanded risk.

scalping signalshere is a scalping indicator that give you signals with different ways..
share with me your idea for improving it...

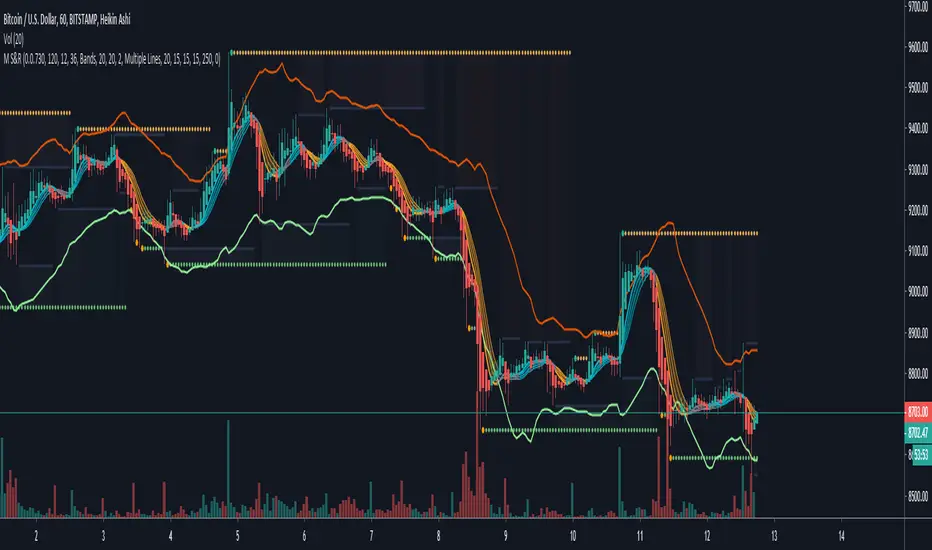
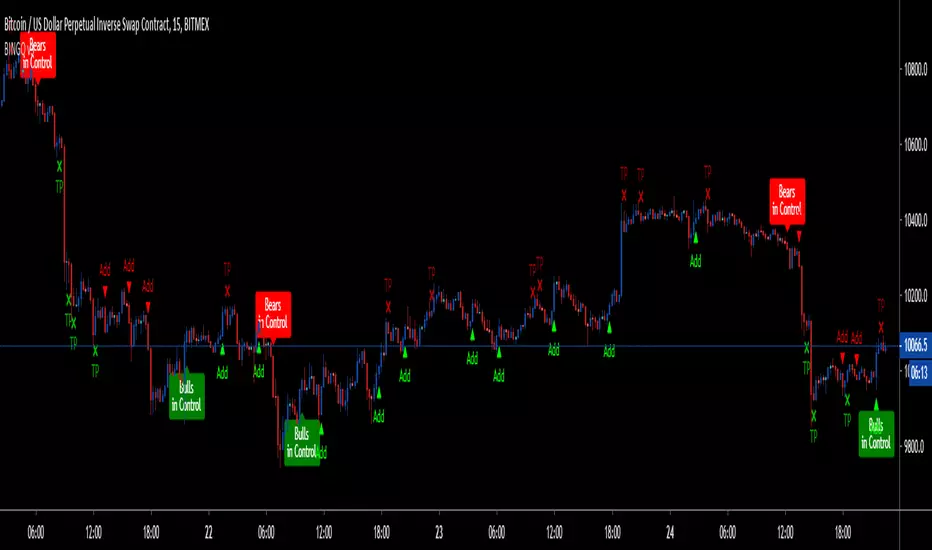
BINGO - LTF Bitmex Scalper for ETHThis is my first script which is exclusively made for ETH/USD for bitmex on 5-10min timeframe(Note: This is not for higher timeframe script, it was not designed to sustain all timeframes, but it might show some good results and you have to test it on your own). It might work for other coins, but i don't recommend it.
Its based on few parameters which I have been using to scalp ETH.
Currently its skipping few trades and exits which i will fix in sometime(getting to learn pine script), nevertheless it is by far most profitable of all my strategies.
LEGENDS:
1. Green Arrow up - Long
2. Red Arrow down - Short
3. Green TP - Take Profit for short position
4. Red TP - Take Profit for long position
If in Long postion, put STOP at low of 2nd last candle until TP1 hits. At TP1, take some profit and move stop to little above entry. Same for Short, put STOP and high of 2nd last candle until TP1 hits.
Also, it does not have alert function, so all of the trades have be manually executed. Trades are shown in chop zones as well, which will result in losses, so better use a chop indicator to avoid those trades.
Next update will have
1. FIxed missing Trades and Exits
2. Alerts
3. Improved Algo( Removal of signals in chop zone, options to have safe and risky entries, Stop placements)
4. Misc features such as, bar color change, multiple Buy/Sell(currently its alternative - Multiple means, if its a BUY and another BUY comes then it will show that too so you can add to the current trade) etc..
Just to clear my intentions, this script will be "paid only access" after next update(2-3 weeks). If you can, please tag your friends so they can benefit too. Please feel free leave a comment with all the suggestions and test results.
If you have made some money with this script, leave some tip:
BTC: 15sbDhh8t4itiFLuSTmznF87SMspvHBrDh
ETH: 0x8be1be65e9d6a167b8a4d10fda152d1d29e8e4cb
Ichimoku Analyzer☑️Ichimoku Analyzer
-This indicator automatically analyzes the Ichimoku conditions.
- Long and Short signals.
- Allows you to add an MA filter.
-Works in any timeframe or market like Forex, Crypto, Commodities even Stocks.
-Recommended manual trading and bots.
Do you need an Script or an expert adviser for Forex, contact our coding service!
Get this indicator today! contact us.

The Apoc OscillatorHere is my official Oscillator that will be going along with my indicator and trading Strategy. The final revision of my indicator and trading Strategy will be on invite only and exclusive to my discord members, however any updates to my oscillator will be public. There is so much to explain Id rather answer any questions personally, feel free to comment below and I will do my best to answer any question you may have. A picture speaks 1,000 words just put The Apoc Oscillator on your chart and see what its trying to tell you. If you like my work don't forget to hit that like button.

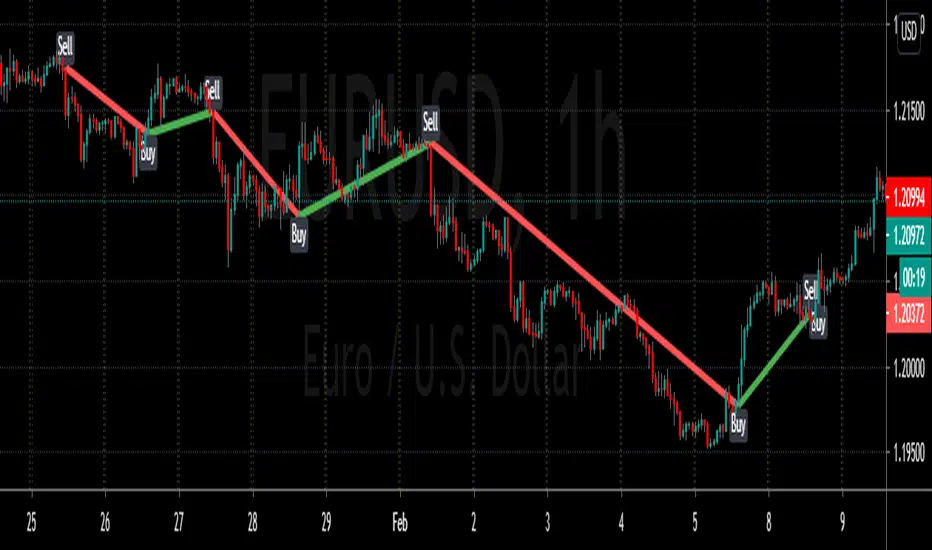
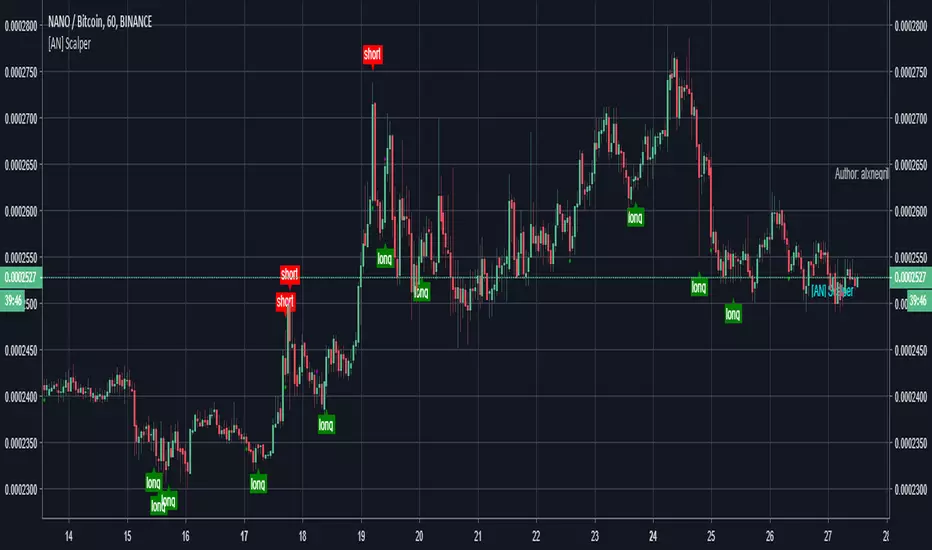
[AN] AC ScalperScalp indicator.
Uses trend to switches to find the direction and entries. Has a built in exit system.
Also uses a trailing stop system in order to maximize gains.
Alerts can be added so trades can be automated.
Strategy that tests it:

SeerFirst, we cheat, then, we go broke. Maybe.
Seer is a private technical indicator based on volatility, trend analysis, volume, flow and reversion. It is incredibly accurate across every asset class, including: futures, indexes, individual equities, commodities, forex and crypto. It can be used on every timeframe, from the 1m for fast, high strike rate scalps, to the daily or weekly for longer-term positions. Due to it's insane strike rate it will not be made public (examples below). If you are a billion-dollar hedge fund I may consider selling the indicator, otherwise the expected value from selling it is less than the edge I would give up by sharing it. If you have a counter-offer feel free to send me a message.

Scalp God (top and bottom finder) (SATURN)I am very happy to present the Tradingview community the first of my new line of powerful indicators.
This is the SCALP GOD. It will clearly label market tops and bottoms for you, if you are scalping and looking to open or close a position this indicator will mark the local highs and lows for you. Or if you are a swing trader this can also give good signals as this indicator works on any pair and any timeframe! When you see the chart turning green you know for sure that a market top is forming, if the chart is turning red you know for sure a market bottom is forming. It is sometimes the absolute top or bottom and sometimes just an important local top or bottom. PM me if you find a better top & bottom indicator because I am trying to make this better than everything out there.
It absolutely can not repaint under any circumstances.
There are a few inputs for you to think about here:
-First is the length, this just decides how many previous bars to consider, making it longer will focus on more historical information while making shorter will make it focus on what has recently happened. 12 seems to be a good value, but it's not as important as the next two options.
-Next is the threshold value, setting it very low will mean that signals will get triggered very quickly, while a higher threshold will take more movement to trigger.
-Last and most important is the sensitivity value. A lower value here will make the signals much more sensitive and therefore able to flip and trigger faster. A higher sensitivity value will make the signals less sensitive and harder to flip, meaning that it will only look for movements that agree with the longer term trend. This is great for swing traders and scalpers that go with the trend.
-There is also a smoothening option, this will make it so the signals don't come on and off so much. Sometimes this will not be good for timing, but other times it will be a more certain signal for traders specifically looking for where the top or bottom ends.
It gets better because I added several of these indicators into one script, so if there is a particular set of sensitivities and thresholds that you like you can look at them all on the same chart without opening so many copies of this. To turn on an additional copy just check the "Sensitivity # On" box.
Everyone can try this for free for 3 days and after that it will be 0.025 BTC for lifetime use and this will include all future updates to this project. This is Project Saturn and this is the first indicator from a new series of indicators that will be coming out over the next year.
Hopefully this makes a lot of you rich! I'm very excited to see all of the uses people make with it.
Happy trading & good health!

Hermes Scalping Study by ZekisA simple scalping indicator, based on Highs and Lows.
It's working in any timeframe, the only condition is ... volatility .
Values are already set, but you can change them according to your preferences and to your chart.
Alerts are enabled.
Enjoy!
@ Zekis

Renko scalp (buy/sell) indicatorThis script is based on some variations of Rocket (from Until1Mil group) scalping strategies.
It uses Renko to determine buy/sell areas.
More details can be found on my steemit page (same user as here).

[IE] Multiple price indicators + SCALPERDetect divergences in price and RSI + pivot points (with alert option). Credits to @Libertus for this, I only reproduced it and after that he pointed me to his work.
Has ChartVamp and EricChoe MAs with prediction.
Displays Support and Resistance areas
Detects momentum changes.
Custom scalper with alert option.

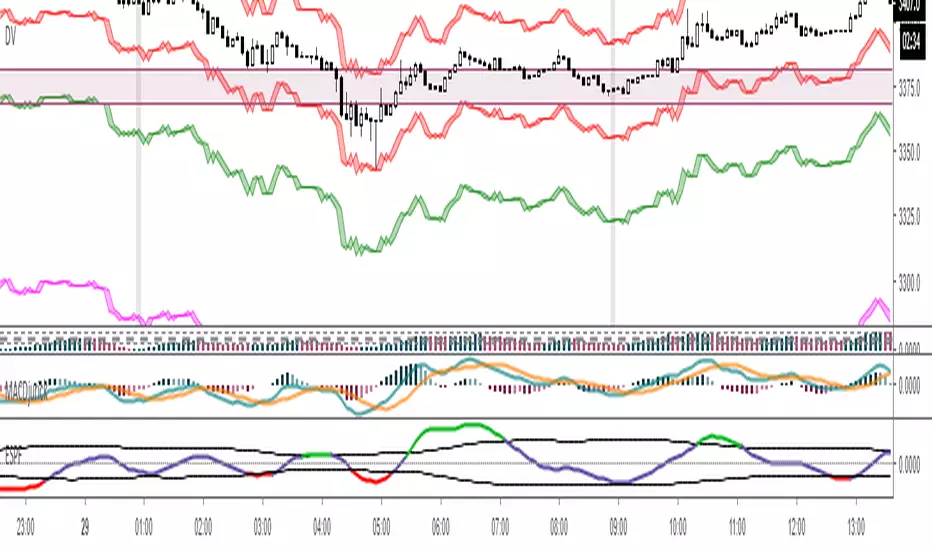
MACD-AO MACD-AO is programmed by Ruben Jaramillo
MACD-AO , short for moving average convergence/divergence, is a trading indicator used in technical analysis of stock prices, created by Gerald Appel in the late 1970s. It is supposed to reveal changes in the strength, direction, momentum, and duration of a trend in a stock's price.
The MACD-AO indicator (oscillator) is a collection of three time series calculated from historical price data, most often the closing price. These three series are: the MACD-AO series proper, the "signal" or "average" series, and the "divergence" series which is the difference between the two. The MACD-AO series is the difference between a "fast" (short period) exponential moving average (EMA), and a "slow" (longer period) EMA of the price series. The average series is an EMA of the MACD-AO series itself.
The MACD-AO indicator thus depends on three time parameters, namely the time constants of the three EMAs. The notation " MACD-AO (a,b,c)" usually denotes the indicator where the MACD-AO series is the difference of EMAs with characteristic times a and b, and the average series is an EMA of the MACD-AO series with characteristic time c. These parameters are usually measured in days. The most commonly used values are 12, 26, and 9 days, that is, MACD-AO (12,26,9). As true with most of the technical indicators, MACD-AO also finds its period settings from the old days when technical analysis used to be mainly based on the daily charts. The reason was the lack of the modern trading platforms which show the changing prices every moment. As the working week used to be 6-days, the period settings of (12, 26, 9) represent 2 weeks, 1 month and one and a half week. Now when the trading weeks have only 5 days, possibilities of changing the period settings cannot be overruled. However, it is always better to stick to the period settings which are used by the majority of traders as the buying and selling decisions based on the standard settings further push the prices in that direction.
The MACD-AO and average series are customarily displayed as continuous lines in a plot whose horizontal axis is time, whereas the divergence is shown as a bar graph (often called a histogram).
A fast EMA responds more quickly than a slow EMA to recent changes in a stock's price. By comparing EMAs of different periods, the MACD-AO series can indicate changes in the trend of a stock. It is claimed that the divergence series can reveal subtle shifts in the stock's trend.
Since the MACD-AO is based on moving averages, it is inherently a lagging indicator. As a metric of price trends, the MACD-AO is less useful for stocks that are not trending (trading in a range) or are trading with erratic price action.

Emas Teo ZuñigaEmas Teo Zuñiga is programmed by Ruben Jaramillo
This trading system analyzes the crossover of two exponential moving averages (period of 8 and 18) to generate buy and sell signals.
The strategy opens a buy position when the 18-bar moving average crosses above the 8-bar moving average and only if the same crossover occurred at least once during the previous 20 bars.
The strategy opens a sell position when the 18-bar moving average crosses below the 8-bar moving average.
The trading system doesn't contain any other rules such as stops or money management scripts. It can be applied to the stock, ETF, futures and Forex market.
By running an optimization, you can create several simulations or backtests with different EMA periods and then look for the best EMA cross parameters. The first period will vary from 5 to 50 and the second one will vary from 12 to 120. (8, 18, 50 by default)

