Multi-Indicator Signals with Selectable Options by DiGetMulti-Indicator Signals with Selectable Options
Script Overview
This Pine Script is a multi-indicator trading strategy designed to generate buy/sell signals based on combinations of popular technical indicators: RSI (Relative Strength Index) , CCI (Commodity Channel Index) , and Stochastic Oscillator . The script allows you to select which combination of signals to display, making it highly customizable and adaptable to different trading styles.
The primary goal of this script is to provide clear and actionable entry/exit points by visualizing buy/sell signals with arrows , labels , and vertical lines directly on the chart. It also includes input validation, dynamic signal plotting, and clutter-free line management to ensure a clean and professional user experience.
Key Features
1. Customizable Signal Types
You can choose from five signal types:
RSI & CCI : Combines RSI and CCI signals for confirmation.
RSI & Stochastic : Combines RSI and Stochastic signals.
CCI & Stochastic : Combines CCI and Stochastic signals.
RSI & CCI & Stochastic : Requires all three indicators to align for a signal.
All Signals : Displays individual signals from each indicator separately.
This flexibility allows you to test and use the combination that works best for your trading strategy.
2. Clear Buy/Sell Indicators
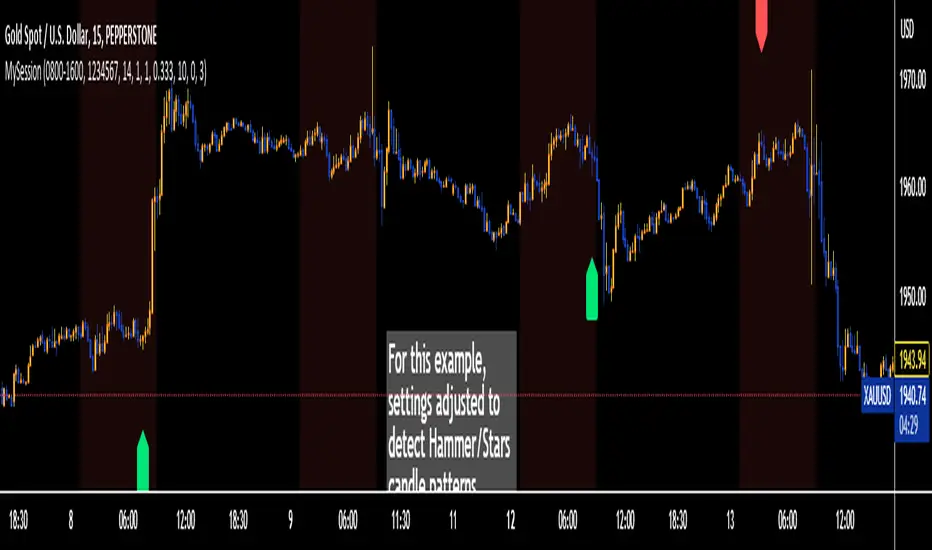
Arrows : Buy signals are marked with upward arrows (green/lime/yellow) below the candles, while sell signals are marked with downward arrows (red/fuchsia/gray) above the candles.
Labels : Each signal is accompanied by a label ("BUY" or "SELL") near the arrow for clarity.
Vertical Lines : A vertical line is drawn at the exact bar where the signal occurs, extending from the low to the high of the candle. This ensures you can pinpoint the exact entry point without ambiguity.
3. Dynamic Overbought/Oversold Levels
You can customize the overbought and oversold levels for each indicator:
RSI: Default values are 70 (overbought) and 30 (oversold).
CCI: Default values are +100 (overbought) and -100 (oversold).
Stochastic: Default values are 80 (overbought) and 20 (oversold).
These levels can be adjusted to suit your trading preferences or market conditions.
4. Input Validation
The script includes built-in validation to ensure that oversold levels are always lower than overbought levels for each indicator. If the inputs are invalid, an error message will appear, preventing incorrect configurations.
5. Clean Chart Design
To avoid clutter, the script dynamically manages vertical lines:
Only the most recent 50 buy/sell lines are displayed. Older lines are automatically deleted to keep the chart clean.
Labels and arrows are placed strategically to avoid overlapping with candles.
6. ATR-Based Offset
The vertical lines and labels are offset using the Average True Range (ATR) to ensure they don’t overlap with the price action. This makes the signals easier to see, especially during volatile market conditions.
7. Scalable and Professional
The script uses arrays to manage multiple vertical lines, ensuring scalability and performance even when many signals are generated.
It adheres to Pine Script v6 standards, ensuring compatibility and reliability.
How It Works
Indicator Calculations :
The script calculates the values of RSI, CCI, and Stochastic Oscillator based on user-defined lengths and smoothing parameters.
It then checks for crossover/crossunder conditions relative to the overbought/oversold levels to generate individual signals.
Combined Signals :
Depending on the selected signal type, the script combines the individual signals logically:
For example, a "RSI & CCI" buy signal requires both RSI and CCI to cross into their respective oversold zones simultaneously.
Signal Plotting :
When a signal is generated, the script:
Plots an arrow (upward for buy, downward for sell) at the corresponding bar.
Adds a label ("BUY" or "SELL") near the arrow for clarity.
Draws a vertical line extending from the low to the high of the candle to mark the exact entry point.
Line Management :
To prevent clutter, the script stores up to 50 vertical lines in arrays (buy_lines and sell_lines). Older lines are automatically deleted when the limit is exceeded.
Why Use This Script?
Versatility : Whether you're a scalper, swing trader, or long-term investor, this script can be tailored to your needs by selecting the appropriate signal type and adjusting the indicator parameters.
Clarity : The combination of arrows, labels, and vertical lines ensures that signals are easy to spot and interpret, even in fast-moving markets.
Customization : With adjustable overbought/oversold levels and multiple signal options, you can fine-tune the script to match your trading strategy.
Professional Design : The script avoids clutter by limiting the number of lines displayed and using ATR-based offsets for better visibility.
How to Use This Script
Add the Script to Your Chart :
Copy and paste the script into the Pine Editor in TradingView.
Save and add it to your chart.
Select Signal Type :
Use the "Signal Type" dropdown menu to choose the combination of indicators you want to use.
Adjust Parameters :
Customize the lengths of RSI, CCI, and Stochastic, as well as their overbought/oversold levels, to match your trading preferences.
Interpret Signals :
Look for green arrows and "BUY" labels for buy signals, and red arrows and "SELL" labels for sell signals.
Vertical lines will help you identify the exact bar where the signal occurred.
Tips for Traders
Backtest Thoroughly : Before using this script in live trading, backtest it on historical data to ensure it aligns with your strategy.
Combine with Other Tools : While this script provides reliable signals, consider combining it with other tools like support/resistance levels or volume analysis for additional confirmation.
Avoid Overloading the Chart : If you notice too many signals, try tightening the overbought/oversold levels or switching to a combined signal type (e.g., "RSI & CCI & Stochastic") for fewer but higher-confidence signals.
Pine Script® インジケーター