BB 100 with BarcolorsI cleaned up the highlight barcolor to reflect red or lime depending if it closed > or < the open.
The description is in the code. you want to catch bounces off the 25 (upper or lower) and 100 (upper or lower).
Works well on the hourly and 30 min charts. Haven't tested it beyond that. Haven't tested Forex, just equities.
"哪吒2票房破25亿"に関するスクリプトを検索

LBR Paintbars [LazyBear]
Added coloring of LB bars above/below Keltner Channel (as suggested by user @20813 below in the comments).
Updated code: pastebin.com
See comments section below for a sample chart. Copy the code from the pastebin above and update your local copy (TV doesn't allow me to update an already published code -- yet!).
Added features:
- Switch ON/OFF KC
- Mark LB bars above/below KC
----------------------------------------------------------------------
The LBR PaintBars indicator changes the colour of the price bars based on the trend direction (derived from price & volatility bands). This is mostly used as a confirmation indicator.
For the Pine coders: I suggest trying stdev() in lieu of atr()...some wild combinations can be derived from this simple idea :)
Indicator supports the following options:
- Switching on/off volatility bands
- Switching on/off LBR colors (lime/maroon).
- Color non-LBR bars (blue).
Thanks @mseaworthy for pinging me with this idea.
Complete list of my indicators:
-----------------------------
docs.google.com

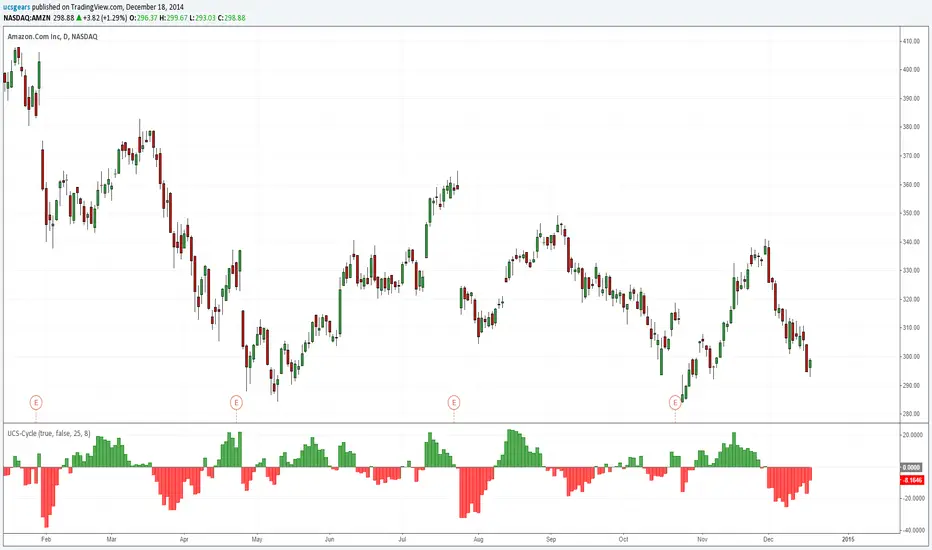
UCS_CycleThis indicator was designed to remove trend from price and make it easier to identify cycles.
Although this indicator has similarities to MACD. It is better used to identify the cycle of High and Lows based on the Statistical Data (Default is set to 25).
**** DO NOT USE THIS AS A MOMENTUM INDICATOR ****
Directional Movement Index + ADX & Keylevel SupportADX and DMI oscillator with the keylevel coded in to the script, set for 23, suggested settings is 23 - 25 any trade with the ADX above the keylevel is a strong indicator that it is trending.

True Strength Indicator MTFHere is an example of a script showing a multi-time frame of TSI.
Chart below compares FX EURUSD Daily TSI to 1H TSI
Here is an updated version
study("True Strength Indicator MTF", shorttitle="TSI MTF")
resCustom = input(title="Timeframe", type=resolution, defval="60" )
long = input(title="Long Length", type=integer, defval=25)
short = input(title="Short Length", type=integer, defval=13)
signal = input(title="Signal Length", type=integer, defval=13)
price = close
double_smooth(src, long, short) =>
fist_smooth = ema(src, long)
ema(fist_smooth, short)
pc = change(price)
double_smoothed_pc = double_smooth(pc, long, short)
double_smoothed_abs_pc = double_smooth(abs(pc), long, short)
tsi_value = 100 * (double_smoothed_pc / double_smoothed_abs_pc)
tsi = security(tickerid, resCustom,tsi_value)
plot(tsi, color=black)
plot(ema(tsi, signal), color=red)
hline(0, title="Zero")

TFS: MBO indicator MBO indicator is the third component of TFS trading system. This indicator
was developed by Bryan Strain and Mark Whitley.
The idea of MBO is similar to moving average convergence/divergence (MACD)
indicator. It is calculated by subtracting the 200-day moving average from
the 25-day moving average.
