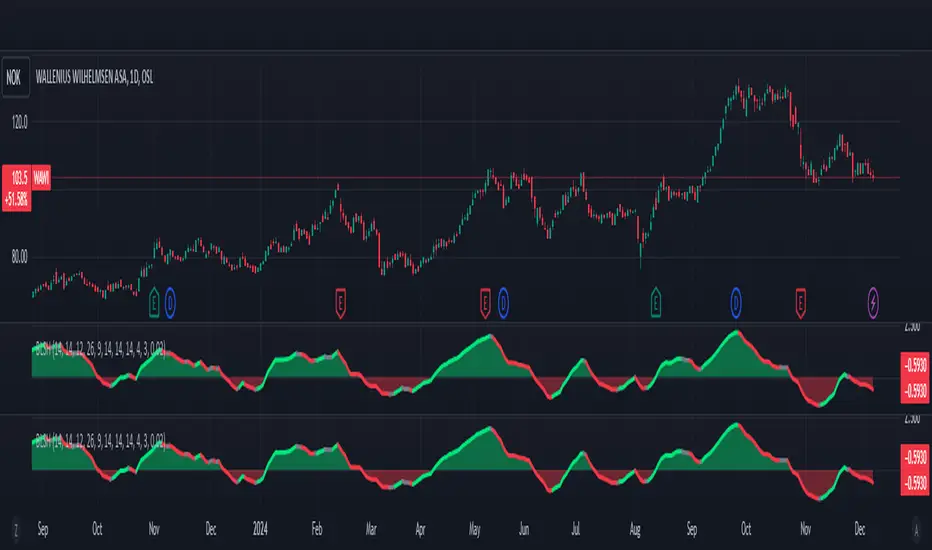
Buy Low Sell High Composite Upgraded V6 [kristian6ncqq]NOTICE: This script is an upgraded and enhanced version of the original "Buy Low Sell High Composite" indicator by (published in 2017).
The original script provided a composite indicator combining multiple technical analysis metrics such as RSI, MACD, and MFI.
Why I Republished This Script
I found the original indicator to be exceptionally useful for identifying optimal accumulation zones for stocks or assets when prices are low (red area) and potential profit-taking zones when prices are high (green area).
To ensure it remains accessible and functional for modern trading strategies, I have updated and enhanced the original version with additional features and flexibility.
Intended Use
This indicator is designed for traders and investors looking to:
Accumulate stocks or assets when the price is in the low (red) zone.
Take profits or reduce positions when the price is in the high (green) zone.
The composite score provides a clear visualization of multiple technical indicators combined into a single actionable signal.
Enhancements in This Version
Updated to Pine Script v6 (from version 3).
Added input parameters for key settings (e.g., RSI length, MACD parameters, smoothing).
Introduced Chande Momentum Oscillator (CMO) and directional ADX for improved trend detection.
Implemented slope-based trend coloring for outer edges to highlight significant changes in trend direction.
Enhanced visualizations with customizable thresholds and smoothing for improved usability.
Credits
Original script: "Buy Low Sell High Composite" by , 2017.
URL to the original script: Buy Low Sell High Composite.
This script is designed to build upon the strengths of the original while adding flexibility and new features to meet the needs of modern traders.
"海陆重工技术面关键指标(RSI、MACD、布林带)最新数据"に関するスクリプトを検索
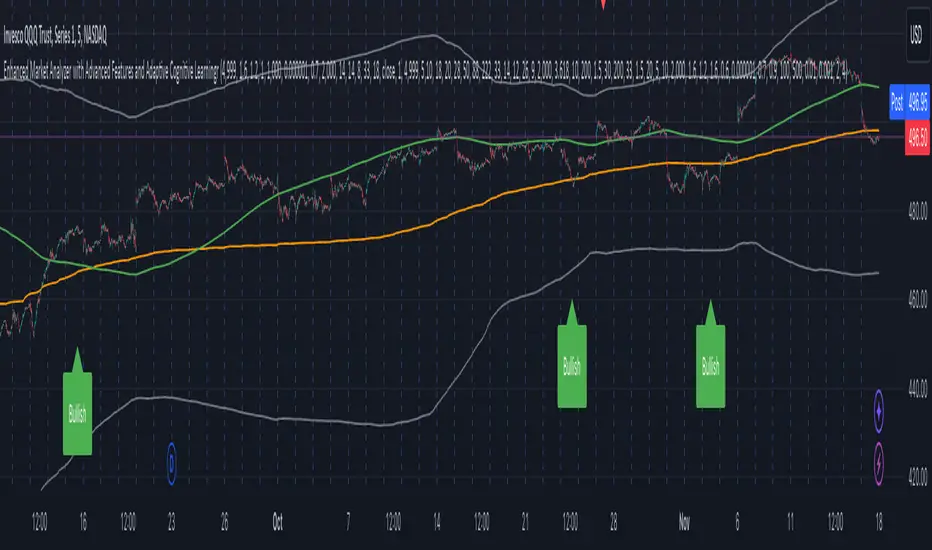
Enhanced Market Analyzer with Adaptive Cognitive LearningThe "Enhanced Market Analyzer with Advanced Features and Adaptive Cognitive Learning" is an advanced, multi-dimensional trading indicator that leverages sophisticated algorithms to analyze market trends and generate predictive trading signals. This indicator is designed to merge traditional technical analysis with modern machine learning techniques, incorporating features such as adaptive learning, Monte Carlo simulations, and probabilistic modeling. It is ideal for traders who seek deeper market insights, adaptive strategies, and reliable buy/sell signals.
Key Features:
Adaptive Cognitive Learning:
Utilizes Monte Carlo simulations, reinforcement learning, and memory feedback to adapt to changing market conditions.
Adjusts the weighting and learning rate of signals dynamically to optimize predictions based on historical and real-time data.
Hybrid Technical Indicators:
Custom RSI Calculation: An RSI that adapts its length based on recursive learning and error adjustments, making it responsive to varying market conditions.
VIDYA with CMO Smoothing: An advanced moving average that incorporates Chander Momentum Oscillator for adaptive smoothing.
Hamming Windowed VWMA: A volume-weighted moving average that applies a Hamming window for smoother calculations.
FRAMA: A fractal adaptive moving average that responds dynamically to price movements.
Advanced Statistical Analysis:
Skewness and Kurtosis: Provides insights into the distribution and potential risk of market trends.
Z-Score Calculations: Identifies extreme market conditions and adjusts trading thresholds dynamically.
Probabilistic Monte Carlo Simulation:
Runs thousands of simulations to assess potential price movements based on momentum, volatility, and volume factors.
Integrates the results into a probabilistic signal that informs trading decisions.
Feature Extraction:
Calculates a variety of market metrics, including price change, momentum, volatility, volume change, and ATR.
Normalizes and adapts these features for use in machine learning algorithms, enhancing signal accuracy.
Ensemble Learning:
Combines signals from different technical indicators, such as RSI, MACD, Bollinger Bands, Stochastic Oscillator, and statistical features.
Weights each signal based on cumulative performance and learning feedback to create a robust ensemble signal.
Recursive Memory and Feedback:
Stores and averages past RSI calculations in a memory array to provide historical context and improve future predictions.
Adaptive memory factor adjusts the influence of past data based on current market conditions.
Multi-Factor Dynamic Length Calculation:
Determines the length of moving averages based on volume, volatility, momentum, and rate of change (ROC).
Adapts to various market conditions, ensuring that the indicator is responsive to both high and low volatility environments.
Adaptive Learning Rate:
The learning rate can be adjusted based on market volatility, allowing the system to adapt its speed of learning and sensitivity to changes.
Enhances the system's ability to react to different market regimes.
Monte Carlo Simulation Engine:
Simulates thousands of random outcomes to model potential future price movements.
Weights and aggregates these simulations to produce a final probabilistic signal, providing a comprehensive risk assessment.
RSI with Dynamic Adjustments:
The initial RSI length is adjusted recursively based on calculated errors between true RSI and predicted RSI.
The adaptive RSI calculation ensures that the indicator remains effective across various market phases.
Hybrid Moving Averages:
Short-Term and Long-Term Averages: Combines FRAMA, VIDYA, and Hamming VWMA with specific weights for a unique hybrid moving average.
Weighted Gradient: Applies a color gradient to indicate trend strength and direction, improving visual clarity.
Signal Generation:
Generates buy and sell signals based on the ensemble model and multi-factor analysis.
Uses percentile-based thresholds to determine overbought and oversold conditions, factoring in historical data for context.
Optional settings to enable adaptation to volume and volatility, ensuring the indicator remains effective under different market conditions.
Monte Carlo and Learning Parameters:
Users can customize the number of Monte Carlo simulations, learning rate, memory factor, and reward decay for tailored performance.
Applications:
Scalping and Day Trading:
The fast response of the adaptive RSI and ensemble learning model makes this indicator suitable for short-term trading strategies.
Swing Trading:
The combination of long-term moving averages and probabilistic models provides reliable signals for medium-term trends.
Volatility Analysis:
The ATR, Bollinger Bands, and adaptive moving averages offer insights into market volatility, helping traders adjust their strategies accordingly.
TrendPivotsLibrary "TrendPivots"
This library provides functions to search for bullish and bearish divergences between pivots and indicators. Functions search for higher highs and lower lows, automating lines, labels and signals for technical analysis and strategies.
method maxBeforeLast(id)
Method function to get the maximum price before the last, stored in an array pivotPoint.
Namespace types: pivotPoint
Parameters:
id (pivotPoint ) : (array pivotPoint) The pivotPoint array to inspect.
Returns: pivotPoint
method minBeforeLast(id)
Method function to get the minimum price before the last, stored in an array pivotPoint.
Namespace types: pivotPoint
Parameters:
id (pivotPoint ) : (array pivotPoint) The pivotPoint array to inspect.
Returns: pivotPoint
method pivotLine(id, a, b, color)
Sets the coordinates of a given line using two pivotPoint variables.
Namespace types: series line
Parameters:
id (line) : (line) Existing line
a (pivotPoint) : (pivotPoint) First pivotPoint.
b (pivotPoint) : (pivotPoint) Second pivotPoint.
color (color) : (color) The desired color. Default is red.
Returns: void
bearishDivergence(pivotArray)
Look for bearish divergence in a pivotPoint array cointaining pivot highs.
Parameters:
pivotArray (pivotPoint ) : (array pivotPoint) The pivotPoint array to inspect.
Returns: bool True if bearish divergence was found.
bullishDivergence(pivotArray)
Look for bullish divergence in a pivotPoint array cointaining pivot lows.
Parameters:
pivotArray (pivotPoint ) : (array pivotPoint) The pivotPoint array to inspect.
Returns: bool True if bullish divergence was found.
uptrendPivot(leftBars, rightBars, indicator, reset, plotLabel, plotLine)
Detects higher highs, higher lows and bearish divergence in an uptrend. Creates a line when bearish divergence is found, and labels.
Parameters:
leftBars (int) : (int)
rightBars (int) : (int)
indicator (float) : (float) RSI, MACD or other value.
reset (bool) : (bool) A bool variable to reinitiates the pivot computation, such as time changes, crossovers, or another.
plotLabel (bool) : (bool) If true (default), plots labels to higher highs and for each pivot low. Default = true.
plotLine (bool) : (bool) If true (default), plots a line linking the lower lows with divergence. Default = true.
Returns:
downtrendPivot(leftBars, rightBars, indicator, reset, plotLabel, plotLine)
Detects lower lows, lower highs, and bullish divergence in a downtrend. Creates a line when bullish divergence is found, and labels.
Parameters:
leftBars (int) : (int)
rightBars (int) : (int)
indicator (float) : (float) RSI, MACD or other value.
reset (bool) : (bool) A bool variable to reinitiates the pivot computation, such as time changes, crossovers, or another.
plotLabel (bool) : (bool) If true (default), plots labels to lower lows, and for each pivot low.
plotLine (bool) : (bool) If true (default), plots a line linking the lower lows with divergence. Default = true.
Returns:
pivotPoint
The coordinates of a pivot point and corresponding indicator value.
Fields:
x (series int) : (int) Time.
y (series float) : (float) Price.
indicator (series float) : (float) Indicator value.

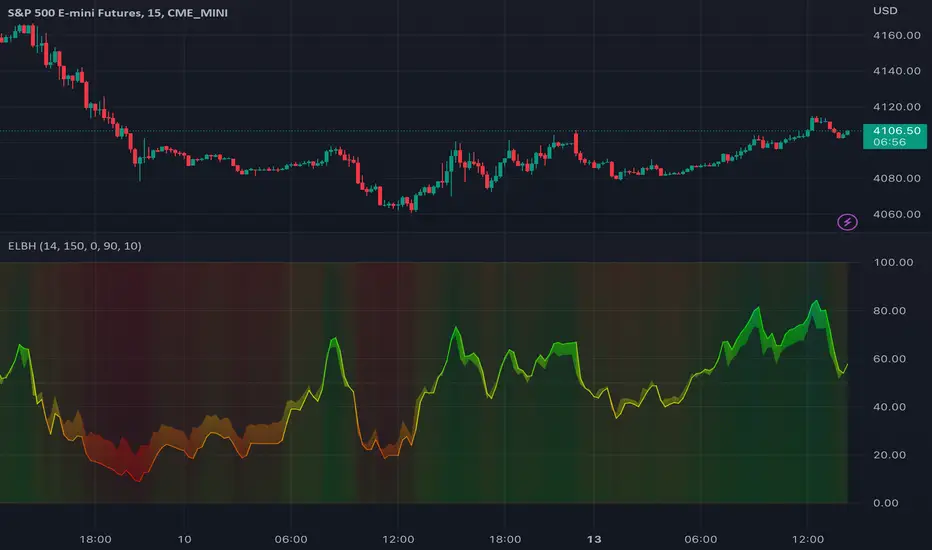
Fibonacci Oscillator (Expo)█ Overview
The Fibonacci Oscillator is a multi-faceted oscillator designed to provide traders with a comprehensive understanding of market trends and retracement points. Built on the Fibonacci ratios, it combines the functionalities of popular oscillators like RSI and MACD with unique insights into the market structure. This oscillator not only helps identify trend direction but also pinpoints overbought and oversold levels, making it an essential tool for various trading strategies.
█ How to Use
Identify Trends
Use the oscillator to identify the direction of the market trend.
Identify Retracements
Use the oscillator to identify the retracements.
█ Settings
Fibonacci Settings
These settings let you customize the Fibonacci level to focus on, thereby allowing you to tailor the oscillator according to your trading preferences.
Oscillator Settings
You can also choose between different oscillator types (RSI, MACD, Histogram) and adjust their respective settings like lengths, signals, and colors.
-----------------
Disclaimer
The information contained in my Scripts/Indicators/Ideas/Algos/Systems does not constitute financial advice or a solicitation to buy or sell any securities of any type. I will not accept liability for any loss or damage, including without limitation any loss of profit, which may arise directly or indirectly from the use of or reliance on such information.
All investments involve risk, and the past performance of a security, industry, sector, market, financial product, trading strategy, backtest, or individual's trading does not guarantee future results or returns. Investors are fully responsible for any investment decisions they make. Such decisions should be based solely on an evaluation of their financial circumstances, investment objectives, risk tolerance, and liquidity needs.
My Scripts/Indicators/Ideas/Algos/Systems are only for educational purposes!

Price Deviation Indicator (PDI)Management
The Price Deviation Indicator (PDI) was developed by "DimArt". This indicator allows you to determine the percentage deviation of the price from its average value over a certain period of time. The larger the deviation, the higher the histogram on the indicator chart. The PDI indicator can be useful for identifying a trend reversal in combination with other technical indicators, such as RSI, MACD, and others. For example, if the RSI and MACD indicators show the beginning of a possible trend reversal, using the PDI indicator can confirm this signal by showing the deviation of the current price from the average price. This can help the trader make more accurate trading decisions based on a strong signal.
Description
To calculate the values of the "Price Deviation Indicator" (PDI), we use the following steps:
• Determine the "Period" variable, which specifies the number of bars used to calculate the average price. (Default value is 20)
• Calculate the average price over the specified period using the "sma()" (simple moving average) function.
• Calculate the percentage difference between the current price and the average price using the formula: ((close - avg_price) / avg_price) * 100 .
• Set levels to change the color of the histogram based on price deviation from the average value. "Histogram Color" is a parameter to customize the color of the histogram based on deviation levels. By default, if the deviation is more than 5%, the histogram will be red; if it is less than -5%, it will be green, and for all other deviations, it will be blue. However, this parameter can be changed to other values.
• Draw a histogram of price change relative to the average value. The "Style" parameter allows you to choose the style of the indicator (histogram). By default, the "Histogram" style is set, but you can also select "Line on Close" or "Line on Open".
Application of the Indicator
The PDI indicator is based on the assumption that the price of any asset always tends to its mean value. Using PDI on higher timeframes allows you to determine the overall market trend, whereas on smaller timeframes, situations can be found when the price is in negative territory, and the histogram starts to smoothly transition from negative to positive value. This can be a signal to buy, as the price is likely in an oversold condition and ready to change its trend. On the other hand, if the strength of the price slows down or begins to approach 0, this may indicate that the asset is overbought and starting to turn towards oversold, which is a signal to sell. A beautiful feature of the PDI indicator is its simplicity and conciseness, which allows you to quickly and easily identify a trend change and make trading decisions based on a strong signal.
Conclusion
The "Price Deviation Indicator" (PDI) can be useful in analyzing price movements in the market. It allows you to calculate the relative difference between the current price and the average price, allowing you to identify market saturation and change in trend. The indicator can be used in technical analysis to make decisions about buying or selling assets on the exchange. It can also be useful for traders of different levels of experience, as its settings can be adapted depending on the user's needs and requirements. Overall, this indicator is one of the tools that can help in analyzing price and volumes to determine possible investment prospects in assets.

AI-Bank-Nifty Tech AnalysisThis code is a TradingView indicator that analyzes the Bank Nifty index of the Indian stock market. It uses various inputs to customize the indicator's appearance and analysis, such as enabling analysis based on the chart's timeframe, detecting bullish and bearish engulfing candles, and setting the table position and style.
The code imports an external script called BankNifty_CSM, which likely contains functions that calculate technical indicators such as the RSI, MACD, VWAP, and more. The code then defines several table cell colors and other styling parameters.
Next, the code defines a table to display the technical analysis of eight bank stocks in the Bank Nifty index. It then defines a function called get_BankComponent_Details that takes a stock symbol as input, requests the stock's OHLCV data, and calculates several technical indicators using the imported CSM_BankNifty functions.
The code also defines two functions called get_EngulfingBullish_Detection and get_EngulfingBearish_Detection to detect bullish and bearish engulfing candles.
Finally, the code calculates the technical analysis for each bank stock using the get_BankComponent_Details function and displays the results in the table. If the engulfing input is enabled, the code also checks for bullish and bearish engulfing candles and displays buy/sell signals accordingly.
The FRAMA stands for "Fractal Adaptive Moving Average," which is a type of moving average that adjusts its smoothing factor based on the fractal dimension of the price data. The fractal dimension reflects self-similarity at different scales. The FRAMA uses this property to adapt to the scale of price movements, capturing short-term and long-term trends while minimizing lag. The FRAMA was developed by John F. Ehlers and is commonly used by traders and analysts in technical analysis to identify trends and generate buy and sell signals. I tried to create this indicator in Pine.
In this context, "RS" stands for "Relative Strength," which is a technical indicator that compares the performance of a particular stock or market sector against a benchmark index.
The "Alligator" is a technical analysis tool that consists of three smoothed moving averages. Introduced by Bill Williams in his book "Trading Chaos," the three lines are called the Jaw, Teeth, and Lips of the Alligator. The Alligator indicator helps traders identify the trend direction and its strength, as well as potential entry and exit points. When the three lines are intertwined or close to each other, it indicates a range-bound market, while a divergence between them indicates a trending market. The position of the price in relation to the Alligator lines can also provide signals, such as a buy signal when the price crosses above the Alligator lines and a sell signal when the price crosses below them.
In addition to these, we have several other commonly used technical indicators, such as MACD, RSI, MFI (Money Flow Index), VWAP, EMA, and Supertrend. I used all the built-in functions for these indicators from TradingView. Thanks to the developer of this TradingView Indicator.
I also created a BankNifty Components Table and checked it on the dashboard.

TASC 2023.03 Every Little Bit Helps█ OVERVIEW
TASC's February 2023 edition of Traders' Tips includes an article titled "Every Little Bit Helps: Averaging The Open And Close To Reduce Noise" by John Ehlers. This code implements the numerical example from this article.
█ CONCEPTS
Using theories from digital signal processing as a starting point, John Ehlers argues that using the average of the open and close as the source time series of an indicator instead of using only the closing price can often lead to noise reduction in the output. This effect especially applies when there is no gap between the current bar's opening and the previous bar's closing prices. This trick can reduce noise in many common indicators such as the RSI, MACD, and Stochastic.
█ CALCULATIONS
Following the example presented in the original publication, this script illustrates the proposed strategy using the Relative Strength Index (RSI) as a test indicator. It plots two series:
RSI calculated using only closing prices as its source.
RSI of the same length as the first, but calculated using the average of open and close prices as its source, i.e. (open+close)/2 .
This script demonstrates that using the average of open and close as the calculation source results in a smoother indicator. To visually emphasize the advantage of this proposed trick, the script's color scheme is sensitive to both the RSI value and the difference between the two RSI data streams.
Multi Signal RSI MACD HIgh Lo & indicator Macd BB SMA Heat BandsBuy and sell signal and indicator Macd BB SMA Heat Bands
Multi Signal RSI MACD Gann buy ans sell signal zwith RSI, zerollagMacd and highLow Gann and & indicator Macd head band Bollinger & SMA

AI's Opinion Trading System V21. Complete Summary of the Indicator Script
AI’s Opinion Trading System V2 is an advanced, multi-factor trading tool designed for the TradingView platform. It combines several technical indicators (moving averages, RSI, MACD, ADX, ATR, and volume analysis) to generate buy, sell, and hold signals. The script features a customizable AI “consensus” engine that weighs multiple indicator signals, applies user-defined filters, and outputs actionable trade instructions with clear stop loss and take profit levels. The indicator also tracks sentiment, volume delta, and allows for advanced features like pyramiding (adding to positions), custom stop loss/take profit prices, and flexible signal confirmation logic. All key data and signals are displayed in a dynamic, color-coded table on the chart for easy review.
2. Full Explanation of the Table
The table is a real-time dashboard summarizing the indicator’s logic and recommendations for the most recent bars. It is color-coded for clarity and designed to help traders quickly understand market conditions and AI-driven trade signals.
Columns (from left to right):
Column Name What it Shows
Bar The time context: “Now” for the current bar, then “Bar -1”, “Bar -2”, etc. for previous bars.
Raw Consensus The raw AI consensus for each bar: “Buy”, “Sell”, or “-” (neutral).
Up Vol The amount of volume on up (rising) bars.
Down Vol The amount of volume on down (falling) bars.
Delta The difference between up and down volume. Green if positive, red if negative, gray if neutral.
Close The closing price for each bar, color-coded by price change.
Sentiment Diff The difference between the close and average sentiment price (a custom sentiment calculation).
Lookback The number of bars used for sentiment calculation (if enabled).
ADX The ADX value (trend strength).
ATR The ATR value (volatility measure).
Vol>Avg “Yes” (green) if volume is above average, “No” (red) otherwise.
Confirm Whether the AI signal is confirmed over the required bars.
Logic Output The AI’s interpreted signal after applying user-selected logic: “Buy”, “Sell”, or “-”.
Final Action The final signal after all filters: “Buy”, “Sell”, or “-”.
Trade Instruction A plain-English instruction: Buy/Sell/Add/Hold/No Action, with price, stop loss, and take profit.
Color Coding:
Green: Positive/bullish values or signals
Red: Negative/bearish values or signals
Gray: Neutral or inactive
Blue background: For all table cells, for visual clarity
White text: Default, except for color-coded cells
3. Full User Instructions for Every Input/Style Option
Below are plain-language instructions for every user-adjustable option in the indicator’s input and style pages:
Inputs
Table Location
What it does: Sets where the summary table appears on your chart.
How to use: Choose from 9 positions (Top Left, Top Center, Top Right, etc.) to avoid overlapping with other chart elements.
Decimal Places
What it does: Controls how many decimal places prices and values are displayed with.
How to use: Increase for assets with very small prices (e.g., SHIB), decrease for stocks or forex.
Show Sentiment Lookback?
What it does: Shows or hides the “Lookback” column in the table, which displays how many bars are used in the sentiment calculation.
How to use: Turn off if you want a simpler table.
AI View Mode
What it does: Selects the logic for how the AI combines signals from different indicators.
Majority: Follows the most common signal among all indicators.
Weighted: Uses custom weights for each type of signal.
Custom: Lets you define your own logic (see below).
How to use: Pick the logic style that matches your trading philosophy.
AI Consensus Weight / Vol Delta Weight / Sentiment Weight
What they do: When using “Weighted” AI View Mode, these let you set how much influence each factor (indicator consensus, volume delta, sentiment) has on the final signal.
How to use: Increase a weight to make that factor more important in the AI’s decision.
Custom AI View Logic
What it does: Lets advanced users write their own logic for when the AI should signal a trade (e.g., “ai==1 and delta>0 and sentiment>0”).
How to use: Only use if you understand basic boolean logic.
Use Custom Stop Loss/Take Profit Prices?
What it does: If enabled, you can enter your own fixed stop loss and take profit prices for buys and sells.
How to use: Turn on to override the auto-calculated SL/TP and enter your desired prices below.
Custom Buy/Sell Stop Loss/Take Profit Price
What they do: If custom SL/TP is enabled, these fields let you set exact prices for stop loss and take profit on both buy and sell trades.
How to use: Enter your preferred price, or leave at 0 for auto-calculation.
Sentiment Lookback
What it does: Sets how many bars the sentiment calculation should look back.
How to use: Increase to smooth out sentiment, decrease for faster reaction.
Max Pyramid Adds
What it does: Limits how many times you can add to an existing position (pyramiding).
How to use: Set to 1 for no adds, higher for more aggressive scaling in trends.
Signal Preset
What it does: Quick-sets a group of signal parameters (see below) for “Robust”, “Standard”, “Freedom”, or “Custom”.
How to use: Pick a preset, or select “Custom” to adjust everything manually.
Min Bars for Signal Confirmation
What it does: Sets how many bars a signal must persist before it’s considered valid.
How to use: Increase for more robust, less frequent signals; decrease for faster, but possibly less reliable, signals.
ADX Length
What it does: Sets the period for the ADX (trend strength) calculation.
How to use: Longer = smoother, shorter = more sensitive.
ADX Trend Threshold
What it does: Sets the minimum ADX value to consider a trend “strong.”
How to use: Raise for stricter trend confirmation, lower for more trades.
ATR Length
What it does: Sets the period for the ATR (volatility) calculation.
How to use: Longer = smoother volatility, shorter = more reactive.
Volume Confirmation Lookback
What it does: Sets how many bars are used to calculate the average volume.
How to use: Longer = more stable volume baseline, shorter = more sensitive.
Volume Confirmation Multiplier
What it does: Sets how much current volume must exceed average volume to be considered “high.”
How to use: Increase for stricter volume filter.
RSI Flat Min / RSI Flat Max
What they do: Define the RSI range considered “flat” (i.e., not trending).
How to use: Widen to be stricter about requiring a trend, narrow for more trades.
Style Page
Most style settings (such as plot colors, label sizes, and shapes) are preset in the script for visual clarity.
You can adjust plot visibility and colors (for signals, stop loss, take profit) in the TradingView “Style” tab as with any indicator.
Buy Signal: Shows as a green triangle below the bar when a buy is triggered.
Sell Signal: Shows as a red triangle above the bar when a sell is triggered.
Stop Loss/Take Profit Lines: Red and green lines for SL/TP, visible when a trade is active.
SL/TP Labels: Small colored markers at the SL/TP levels for each trade.
How to use:
Toggle visibility or change colors in the Style tab if you wish to match your chart theme or preferences.
In Summary
This indicator is highly customizable—you can tune every aspect of the AI logic, risk management, signal filtering, and table display to suit your trading style.
The table gives you a real-time, comprehensive view of all relevant signals, filters, and trade instructions.
All inputs are designed to be intuitive—hover over them in TradingView for tooltips, or refer to the explanations above for details.

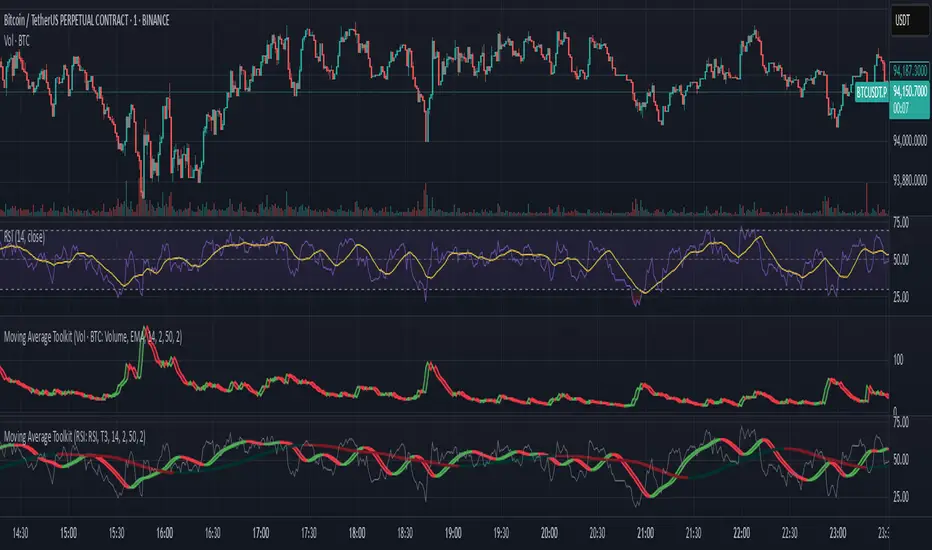
Moving Average ToolkitMoving Average Toolkit - Advanced MA Analysis with Flexible Source Input
A powerful and versatile moving average indicator designed for maximum flexibility. Its unique source input feature allows you to analyze moving averages of ANY indicator or price data, making it perfect for creating custom combinations with RSI, Volume, OBV, or any other technical indicator.
Key Features:
• Universal Source Input:
- Analyze moving averages of any data: Price, Volume, RSI, MACD, Custom Indicators
- Perfect for creating advanced technical setups
- Identify trends in any technical data
• 13 Moving Average Types:
- Traditional: SMA, EMA, WMA, RMA, VWMA
- Advanced: HMA, T3, DEMA, TEMA, KAMA, ZLEMA, McGinley, EPMA
• Dual MA System:
- Compare two different moving averages
- Independent settings for each MA
- Perfect for multiple timeframe analysis
• Visual Offset Analysis:
- Dynamic color changes based on momentum
- Fill between current and offset values
- Clear visualization of trend strength
Usage Examples:
• Price Trend: Traditional MA analysis using price data
• Volume Trend: Apply MA to volume for volume trend analysis
• RSI Trend: Smooth RSI movements for clearer signals
• Custom: Apply to any indicator output for unique insights
Settings:
• Fully customizable colors for bull/bear conditions
• Adjustable offset periods
• Independent length settings
• Optional second MA for comparison
Perfect for:
• Advanced technical analysts
• Multi-indicator strategy developers
• Custom indicator creators
• Traders seeking flexible analysis tools
This versatile toolkit goes beyond traditional moving averages by allowing you to apply sophisticated MA analysis to any technical data, creating endless possibilities for custom technical analysis strategies.
Global M2 Index Percentage### **Global M2 Index Percentage**
**Description:**
The **Global M2 Index Percentage** is a custom indicator designed to track and visualize the global money supply (M2) in a normalized percentage format. It aggregates M2 data from major economies (e.g., the US, EU, China, Japan, and the UK) and adjusts for exchange rates to provide a comprehensive view of global liquidity. This indicator helps traders and investors understand the broader macroeconomic environment, identify trends in money supply, and make informed decisions based on global liquidity conditions.
---
### **How It Works:**
1. **Data Aggregation**:
- The indicator collects M2 data from key economies and adjusts it using exchange rates to calculate a global M2 value.
- The formula for global M2 is:
\
2. **Normalization**:
- The global M2 value is normalized into a percentage (0% to 100%) based on its range over a user-defined period (default: 13 weeks).
- The formula for normalization is:
\
3. **Visualization**:
- The indicator plots the M2 Index as a line chart.
- Key reference levels are highlighted:
- **10% (Red Line)**: Oversold level (low liquidity).
- **50% (Black Line)**: Neutral level.
- **80% (Green Line)**: Overbought level (high liquidity).
---
### **How to Use the Indicator:**
#### **1. Understanding the M2 Index:**
- **Below 10%**: Indicates extremely low liquidity, which may signal economic contraction or tight monetary policy.
- **Above 80%**: Indicates high liquidity, which may signal loose monetary policy or potential inflationary pressures.
- **Between 10% and 80%**: Represents a neutral to moderate liquidity environment.
#### **2. Trading Strategies:**
- **Long-Term Investing**:
- Use the M2 Index to assess global liquidity trends.
- **High M2 Index (e.g., >80%)**: Consider investing in risk assets (stocks, commodities) as liquidity supports growth.
- **Low M2 Index (e.g., <10%)**: Shift to defensive assets (bonds, gold) as liquidity tightens.
- **Short-Term Trading**:
- Combine the M2 Index with technical indicators (e.g., RSI, MACD) for timing entries and exits.
- **M2 Index Rising + RSI Oversold**: Potential buying opportunity.
- **M2 Index Falling + RSI Overbought**: Potential selling opportunity.
#### **3. Macroeconomic Analysis**:
- Use the M2 Index to monitor the impact of central bank policies (e.g., quantitative easing, rate hikes).
- Correlate the M2 Index with inflation data (CPI, PPI) to anticipate inflationary or deflationary trends.
---
### **Key Features:**
- **Customizable Timeframe**: Adjust the lookback period (e.g., 13 weeks, 26 weeks) to suit your trading style.
- **Multi-Economy Data**: Aggregates M2 data from the US, EU, China, Japan, and the UK for a global perspective.
- **Normalized Output**: Converts raw M2 data into an easy-to-interpret percentage format.
- **Reference Levels**: Includes key levels (10%, 50%, 80%) for quick analysis.
---
### **Example Use Case:**
- **Scenario**: The M2 Index rises from 49% to 62% over two weeks.
- **Interpretation**: Global liquidity is increasing, potentially due to central bank stimulus.
- **Action**:
- **Long-Term**: Increase exposure to equities and commodities.
- **Short-Term**: Look for buying opportunities in oversold assets (e.g., RSI < 30).
---
### **Why Use the Global M2 Index Percentage?**
- **Macro Insights**: Understand the broader economic environment and its impact on financial markets.
- **Risk Management**: Identify periods of high or low liquidity to adjust your portfolio accordingly.
- **Enhanced Timing**: Combine with technical analysis for better entry and exit points.
---
### **Conclusion:**
The **Global M2 Index Percentage** is a powerful tool for traders and investors seeking to incorporate macroeconomic data into their strategies. By tracking global liquidity trends, this indicator helps you make informed decisions, whether you're trading short-term or planning long-term investments. Add it to your TradingView charts today and gain a deeper understanding of the global money supply!
---
**Disclaimer**: This indicator is for informational purposes only and should not be considered financial advice. Always conduct your own research and consult with a professional before making investment decisions.

HOD/LOD/PMH/PML/PDH/PDL Strategy by @tradingbauhaus This script is a trading strategy @tradingbauhaus designed to trade based on key price levels, such as the High of Day (HOD), Low of Day (LOD), Premarket High (PMH), Premarket Low (PML), Previous Day High (PDH), and Previous Day Low (PDL). Below, I’ll explain in detail what the script does:
Core Functionality of the Script:
Calculates Key Price Levels:
HOD (High of Day): The highest price of the current day.
LOD (Low of Day): The lowest price of the current day.
PMH (Premarket High): The highest price during the premarket session (before the market opens).
PML (Premarket Low): The lowest price during the premarket session.
PDH (Previous Day High): The highest price of the previous day.
PDL (Previous Day Low): The lowest price of the previous day.
Draws Horizontal Lines on the Chart:
Plots horizontal lines on the chart for each key level (HOD, LOD, PMH, PML, PDH, PDL) with specific colors for easy visual identification.
Defines Entry and Exit Rules:
Long Entry (Buy): If the price crosses above the PMH (Premarket High) or the PDH (Previous Day High).
Short Entry (Sell): If the price crosses below the PML (Premarket Low) or the PDL (Previous Day Low).
Long Exit: If the price reaches the HOD (High of Day) during a long position.
Short Exit: If the price reaches the LOD (Low of Day) during a short position.
How the Script Works Step by Step:
Calculates Key Levels:
Uses the request.security function to fetch the HOD and LOD of the current day, as well as the highs and lows of the previous day (PDH and PDL).
Calculates the PMH and PML during the premarket session (before 9:30 AM).
Plots Levels on the Chart:
Uses the plot function to draw horizontal lines on the chart representing the key levels (HOD, LOD, PMH, PML, PDH, PDL).
Each level has a specific color for easy identification:
HOD: White.
LOD: Purple.
PDH: Orange.
PDL: Blue.
PMH: Green.
PML: Red.
Defines Trading Rules:
Uses conditions with ta.crossover and ta.crossunder to detect when the price crosses key levels.
Long Entry: If the price crosses above the PMH or PDH, a long position (buy) is opened.
Short Entry: If the price crosses below the PML or PDL, a short position (sell) is opened.
Long Exit: If the price reaches the HOD during a long position, the position is closed.
Short Exit: If the price reaches the LOD during a short position, the position is closed.
Executes Orders Automatically:
Uses the strategy.entry and strategy.close functions to open and close positions automatically based on the defined rules.
Advantages of This Strategy:
Based on Key Levels: Uses important price levels that often act as support and resistance.
Easy to Visualize: Horizontal lines on the chart make it easy to identify levels.
Automated: Entries and exits are executed automatically based on the defined rules.
Limitations of This Strategy:
Dependent on Volatility: Works best in markets with significant price movements.
False Crosses: There may be false crosses that generate incorrect signals.
No Advanced Risk Management: Does not include dynamic stop-loss or take-profit mechanisms.
How to Improve the Strategy:
Add Stop-Loss and Take-Profit: To limit losses and lock in profits.
Filter Signals with Indicators: Use RSI, MACD, or other indicators to confirm signals.
Optimize Levels: Adjust key levels based on the asset’s behavior.
In summary, this script is a trading strategy that operates based on key price levels, such as HOD, LOD, PMH, PML, PDH, and PDL. It is useful for traders who want to trade based on significant support and resistance levels.

Multiple Oscillator Conditions Final [siulian] v2This tool is created to gather multiple oscilators condition under the same umbrela and back-test your idea.
Basically the only intention of this tool is to used in combination with a back-tester indicator ( or manually ) where you get the entry based on the cumulative signals provided by this tool.
For example you can to combine RSI , MACD, CCI, Keltner Channels or whatever indicator you think it might give you an edge for an entry signal.
You can combine up to 7 indicators either by comparing them with a static value or with another indicator (for example you can compare RSI with RSI MA, Volume with Volume MA, etc)
There are two lines which will be printed.
1) Result(blue line) - it will print 1 when all the condition are met ( the same can be used for back-testing tools)
2) Condition Met count(yellow line) - which will count how many conditions from the ones selected are triggered ( for example you have 6 indicators that are matching the conditions and you still want to take a trade even if the condition number 7 is not met)
Alarms can be setup to check if more than defined conditions are present.
As a demo in the above image i have put several condition in order to possible catch bottoms.
Please understand this is just an example on how to integrate multiple condition into a single entity and should not be used as is.
1) price should close below KC
2) CCI < - 100
3) RSI < 30
4) Vol > Vol MA
Past performance do not guarantee future performance.

TTP PNR filterPNR filter uses the "percentile nearest rank" method to produce signals from any source including oscillator indicators and price bars.
Features:
* Length - how many candles back in time to use for calculating PNR
* % low and high - what range of the spread of values captured will form the PNR band. Use 99&100 to create a band on the 1% highest percentile or 0&1 to create a band in the lowest percentile. It accepts float numbers so you can find very rare occurrences.
* src - by default it will use the close price but PNR filter can be used with any source. It's particularly useful when working with oscillators like RSI, MACD, ADX, etc.
* Signal direction - The indicator will print 1 when the selected conditions are met. Once the PNR band is plotted you can chose from cross over, cross under, above and below conditions to trigger a signal.
* Signal source - the band consists in a % low and % high, this option allows you to pick which band will be used with the "signal direction" parameter.
Example configuration:
1) Select 200 as the length
2) Select % low 0 and % high 1
3) Add RSI to the chart and select it as the source parameter
4) Select signal direction cross over
5) Select signal source % high which corresponds to the 1% band
In this setup you are finding values of RSI that in the past 200 candles have been that low only 1% of the time. With each new candle the calculation window will move as well leaving the oldest candle out.

CANDLE STICK HEATMAPCANDLE STICK HEATMAP shows the statistics of a candle at a particular time. its very useful to find repeating pattern's at a particular time in a day.
based on the settings you can see regular repeating patterns of a day in an hourly chart. During a particular time in day there is always a down or up signal or candles.
The table boxes are candles in RED and GREEN based on open and close of the chart. The Heat map is very useful in analyzing the daily Hourly candlesticks in a week. The Time of each candlestick is plotted on the table along with default Indicators like RSI, MACD, EMA, VOLUME, ADX.
Additionally this can be used as a screener of candles on all timeframes. Analysis is easy when you want to see what happened exactly at a particular time in the previous hour, day, month etc.,
Hopefully additional updates will be introduced shortly.
Indicators:
1. MACD (close,12,26,9)
2.RSI (close,14)
3.EMA 200
3.Volume MA
Option is provided to show indicator statistics and time.
Color can be changed using settings.
Supports all Time Zones

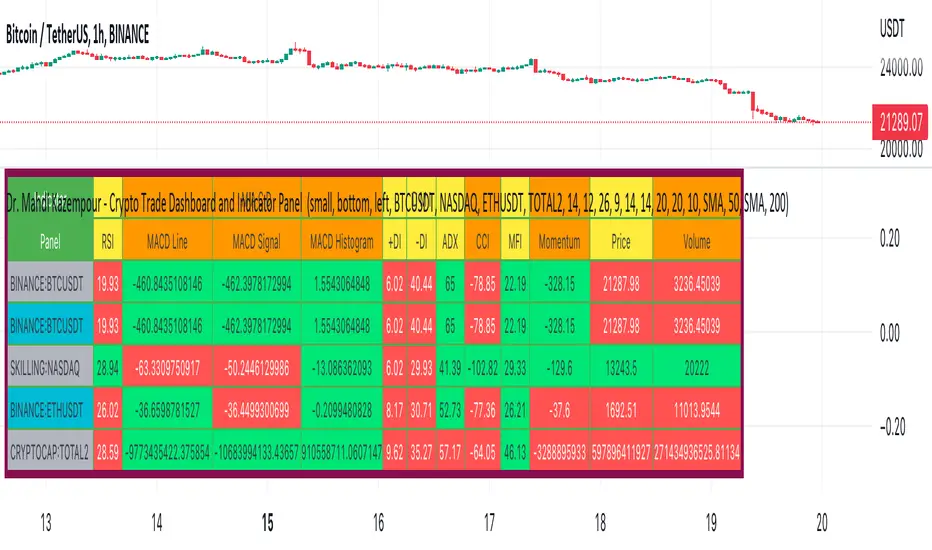
Dr. Mahdi Kazempour - Crypto Trade Dashboard and Indicator PanelA great panel for crypto traders all in one table:
Price, Volume, RSI, MACD, ADI, MOM
1) current symbol
2) BTCUSDT
3) NASDAQ
4) ETHUSDT
5) TOTAL2
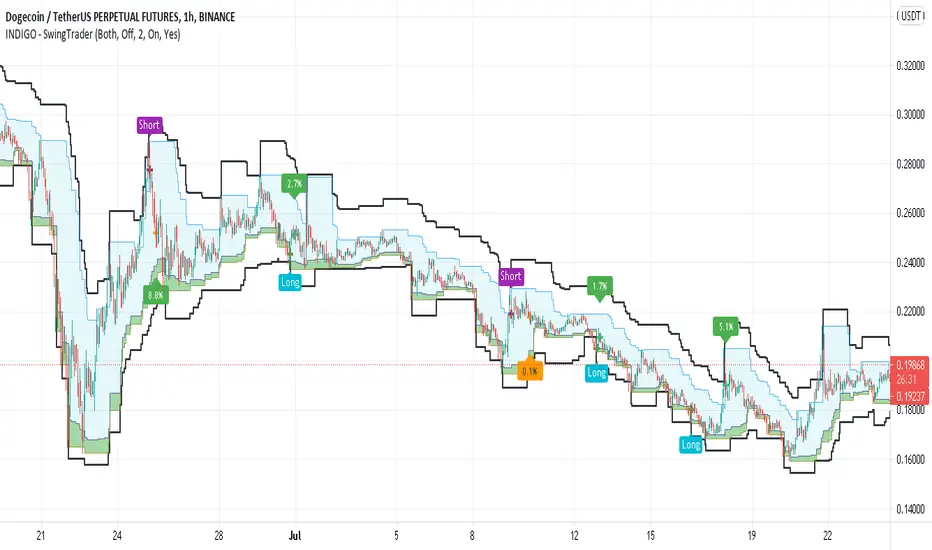
INDIGO - SwingTraderThis is a script that uses a couple of other indicators to find good swing trade entry's and exit's. You can choose which signals the script uses to calculate the position of the signals.
It uses the following:
- Stoch RSI
- MACD
- POC
- INDIGO Cloud
Also added are volume candles, acceleration of momentum indicators (triangle) and MACD candles. This way you can see more info to decide if the entry is valid.
I have used a couple of public scripts and tried to give credit to the original creators. If there is any script that hasn't been credited, please contact me.
Feedback is very much appreciated, positive and negative. Also If you have any question, feel free to ask me. I'll try to answer asap.
Enjoy the script :)
Divergence for Many Indicators v4Hello Traders,
Here is my new year gift for the community, Digergence for Many Indicators v4 . I tried to make it modular and readable as much as I can. Thanks to Pine Team for improving Pine Platform all the time!
How it works?
- On each candle it checks divergences between current and any of last 16 Pivot Points for the indicators.
- it search divergence on choisen indicators => RSI , MACD , MACD Histogram, Stochastic , CCI , Momentum, OBV, VWMACD, CMF and any External Indicator !
- it checks following divergences for 16 pivot points that is in last 100 bars for each Indicator.
--> Regular Positive Digergences
--> Regular Negative Digergences
--> Hidden Positive Digergences
--> Hidden Negative Digergences
- for positive divergences first it checks if closing price is higher than last closing price and indicator value is higher than perious value, then start searching divergence
- for negative divergences first it checks if closing price is lower than last closing price and indicator value is lower than perious value, then start searching divergence
Some Options:
Pivot Period: you set Pivot Period as you wish. you can see Pivot Points using "Show Pivot Points" option
Source for Pivot Points: you can use Close or High/Low as source
Divergence Type: you can choose Divergence type to be shown => "Regular", "Hidden", "Regular/Hidden"
Show Indicator Names: you have different options to show indicator names => "Full", "First Letter", "Don't Show"
Show Divergence Number: option to see number of indicators which has Divergence
Show Only Last Divergence : if you enable this option then it shows only last Positive and Negative Divergences
you can include any External Indicator to see if there is divergence
- enable "Check External Indicator"
- and then choose External indicator name in the list, "External Indicator"
- External indicator name is shown as Extrn
- related external indicator must be added before enabling this option
Coloring, line width and line style options for different type of divergences.
Following Alerts added:
- Positive Regular Divergence Detected
- Negative Regular Divergence Detected
- Positive Hidden Divergence Detected
- Negative Hidden Divergence Detected
Now lets see some examples:
Hidden Divergences:
Regular and Hidden Divergences together:
Showing first letters of indicators:
You can see only the number of indicators which has divergence:
You can see only divergence lines without indicators names and numbers:
option to used different label/line/text colors:
You have option to see only last divergences:
You can change Pivot Period, in following example Pivot Period = 15:
You can use Close or High/Low as Source for Divergence
You can include external indicators and get divergences on it:
Wish you all a happy new year!
Enjoy!

Divergence Histogram for Many IndicatorHello Traders,
This script analyses divergences for 11 predefined indicators and then draws column on the graph. Red columns for negatif divergence (means prices may go down or trend reversal), Lime columns for positive divergences (means prices may go up or trend reversal)
The script uses Pivot Points and on each bar it checks divergence between last Pivot Point and current High/Low and if it finds any divergence then immediately draws column. There is no Latency/Lag.
There are predefined 11 indicators in the script, which are RSI , MACD , MACD Histogram, Stochastic , CCI , Momentum, OBV, Diosc, VWMACD, CMF and MFI.
Smaller Pivot Point Period check smaller areas and if you use smaller numbers it would be more sensitive and may give alerts very often. So you should set it accordingly.
There is "Check Cut-Through in indicators" option, I recomment you to enable it. it checks that there is cut-through in indicators or not, if no cut-through then it's shown as valid divergence.
You should see following one as well if you haven't yet:
Enjoy!

Divergence for many indicator v3Hello Everyone. Almost one year later, with Pine version 4, I developed new version of the Divergence for many Indicator.
It analyses divergences for 10 predefined indicators and then draws line on the graph. Red for negatif divergence (means prices may go down or trend reversal), Lime for positive divergences (means prices may go up or trend reversal)
Divergences version 2 has latency because it waits higher time frame completion. in this new version the script uses Pivot Points and on every bar it checks divergence between last Pivot point and current bar and if it finds any then immediately draws line and removes old one. so there is no latency with this version.
There are predefined 10 indicators in the script, you have option to choose which indicators the script would analyse for divergence. (RSI , MACD , MACD Histogram, Stochastic , CCI , Momentum, OBV, Diosc, VWMACD and CMF)
In replay mode you can see how the script puts new divergence line and removes old one. you better see it for yourself by using replay mode.
Hope you Enjoy!

ANN MACD BTC v2.0 This script is the 2nd version of the BTC Deep Learning (ANN) system.
Created with the following indicators and tools:
RSI
MACD
MOM
Bollinger Bands
Guppy Exponential Moving Averages:
(3,5,8,10,12,15,30,35,40,45,50,60)
Note: I was inspired by the CM Guppy Ema script.
Thank you very much to dear wroclai for his great help.
He has been a big help in the deep learning series.
That's why the licenses in this series are for both of us.
I'm sharing these series and thats the first. Stay tuned and regards!
Note : Alerts added.

Divergences for many indicators v2.0A gift from me to all.
This script is developed to find Divergences for many indicators. it analyses divergences and then draws line on the graph. red for negatif, lime for positive divergences.
Currently script checks divergence for RSI, MACD, MACD Histogram, Stochastic, CCI, Momentum, OBV, Diosc, VWMACD and CMF indicators. You can use some or all of these indicators to check divergences as you wish by choosing them on the menu. Also you can add/remove many other indicators to the script to check if there is divergence.
The script first calculates tops/bottoms by using higher time frame zig zag and then finds divergences.
Higher Time Frames are
if currend period 1 min => HTF = 5 mins
if currend period 3 mins => HTF = 15 mins
if currend period 5 mins => HTF = 15 mins
if currend period 15 mins => HTF = 1 hour
if currend period 30 mins => HTF = 1 hour
if currend period 45 mins => HTF = 1 hour
if currend period 1 hour => HTF = 4 hours
if currend period 2 hours => HTF = 4 hours
if currend period 3 hours => HTF = 4 hours
if currend period 4 hours => HTF = 1 day
if currend period 1 day => HTF = 1 week
if currend period 1 week => HTF = 1 week
future plan : script finds regular divergences, soon I will add hidden divergences and also I plan to add alert ;)
