Ultimate Moving Average Package (17 MA's)Included is the:
VWAP
Current time frame 10 EMA
Current time frame 20 EMA
Current time frame 50 EMA
Current time frame 10 SMA
Current time frame 20 SMA
Current time frame 50 SMA
Daily 10 EMA
Daily 20 EMA
Daily 50 EMA
Daily 50 SMA
Daily 100 SMA
Daily 200 SMA
Weekly 100 SMA
Weekly 200 SMA
Monthly 100 SMA
Monthly 200 SMA
All Daily/Weekly/Monthly MA's can be seen on intraday charts. Current time frame MA's change depending on your time frame. Obviously you dont need all 17 on your chart but you can pick the ones you like and disable the rest.
"科创50成分股"に関するスクリプトを検索

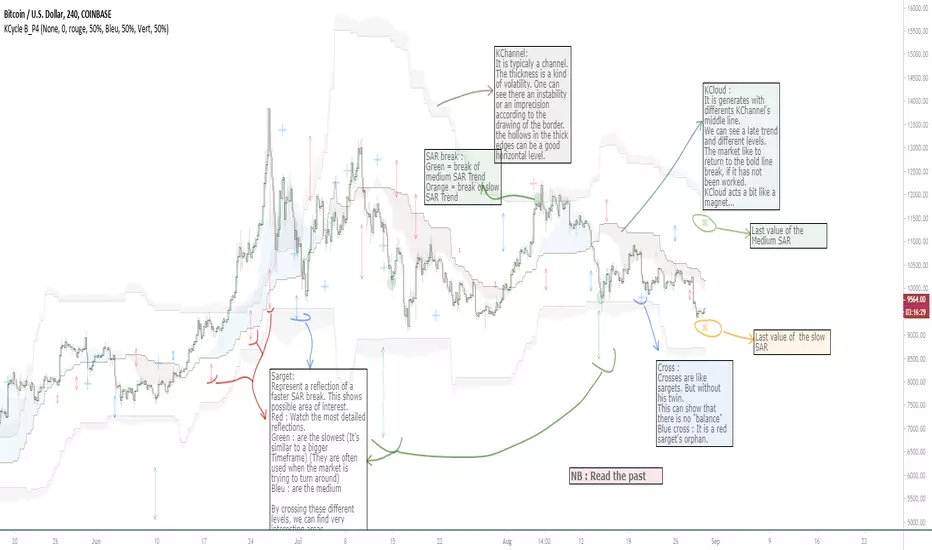
OVL_Kikoocycle Beta_Pine3This script use :
- A custom Chande Kroll Stop for generate the channel
- Some custom Parabolic S.A.R for generate cycles
This script can be separated into 3 categories:
- Channel Kroll generator : one layer for the actual interval and a layer for a Large Timeframe .(with ratio)
- "Range" generator : one layer for actual Interval and a layer for a Large Timeframe.(with automique ratio)
-Targets generator : one layer for actual interval with different trend.
"Channel Kroll" :
- I "hijack" the Chande Kroll Stop formula with custom parameters for generate this channel. Overall, it works like other types of channels like BB, etc... A midline and two borders. The thickness of the borders are relatively important here. A thick border shows some resistance of the area. And so the probability of seeing the market return to its first contact is stronger. While a very thin and vertical border would rather play the role of a breach, a bit like the idea of gaps. Often the market seems to want to go after several cycles.
You can activate its Large TimeFrame version, its midline is strong and fine borders helps to judge the risk.
SARget + "SAR Limited" :
- (S.A.R + targets) The philosophy of this function is simple... When a small cycle is broken, it creates a mark on a higher cycle. So on until the SAR called "SAR Limited". For simplicity, imagine a fractal image but inverted ... Break the small figure, it will mark the larger figure at this time but to get there you still have to make the way to the small figure.
Targets are : cross ("+") for fast targets(hidden by default because, theire work only on lower interval), squares (for medium trend), Xcross(for large trend) and red cross(they try to find a large contexte). When a target proc, it is for later (market need some cycles for going to, but it is relative to your interval). This gives you speculative goals.
Why 2 targets for a same type and a triangle with a 90deg angle : This give a potential area for management.The triangle help to visualize the SAR and to juge the market reaction. You need to adapte your trade with that...
Targets may be slightly too far because I am a bad coder... Currently the targets appear at the moment of rupture but it would be necessary to wait for the end of the breaking movement. Which can bring a positional error if the break is violent.
RnG and LTF RnG :
- Attempt to generate a Fibo range for each cycle and see interressing areas to enter or exit. This is played with the same philosophy as the Fibo extensions and retracement.
When a new RnG is generated, do not rush. It appears showing 50/50 for both sides. When a new RnG is generated, do not rush. It appears showing 50/50 for both sides. As long as the market is out of the middle zone (the 3 lines) keep in mind the past RnG.
When the market is out of range, you can use the FibRetracement tool for have extensions. One point at each end, as on the presentation graph. (Values 1.14, 1.272, 1.414, 1.618, 1.786, 2, 2.4 and 4 work well.) If too extrem you can active the LTF version.
Never fomo a break, market like to pull a level... Observe and be patient.
It's easier to use than to explain xD
NB : Do not use the LTF as context. For this, it is better to look at a higher interval.
I invite you to look in the style tab of the script and deselect the plots named UNCHECKEME, this will ease your browser.
Amazing Crossover System - 100+ pips per day!I got the main concept for this system on another site. While I have made one important change, I must stress that the heart of this system was created by someone else! We must give credit where credit is due!
Y'all know baby pips. @ForexPhantom published about this system and did both back and forward test around 10 years ago.
I found it on the sit and now I put it to code to see how it performs. I assume 10 points spread for every trade. I use Renesource or AxiTrader to get the low spreads.
There are 2 mods, the single trades and constant trading on the direction.
Main concept
Indicators
5 EMA -- YELLOW
10 EMA -- RED
RSI (10 - Apply to Median Price: HL/2) -- One level at 50.
TIME FRAME
1 Hour Only (very important!)
PAIRS
Virtually any pair seems to work as this is strictly technical analysis.
I recommend sticking to the main currencies and avoiding cross currencies (just his preference).
WHEN TO ENTER A TRADE
Enter LONG when the Yellow EMA crosses the Red EMA from underneath.
RSI must be approaching 50 from the BOTTOM and cross 50 to warrant entry.
Enter SHORT when the Yellow EMA crosses the Red EMA from the top.
RSI must be approaching 50 from the TOP and cross 50 to warrant entry.
I've attached a picture which demonstrates all these conditions.
That's it!
f.bpcdn.co

MFIww MFI/RSI_v2[wozdux]A new version of the indicator Mfi_v2. Added new control parameters.
tt - the averaging period of the volume.
Len - the period for calculating the MPI.
nn-averaging period MFI (blue line). level-critical levels from below and above (black horizontal lines).
Level 0 or 50 - switch between different histogram views with the middle at either level 50 or level 0.
key level-key to remove black critical levels.
key ema (MFI, nn) - key to remove mfi averaging (blue line).
key color-key to remove histogram coloring.
key colomns a-line - key switching modes represent the mfi histrogram or line.
---------------------------
Новая версия индикатора MFIww_v2. Добавлены новые управляющие параметры.
tt- период усреднения объема.
Len - период вычисления MFI.
nn- период усреднения MFI (голубая линия).
level- критические уровни снизу и сверху (черные горизонтальные линии).
Level 0 or 50 - переключение между разными представлениями гистрограммы с серединой либо на уровне 50 , либо на уровне 0.
key level- ключ убрать черные критические уровни.
key ema(mfi,nn) - ключ убрать усреднение mfi (голубая линия).
key color- ключ убрать расцветку гистрограммы.
key colomns-line - ключ переключения режимов представления mfi гистрограммой или линией.

GoTiT|Simple Auto Fib v1.0Simple Auto Fib!
Notes:
1. Always set the trend manually! Don't rely on the auto trend detection.
2. The first parameter Length sets the number of candles back (left) to search for highs and lows from the current candle.
3. The High Offset parameter sets the number of candles back (left) to ignore/skip before searching for highs.
4. The Low Offset parameter sets the number of candles back (left) to ignore/skip before searching for lows.
5. The offset parameters change the behavior of the Length parameter.
Example 1:
Length = 100
High Offset = 0
Low Offset = 0
This is the default behavior, and the search for highs and lows occurs on the last 100 candles.
Example 2:
Length = 50
High Offset = 20 (Ignore the last 20 candles, and search for highs starting at candle 21 to 71 (or 50 candles back)
Low Offset = 15 (Ignore the last 15 candles, and search for lows starting at candle 16 to 66 (or 50 candles back)
In example 2, search starts on candle 21 for highs, and candle 16 for lows and extends 50 candles further back from there.
6. The Trend Detection parameter sets the number of candles back (left) to use in the trend calculations. Larger values give better "marco trend" detection. Smaller values give better "micro trend" detection. See note #1.
7. The white fib line is fib0. Assuming you correctly set the trend manually (or the trend is auto detected correctly), in a downtrend fib0 should be bellow the red fib line, and in an uptrend fib0 should be above the red fib line.

MACD + Stochastic + RSI (Long + Short)My strategy uses a combination of three indicators MACD Stochastic RSI .
The Idea is to GO LONG when ( MACD > Signal and RSI > 50 and Stochastic > 50) occures at the same time
and GO SHORT when ( MACD < Signal and RSI < 50 and Stochastic < 50)
This strategy works well on futures and stocks especially during market breaking up after consolidation
The best results are on Daily charts , so its NOT a scalping strategy. But it can work also on 1H charts.
The strategy does not have any stops and profit targets, so we can take all the market can give us at the moment.
The exit point only when MACD goes under/over Signal line
Its Preformance is quite stable.
So, use it, trade it.
If it will help you to imprive your trading results, please donate me
BTC: 12kd1F8buWisUBdq27BBwRkUvzW7Ey3og5

Trend Lines and MoreMulti-Indicator consisting of several useful indicators in a single package.
TREND LINES
-By default the 20 SMA and 50 SMA are shown.
-Use "MOVING AVERAGE TYPE" to select SMA, EMA, Double-EMA, Triple-EMA, or Hull.
-Use "50 MA TREND COLOR" to have the 50 turn green/red for uptrend/downtrend.
-Use "DAILY SOURCE ONLY" to always show daily averages regardless of timeframe.
-Use "SHOW LONG MA" to also include 100, 150, and 200 moving averages.
-Use "SHOW MARKERS" to show a small colored marker identifying which line is which.
OTHER INDICATORS
-You can show Bollinger Bands and Parabolic SAR.
-You can highlight key reversal times (9:50-10:10 and 14:40-15:00).
-You can show price offset markers, where was the price "n" periods ago.
That last one is useful to show the level of prices which are about to "fall off" the moving average
and be replaced with current price. So for example, if current price is significantly below the
200-days-ago price, you can gauge the difficulty for the 200 MA to start climbing again.

Multi SMA EMA WMA HMA BB (4x3 MAs Bollinger Bands) Pro MTF - RRBMulti SMA EMA WMA HMA 4x3 Moving Averages with Bollinger Bands Pro MTF by RagingRocketBull 2018
Version 1.0
This indicator shows multiple MAs of any type SMA EMA WMA HMA etc with BB and MTF support, can show MAs as dynamically moving levels.
There are 4 MA groups + 1 BB group. You can assign any type/timeframe combo to a group, for example:
- EMAs 50,100,200 x H1, H4, D1, W1 (4 TFs x 3 MAs x 1 type)
- EMAs 8,13,21,55,100,200 x M15, H1 (2 TFs x 6 MAs x 1 type)
- D1 EMAs and SMAs 12,26,50,100,200,400 (1 TF x 6 MAs x 2 types)
- H1 WMAs 7,77,231; H4 HMAs 50,100,200; D1 EMAs 144,169,233; W1 SMAs 50,100,200 (4 TFs x 3 MAs x 4 types)
- +1 extra MA type/timeframe for BB
compile time: 25-30 sec
full redraw time after parameter change in UI: 3 sec
There are several versions: Simple, MTF, Pro MTF, Advanced MTF and Ultimate MTF. This is the Pro MTF version. The Differences are listed below. All versions have BB
- Simple: you have 2 groups of MAs that can be assigned any type (5+5)
- MTF: +2 custom Timeframes for each group (2x5 MTF)
- Pro MTF: +4 custom Timeframes for each group (4x3 MTF), MA levels and show max bars back options
- Advanced MTF: +2 extra MAs/group (4x5 MTF), custom Ticker/Symbol, backreferences for type, TF and MA lengths in UI
- Ultimate MTF: +individual settings for each MA, custom Ticker/Symbols
Features:
- 4x3 = 12 MAs of any type including Hull Moving Average (HMA)
- 4x MTF groups with step line smoothing
- BB +1 extra TF/type for BB MAs
- 12 MA levels with adjustable group offsets, indents and shift
- show max bars back
- you can show/hide both groups of MAs/levels and individual MAs
Notes:
1. based on 3EmaBB, uses plot*, barssince and security functions
2. you can't set certain constants from input due to Pinescript limitations - change the code as needed, recompile and use as a private version
3. Levels = trackprice implementation
4. Show Max Bars Back = show_last implementation
5. uses timeframe textbox instead of input resolution to allow for 120 240 and other custom TFs. Also supports TFs in hours: 2H or H2
6. swma has a fixed length = 4, alma and linreg have additional offset and smoothing params
7. Smoothing is applied by default for visual aesthetics on MTF. To use exact ma mtf values (lines with stair stepping) - disable it
MTF Notes:
- uses simple timeframe textbox instead of input resolution dropdown to allow for 120, 240 and other custom TFs, also supports timeframes in H: 2H, H2
- Groups that are not assigned a Custom TF will use Current Timeframe (0).
- MTF will work for any MA type assigned to the group
- MTF works both ways: you can display a higher TF MA/BB on a lower TF or a lower TF MA/BB on a higher TF.
- MTF MA values are normally aligned at the boundary of their native timeframe. This produces stair stepping when a higher TF MA is viewed on a lower TF.
Therefore X Y Point Density/Smoothing is applied by default on MA MTF for visual aesthetics. Set both to 0 to disable and see exact ma mtf values (lines with stair stepping and original mtf alignment).
- Smoothing is disabled for BB MTF bands because fill doesn't work with smoothed MAs after duplicate values are replaced with na.
- MTF MA Value fluctuation is possible on the current bar due to default security lookahead
Smoothing:
- X,Y == 0 - X,Y smoothing disabled (stair stepping on high TFs)
- X == 0, Y > 0 - X,Y smoothing applied to all TFs
- Y == 0, X > 0 - X smoothing applied to all TFs < deltaX_max_tf, Y smoothing disabled
- X > 0, Y > 0 - Y smoothing applied to all TFs, then X smoothing applied to all TFs < deltaX_max_tf
X Smoothing with Y == 0 - shows only every deltaX-th point starting from the first bar.
X Smoothing with Y > 0 - shows only every deltaX-th point starting from the last shown Y point, essentially filling huge gaps remaining after Y Smoothing with points and preserving the curve's general shape
X Smoothing on high TFs with already scarce points produces weird curve shapes, it works best only on high density lower TFs
Y Smoothing reduces points on all TFs, removes adjacent points with prices within deltaY, while preserving the smaller curve details.
A combination of X,Y produces the most accurate smoothing. Higher delta value - larger range, more points removed.
Show Max Bars Back:
- can't set plot show_last from input -> implemented using a timenow based range check
- you can't delete/modify history once plotted, so essentially it just sets a start point for plotting (from num_bars bars back) that works only in realtime mode (not in replay)
Levels:
You can plot current MA value using plot trackprice=true or by checking Show Price Line in Style. Problem is:
- you can only change color (not the dashed line style, width), have both ma + price line (not just the line), and it's full screen wide
- you can't set plot trackprice from input => implemented using plotshape/plotchar with fixed text labels serving as levels
- there's no other way of creating a dynamic level: hline, plot, offset - nothing else works.
- you can't plot a text var - all text strings must be constants, so you can't change the style, width and text labels without recompiling.
- from input you can only adjust offset, indent and shift for each level group, and change color
- the dot below each level line is the exact MA value. If you want just the line swap plotshape with plotchar, recompile and save as your private version, adjust Y shift.
To speed up redraw times: reduce last_bars to ~2000, recompile and use as your own private version
Pinescript is a rudimentary language (should be called Painscript instead) that can basically only plot data. You can't do much else. Please see the code for tips and hints.
Certain things just can't be done or require shady workarounds and weeks of testing trying to resolve weird node.js compiler errors.
Feel free to learn from/reuse/change the code as needed and use as your own private version. See comments in code. Good Luck!

Simple_longshort_signalsLong Entry
Criteria:
1) Green candle close above 50MA
2) Green candle close above 20MA
3) MA of RSI(14) is cross upward 50
Result: displays green up arrow
Long Exit
Criteria:
1) Three red candles in a row
2) Any candle close bellow 20MA
3) MA of RSI(14) cross downward 50
Result: displays green diamond
Short Entry
1) Red candle close bellow 50MA
2) Red candle close bellow 20MA
3) MA of RSI(14) is cross downward 50
Result: displays red down arrow
Short Exit
Criteria
1) Three green candles in a row
2) Any candle close above 20MA
3) MA of RSI(14) is cross upward 50
Result: displays red diamond

Noro's Double RSI Strategy 1.0Strategy uses only 2 RSI indicators. Slow and fast.
If slow RSI > 50 and fast RSI < 50 - to open a long-position
If slow RSI < 50 and fast RSI > 50 - to open a short-position
If the long-position is open and a candle green - to close a long-position
if the short-position is open and a candle red - to close a short-position

GoldenCross by PuffyThis is a simple trading strategy that seeks the Golden Cross and Death Cross on the 4HR chart. The fast moving indicator in this strategy is the EMA 50 and the slow moving indicator is the EMA 200. When the EMA 50 crosses over the EMA 200 the strategy indicates a buy. When the EMA 50 crosses below the EMA 200 the strategy indicates a sell. This strategy averages trades in the 40 - 50 day range and as such should not be used with heavy leverage.

Exponential Moving Average (Set of 3) [Krypt] + 13/34 EMAsI took Krypt's script and essentially added on to it.
the 20/50/100/200 EMAs should be used together as support and resistance as normal.
Wait for price to break 200 EMA
Wait for 50 EMA to cross 200 EMA
Wait for pullback to 50 EMA to open position
20 and 100 EMAs are for extra information about moving support and resistance
and 13/34 EMAs should be used in conjunction
When 13 EMA crosses 34 EMA, open position
When price gets far from 13/34, close position (because price will attempt to revert back to mean)
This is better for scalping and swing trades than the 20/50/100/200 setup.
Twitter: @AzorAhai06

MTF EMAExponential Moving Average indicator that can be configured to display different timeframe EMA's.
Timeframe is set in minutes. Max timeframe currently is the daily (1440 minutes). Any value higher than 1440 will result in no plot.
Examples:
Daily 50 EMA plotted on 4H chart
4H 50 EMA and Daily 50 EMA plotted on 1H chart
Can also work in reverse if needed.
Example, Daily 50 EMA plotted on Weekly Chart

Price vs VolImproved version of OBV/price (this one actually works)
Both lines show where price is going relative to volume metrics (one line uses OBV, the other uses accumulation/distribution).
Green and above 50 means price is rising faster then buying volume
Red and below 50 means price is falling faster then selling volume
you can add smoothing in the controls and color will go according to raw (even if smoothing goes above/below 50)
under the hood: changes price, OBV and AD to RSI for comparability, calculates the difference between price and the others, then an RSI on the result to create an <50< style indicator.
this script replaces the previouse from:

Expert Trader: Pro Scalp DashboardDescription
Overview This indicator is a comprehensive trading system designed for Scalpers and Day Traders who operate on lower timeframes (1M, 5M, 15M) but need to respect the higher timeframe (HTF) context. It combines on-chart technical analysis tools with a sophisticated Multi-Timeframe (MTF) Information Dashboard to identify high-probability setups and filter out risky entries.
Key Features
1. The "Pro Scalp" Dashboard Located on the right side of your screen, this panel provides real-time situational awareness without the need to switch charts:
MTF Momentum (WaveTrend): Monitors the 1H and 4H WaveTrend cycles.
Strategy: Look for trade entries on your current timeframe that align with the 1H and 4H Trend Bias (e.g., Only Long when HTF is Green).
Risk Filtration (MTF RSI): Automatically flags dangerous entry zones.
Alerts: Displays "NO LONG (Risk)" or "NO SHORT (Risk)" if the 1H or 4H RSI indicates overbought or oversold conditions, protecting you from buying tops or selling bottoms.
Volume "BANG!" Detection: Compares current volume against the 20-period average.
Trigger: Flashes "BANG! 💥" when volume spikes (default: 2.5x average), signaling institutional activity or a breakout.
ADX Strength: indicates whether the market is trending or ranging.
2. On-Chart Technical Structure
Dual DEMA (50 & 200): Double Exponential Moving Averages provide a faster, more responsive trend baseline than standard EMAs, reducing lag for scalping entries.
Bollinger Bands: Visualizes volatility expansion and mean reversion levels.
How to Use
Bullish Setup: Price is above DEMA 50/200 + Dashboard shows 1H/4H WaveTrend "LONG" + Volume shows "BANG!".
Bearish Setup: Price is below DEMA 50/200 + Dashboard shows 1H/4H WaveTrend "SHORT".
Caution: Avoid entries when the Dashboard RSI filters show "Risk" or ADX is below 20 (Choppy Market).
Settings
DEMA Lengths: Fully customizable.
Volume Factor: Adjust the sensitivity of the volume spike detection.
Dashboard Position: Fixed to the middle-right for better visibility.

ALT Risk Metric StrategyHere's a professional write-up for your ALT Risk Strategy script:
ALT/BTC Risk Strategy - Multi-Crypto DCA with Bitcoin Correlation Analysis
Overview
This strategy uses Bitcoin correlation as a risk indicator to time entries and exits for altcoins. By analyzing how your chosen altcoin performs relative to Bitcoin, the strategy identifies optimal accumulation periods (when alt/BTC is oversold) and profit-taking opportunities (when alt/BTC is overbought). Perfect for traders who want to outperform Bitcoin by strategically timing altcoin positions.
Key Innovation: Why Alt/BTC Matters
Most traders focus solely on USD price, but Alt/BTC ratios reveal true altcoin strength:
When Alt/BTC is low → Altcoin is undervalued relative to Bitcoin (buy opportunity)
When Alt/BTC is high → Altcoin has outperformed Bitcoin (take profits)
This approach captures the rotation between BTC and alts that drives crypto cycles
Key Features
📊 Advanced Technical Analysis
RSI (60% weight): Primary momentum indicator on weekly timeframe
Long-term MA Deviation (35% weight): Measures distance from 150-period baseline
MACD (5% weight): Minor confirmation signal
EMA Smoothing: Filters noise while maintaining responsiveness
All calculations performed on Alt/BTC pairs for superior market timing
💰 3-Tier DCA System
Level 1 (Risk ≤ 70): Conservative entry, base allocation
Level 2 (Risk ≤ 50): Increased allocation, strong opportunity
Level 3 (Risk ≤ 30): Maximum allocation, extreme undervaluation
Continuous buying: Executes every bar while below threshold for true DCA behavior
Cumulative sizing: L3 triggers = L1 + L2 + L3 amounts combined
📈 Smart Profit Management
Sequential selling: Must complete L1 before L2, L2 before L3
Percentage-based exits: Sell portions of position, not fixed amounts
Auto-reset on re-entry: New buy signals reset sell progression
Prevents premature full exits during volatile conditions
🤖 3Commas Automation
Pre-configured JSON webhooks for Custom Signal Bots
Multi-exchange support: Binance, Coinbase, Kraken, Bitfinex, Bybit
Flexible quote currency: USD, USDT, or BUSD
Dynamic order sizing: Automatically adjusts to your tier thresholds
Full webhook documentation compliance
🎨 Multi-Asset Support
Pre-configured for popular altcoins:
ETH (Ethereum)
SOL (Solana)
ADA (Cardano)
LINK (Chainlink)
UNI (Uniswap)
XRP (Ripple)
DOGE
RENDER
Custom option for any other crypto
How It Works
Risk Metric Calculation (0-100 scale):
Fetches weekly Alt/BTC price data for stability
Calculates RSI, MACD, and deviation from 150-period MA
Normalizes MACD to 0-100 range using 500-bar lookback
Combines weighted components: (MACD × 0.05) + (RSI × 0.60) + (Deviation × 0.35)
Applies 5-period EMA smoothing for cleaner signals
Color-Coded Risk Zones:
Green (0-30): Extreme buying opportunity - Alt heavily oversold vs BTC
Lime/Yellow (30-70): Accumulation range - favorable risk/reward
Orange (70-85): Caution zone - consider taking initial profits
Red/Maroon (85-100+): Euphoria zone - aggressive profit-taking
Entry Logic:
Buys execute every candle when risk is below threshold
As risk decreases, position sizing automatically scales up
Example: If risk drops from 60→25, you'll be buying at L1 rate until it hits 50, then L2 rate, then L3 rate
Exit Logic:
Sells only trigger when in profit AND risk exceeds thresholds
Sequential execution ensures partial profit-taking
If new buy signal occurs before all sells complete, sell levels reset to L1
Configuration Guide
Choosing Your Altcoin:
Select crypto from dropdown (or use CUSTOM for unlisted coins)
Pick your exchange
Choose quote currency (USD, USDT, BUSD)
Risk Metric Tuning:
Long Term MA (default 150): Higher = more extreme signals, Lower = more frequent
RSI Length (default 10): Lower = more volatile, Higher = smoother
Smoothing (default 5): Increase for less noise, decrease for faster reaction
Buy Settings (Aggressive DCA Example):
L1 Threshold: 70 | Amount: $5
L2 Threshold: 50 | Amount: $6
L3 Threshold: 30 | Amount: $7
Total L3 buy = $18 per candle when deeply oversold
Sell Settings (Balanced Exit Example):
L1: 70 threshold, 25% position
L2: 85 threshold, 35% position
L3: 100 threshold, 40% position (final exit)
3Commas Setup
Bot Configuration:
Create Custom Signal Bot in 3Commas
Set trading pair to your altcoin/USD (e.g., ETH/USD, SOL/USDT)
Order size: Select "Send in webhook, quote" to use strategy's dollar amounts
Copy Bot UUID and Secret Token
Script Configuration:
Paste credentials into 3Commas section inputs
Check "Enable 3Commas Alerts"
Save and apply to chart
TradingView Alert:
Create Alert → Condition: "alert() function calls only"
Webhook URL: api.3commas.io
Enable "Webhook URL" checkbox
Expiration: Open-ended
Strategy Advantages
✅ Outperform Bitcoin: Designed specifically to beat BTC by timing alt rotations
✅ Capture Alt Seasons: Automatically accumulates when alts lag, sells when they pump
✅ Risk-Adjusted Sizing: Buys more when cheaper (better risk/reward)
✅ Emotional Discipline: Systematic approach removes fear and FOMO
✅ Multi-Asset: Run same strategy across multiple altcoins simultaneously
✅ Proven Indicators: Combines RSI, MACD, and MA deviation - battle-tested tools
Backtesting Insights
Optimal Timeframes:
Daily chart: Best for backtesting and signal generation
Weekly data is fetched internally regardless of display timeframe
Historical Performance Characteristics:
Accumulates heavily during bear markets and BTC dominance periods
Captures explosive altcoin rallies when BTC stagnates
Sequential selling preserves capital during extended downtrends
Works best on established altcoins with multi-year history
Risk Considerations:
Requires capital reserves for extended accumulation periods
Some altcoins may never recover if fundamentals deteriorate
Past correlation patterns may not predict future performance
Always size positions according to personal risk tolerance
Visual Interface
Indicator Panel Displays:
Dynamic color line: Green→Lime→Yellow→Orange→Red as risk increases
Horizontal threshold lines: Dashed lines mark your buy/sell levels
Entry/Exit labels: Green labels for buys, Orange/Red/Maroon for sells
Real-time risk value: Numerical display on price scale
Customization:
All threshold lines are adjustable via inputs
Color scheme clearly differentiates buy zones (green spectrum) from sell zones (red spectrum)
Line weights emphasize most extreme thresholds (L3 buy and L3 sell)
Strategy Philosophy
This strategy is built on the principle that altcoins move in cycles relative to Bitcoin. During Bitcoin rallies, alts often bleed against BTC (high sell, accumulate). When Bitcoin consolidates, alts pump (take profits). By measuring risk on the Alt/BTC chart instead of USD price, we time these rotations with precision.
The 3-tier system ensures you're always averaging in at better prices and scaling out at better prices, maximizing your Bitcoin-denominated returns.
Advanced Tips
Multi-Bot Strategy:
Run this on 5-10 different altcoins simultaneously to:
Diversify correlation risk
Capture whichever alt is pumping
Smooth equity curve through rotation
Pairing with BTC Strategy:
Use alongside the BTC DCA Risk Strategy for complete portfolio coverage:
BTC strategy for core holdings
ALT strategies for alpha generation
Rebalance between them based on BTC dominance
Threshold Calibration:
Check 2-3 years of historical data for your chosen alt
Note where risk metric sat during major bottoms (set buy thresholds)
Note where it peaked during euphoria (set sell thresholds)
Adjust for your risk tolerance and holding period
Credits
Strategy Development & 3Commas Integration: Claude AI (Anthropic)
Technical Analysis Framework: RSI, MACD, Moving Average theory
Implementation: pommesUNDwurst
Disclaimer
This strategy is for educational purposes only. Cryptocurrency trading involves substantial risk of loss. Altcoins are especially volatile and many fail completely. The strategy assumes liquid markets and reliable Alt/BTC price data. Always do your own research, understand the fundamentals of any asset you trade, and never risk more than you can afford to lose. Past performance does not guarantee future results. The authors are not financial advisors and assume no liability for trading decisions.
Additional Warning: Using leverage or trading illiquid altcoins amplifies risk significantly. This strategy is designed for spot trading of established cryptocurrencies with deep liquidity.
Tags: Altcoin, Alt/BTC, DCA, Risk Metric, Dollar Cost Averaging, 3Commas, ETH, SOL, Crypto Rotation, Bitcoin Correlation, Automated Trading, Alt Season
Feel free to modify any sections to better match your style or add specific backtesting results you've observed! 🚀Claude is AI and can make mistakes. Please double-check responses. Sonnet 4.5

Fractal MTF MA System Overview Unlock the fractal nature of the market with a single, clean indicator. This tool allows you to visualize the exact same Moving Average length (default: 50) across 5 different timeframes simultaneously. By comparing "apples to apples" across time dimensions, you get a clear, immediate view of the overall market trend and momentum health.
No more switching charts or manually adding 5 different indicators. This script does it all with a single global setting.
Key Features
🧩 Fractal Logic: Applies one consistent calculation (e.g., 50 Period) to 15m, 30m, 1H, 2H, and 4H timeframes.
🎛️ Global Control: Change the Length or MA Type once, and it instantly updates all 5 lines. No need to adjust each line individually.
🚀 3 Calculation Modes: Switch between DEMA (Double Exponential - Default/Fast), EMA (Standard), or SMA (Smooth) to fit your trading style.
🎨 Visual Clarity: Choose between Step mode (for precise MTF levels) or Line mode (for a smoother, cleaner look).
How to Use This Indicator
1. Trend Following (The Fan) When the market is trending strongly, the lines will stack in perfect order:
Bullish: Price > 15m > 30m > 1H > 2H > 4H.
Bearish: Price < 15m < 30m < 1H < 2H < 4H.
Strategy: Ride the trend as long as the "Fan" is open and orderly.
2. Mean Reversion (The Snap-Back) When the price moves too far from the anchor line (the 4H line) and the gaps between the lines become extreme, the market is "overextended" (like a stretched rubber band).
Strategy: Watch for price to stall and cross back over the fastest line (15m) as an early sign of a correction towards the slower averages.
3. Dynamic Support & Resistance During a trend, price often pulls back to test the 1H or 2H lines before continuing. These lines act as dynamic support zones.
Settings
Global Length: Sets the lookback period for ALL lines (Default: 50).
MA Type: Select DEMA, EMA, or SMA.
Line Style: Toggle between Step (precise) or Line (smooth).
Individual Toggles: You can hide specific timeframes via the settings menu if you want a cleaner chart.
Enjoy the clean charts! Feedback and likes are appreciated. 🚀

On Balance Volume [BrightSideTrading]
# On Balance Volume - Complete User Guide
## Overview
This enhanced OBV indicator provides clean, actionable volume analysis with intelligent signal filtering. It combines On-Balance Volume (OBV) with a smoothed signal line to identify shifts in buying and selling pressure without chart clutter.
**Key Features:**
- Real-time OBV and signal line visualization
- Smart crossover detection with confirmation filtering
- Z-Score momentum analysis
- Customizable signal alerts with V-shaped markers
- Window-normalized option for detrended analysis
---
## What is On-Balance Volume (OBV)?
OBV is a volume-based momentum indicator that accumulates volume on up days and subtracts volume on down days. It answers a fundamental question: **Is volume flowing in (buying) or out (selling)?**
**Formula:**
- If Close > Previous Close: OBV = Previous OBV + Volume
- If Close < Previous Close: OBV = Previous OBV - Volume
- If Close = Previous Close: OBV = Previous OBV (unchanged)
**What it tells you:**
- **Rising OBV** = Accumulation (smart money buying)
- **Falling OBV** = Distribution (smart money selling)
- **OBV above zero line** = Net positive buying pressure
- **OBV below zero line** = Net negative selling pressure
---
## Interface & Settings
### **MAIN VISUALIZATION**
**OBV Line (Green/Red Ribbon)**
- Green when OBV is above the signal line (bullish trend)
- Red when OBV is below the signal line (bearish trend)
- Toggles between window-normalized (detrended) and raw values
**Signal Line (Orange)**
- Smoothed average of OBV
- Crossovers with OBV generate buy/sell signals
- Default: 21-period SMA
**V-Shaped Markers**
- Green upward V = Bullish crossover (buy signal)
- Red downward V = Bearish crossover (sell signal)
- Appears at the OBV value when signal is triggered
**Zero Line (Yellow)**
- Center equilibrium point for volume balance
- Acts as support/resistance for OBV
- Separates buying pressure (above) from selling pressure (below)
---
### **SOURCE GROUP**
**Source**
- **Default:** Close
- **Options:** Open, High, Low, or any custom value
- Controls which price value triggers OBV direction changes
- Most traders use Close for standard OBV calculation
---
### **SIGNAL SMOOTHING GROUP**
**Show Signal?**
- **Default:** ON
- Toggle visibility of the signal line
- Disable if you prefer to see raw OBV only
**Smoothing Type**
- **SMA (Simple Moving Average)** - Default, standard smoothing
- **EMA (Exponential Moving Average)** - Faster response, weights recent bars more heavily
- **Choose SMA** for consistent, traditional OBV signals
- **Choose EMA** for faster trend identification (more whipsaws possible)
**Smoothing Length**
- **Default:** 21 bars
- **Range:** 1-200 bars
- **Lower values** (5-14): Faster signals, more noise
- **Higher values** (30-50): Slower signals, fewer false alarms
- **Recommendation:** Use 21-25 for most timeframes
---
### **SIGNAL FILTERING GROUP**
This is your primary control for signal quality and frequency.
**Show Signal Markers?**
- **Default:** ON
- Toggle the V-shaped buy/sell markers on/off
- Disable if markers distract from your analysis
**Signal Filter Type**
- **None** - Shows every single crossover (noisy, best for skilled traders)
- **Confirmation Bars** - Waits N bars before confirming signal (recommended)
- **Strength-Based** - Only signals during strong momentum (filters weakest moves)
#### **CONFIRMATION BARS MODE** (Recommended)
Best for reducing false signals while staying responsive to real moves.
**Confirmation Bars**
- **Default:** 2 bars
- **Range:** 1-10 bars
- Waits for the signal to hold for N consecutive bars after crossover
- **Setting 1:** Every crossover (same as "None")
- **Setting 2:** Wait 1 bar confirmation (good balance)
- **Setting 3:** Wait 2 bars confirmation (filters 50% of noise)
- **Setting 4+:** Very selective, misses quick reversals
**How it works:**
1. OBV crosses signal line → Confirmation counter starts
2. If OBV stays on correct side for 2 bars → V-marker appears
3. If OBV crosses back → Counter resets, no signal
#### **STRENGTH-BASED MODE**
Only signals when momentum is statistically significant.
**Min Z-Score Strength**
- **Default:** 0.3
- **Range:** 0.0-3.0
- Requires OBV deviation from its mean to reach this threshold
- **Setting 0.1-0.3:** More signals, lower quality
- **Setting 0.5-0.8:** Moderate signals, good quality
- **Setting 1.0+:** Only the strongest momentum shifts
**How it works:**
- Calculates how far OBV is from its 50-bar average (Z-score)
- Only shows signals when this distance is meaningful
- Automatically avoids weak, choppy market conditions
---
### **VISUALS & COLORS GROUP**
**Highlight Crossovers?**
- **Default:** ON
- Master toggle for all signal markers
- Turn OFF to see only the OBV/signal lines
**Apply Ribbon Filling?**
- **Default:** ON
- Colors the space between OBV and signal line
- Green fill = OBV above signal (bullish)
- Red fill = OBV below signal (bearish)
- Provides clear visual trend confirmation
- Turn OFF for minimal chart clutter
---
### **STATS & ZONES GROUP**
**Use Window-Normalized OBV (visual only)?**
- **Default:** ON
- Removes long-term trend from OBV for clearer short-term signals
- Detrends the indicator to highlight recent momentum changes
- **ON:** Better for swing trading and identifying reversals
- **OFF:** Better for trend-following strategies
- Note: Z-Score always uses raw OBV for statistical accuracy
**OBV Normalize Window**
- **Default:** 200 bars
- Lookback period for detrending calculation
- Larger values = more aggressive detrending
- Adjust if you want OBV to oscillate more/less around zero
**Show Z-Score (OBV)?**
- **Default:** ON
- Displays statistical momentum indicator below main chart
- Ranges from -3 to +3 (most data within -2 to +2)
- High Z-Score = Strong buying momentum
- Low Z-Score = Strong selling momentum
**Z-Score Lookback**
- **Default:** 50 bars
- Period for calculating Z-Score mean and standard deviation
- Larger = smoother Z-Score, slower response
- Smaller = noisier Z-Score, faster response
**Show ROC (OBV Momentum)?**
- **Default:** OFF
- Rate of Change indicator for OBV velocity
- Useful for identifying momentum turning points
- Enable if you want to see speed of volume changes
**ROC Lookback**
- **Default:** 14 bars
- Period for ROC calculation
**Show Z-Score StdDev Zones?**
- **Default:** ON
- Shaded regions around zero line showing statistical boundaries
- Inner Zone (±1 Z) = Normal variation
- Outer Zone (±2 Z) = Extreme moves, potential reversals
- Helps identify overbought/oversold volume conditions
**Inner Zone (±Z)**
- **Default:** 1.0
- First boundary for standard deviation zones
- Most normal trading occurs within ±1
**Outer Zone (±Z)**
- **Default:** 2.0
- Second boundary for extreme conditions
- Crossing these zones indicates significant momentum shift
---
## Trading Strategy Examples
### **Strategy 1: Signal Line Crossovers (Beginner)**
**Setup:**
- Signal Filter Type: **Confirmation Bars**
- Confirmation Bars: **2-3**
- Show Signal Markers: **ON**
**Rules:**
1. **BUY signal** (green V): When OBV crosses above signal line and holds for 2-3 bars
- Confirms buying pressure is building
- Look for price to follow within 1-3 bars
2. **SELL signal** (red V): When OBV crosses below signal line and holds for 2-3 bars
- Confirms selling pressure is increasing
- Expect price decline
3. **Exit:** Take profits at next signal or use price support/resistance
**Best For:** Swing trading, intraday reversals, timeframes 5m-1h
---
### **Strategy 2: Zero Line Bounce (Intermediate)**
**Setup:**
- Signal Filter Type: **Strength-Based**
- Min Z-Score Strength: **0.5**
- Show Z-Score StdDev Zones: **ON**
**Rules:**
1. **Watch OBV approach zero line** during established trends
- OBV bouncing repeatedly off zero = trend is healthy
- OBV breaking through zero = trend reversal imminent
2. **Enter on bounce:** Buy when OBV bounces from zero line in uptrend
3. **Exit on break:** Close position when OBV breaks below zero line
4. **Confirm with Z-Score:** Only take trades when Z-Score shows momentum (|Z| > 0.5)
**Best For:** Trend traders, identifying trend strength, medium timeframes 15m-4h
---
### **Strategy 3: Momentum Extremes (Advanced)**
**Setup:**
- Signal Filter Type: **None**
- Show Z-Score StdDev Zones: **ON**
- Outer Zone: **2.0**
**Rules:**
1. **Identify extremes:** When Z-Score breaks outer zone (±2.0)
- Indicator is in extreme territory
- Likely overextended
2. **Fade extremes:** Take opposite position when Z-Score hits extreme
- High Z (>2.0) = OBV overbought, expect pullback
- Low Z (<-2.0) = OBV oversold, expect bounce
3. **Confirm:** Wait for crossover signal to enter
4. **Target:** Outer zone of opposite side or zero line
**Best For:** Range trading, mean reversion, experienced traders only
---
## Reading the Indicator in Different Markets
### **Strong Uptrend**
- OBV consistently above signal line (green)
- OBV well above zero line, rising higher lows
- Z-Score positive, trending upward
- **Action:** Buy dips to signal line, sell at resistance
### **Strong Downtrend**
- OBV consistently below signal line (red)
- OBV well below zero line, making lower highs
- Z-Score negative, trending downward
- **Action:** Sell rallies to signal line, cover at support
### **Consolidation/Choppy Market**
- OBV whipsaws around signal line frequently
- Crossovers occur every few bars
- Z-Score oscillating between -1 and +1
- **Action:** Increase confirmation bars to 3-4, or switch to strength-based filter
### **Accumulation (Bottom Formation)**
- OBV rising while price is flat or falling
- Volume flowing in despite downtrend (bullish divergence)
- Z-Score climbing while price lows hold
- **Action:** Expect breakout up; prepare buy near support
### **Distribution (Top Formation)**
- OBV falling while price is flat or rising
- Volume flowing out despite uptrend (bearish divergence)
- Z-Score falling while price continues higher
- **Action:** Expect breakdown down; prepare short near resistance
---
## Parameter Tuning Guide
### **Aggressive Settings (More Signals)**
- Smoothing Length: 14
- Signal Filter: None or Confirmation Bars: 1
- Min Z-Score: 0.1
- Best for: Day trading, high volatility stocks
- Risk: More false signals
### **Balanced Settings (Recommended)**
- Smoothing Length: 21
- Signal Filter: Confirmation Bars: 2
- Min Z-Score: 0.3
- Best for: Swing trading, most market conditions
- Risk/Reward: Moderate
### **Conservative Settings (Fewer Signals)**
- Smoothing Length: 30-40
- Signal Filter: Confirmation Bars: 3-4 or Strength-Based: 0.7+
- Min Z-Score: 0.8
- Best for: Position trading, high-conviction trades only
- Risk: May miss some moves
---
## Common Questions & Troubleshooting
**Q: Why are there more sell signals than buy signals?**
A: This reflects the actual market action. Markets often decline faster than they rise (fear > greed). Confirm signals with price action and support/resistance.
**Q: The indicator keeps whipsawing, should I hide it?**
A: Increase Confirmation Bars to 3-4 or switch to Strength-Based filter. Market conditions matter—choppy markets require stricter filters.
**Q: What's the difference between normalized and raw OBV?**
A: Normalized (detrended) shows shorter-term momentum by removing long-term trends. Raw OBV shows absolute accumulation/distribution over the full period. Use normalized for swing signals, raw for trend confirmation.
**Q: My signals come too late. How do I get faster entry?**
A: Reduce Smoothing Length (try 14 instead of 21), use EMA instead of SMA, or set Confirmation Bars to 1. Trade-off: More false signals.
**Q: Can I use this for day trading?**
A: Yes, on 1m-5m charts with aggressive settings. Use Confirmation Bars: 1 and focus on Z-Score > 0.5 entries only.
**Q: Should I trade every signal?**
A: No. Filter signals using: price near support/resistance, multiple indicators confirming, and Z-Score showing momentum. Best signals occur at key levels.
---
## Best Practices
1. **Always confirm with price action:** OBV signals work best when price is near support, resistance, or moving average. Don't trade signals in a vacuum.
2. **Use volume context:** Check if volume is increasing or decreasing on the signal. Strong signals have volume confirmation (increasing volume on OBV spikes).
3. **Adjust settings per timeframe:**
- 1m-5m: Smoothing 12, Confirmation 1, Z-Score 0.2
- 15m-1h: Smoothing 20, Confirmation 2, Z-Score 0.3
- 4h-1d: Smoothing 25, Confirmation 3, Z-Score 0.5
4. **Watch the zero line:** It's your friend. OBV behavior at the zero line reveals trend strength. Bounces = healthy trend. Breaks = reversal.
5. **Risk management:** No indicator is perfect. Use proper position sizing and stop losses. OBV should confirm your thesis, not be the only reason to trade.
6. **Combine with other indicators:**
- Price moving averages for trend confirmation
- RSI or Stochastic for overbought/oversold levels
- Support/resistance for entry/exit zones
- MACD for momentum divergences
---
## Disclaimer
This indicator is for educational and informational purposes only. It is not financial advice. Past performance does not guarantee future results. Always conduct your own research and consult with a financial advisor before making trading decisions. Trading carries risk, including potential loss of principal.
---
## Version History
**Version 1.0** - Initial release with enhanced signal filtering, Z-Score analysis, and customizable parameters.

ICT Fair Value Gap Detector [Eˣ]⚡ Fair Value Gap Detector
Overview
The Fair Value Gap Detector automatically identifies price imbalances on your charts - the inefficiencies left behind when price moves too quickly. This indicator reveals where price is likely to return for "rebalancing", based on ICT (Inner Circle Trader) concepts of market efficiency.
━━━━━━━━━━━━━━━━━━━━━━━━━━━━
🎯 What This Indicator Does
Detects Fair Value Gaps:
• 🟢 Bullish FVG - Gap left below during aggressive upward move
• 🔴 Bearish FVG - Gap left above during aggressive downward move
• Automatically identifies 3-candle price inefficiencies
• Works on all timeframes and instruments
Smart Fill Tracking:
• Full Fill - Price completely fills the gap
• 50% Fill - Price fills half the gap (critical level)
• Partial Fill - Price touches gap edge
• Real-time fill percentage tracking
• Auto-removes filled gaps (optional)
Professional Features:
• Active Gap Highlighting - Shows nearest unfilled gap
• Distance Calculator - Displays how far price is from gaps
• Market Bias - Analysis based on gap balance
• Size Filtering - Minimum gap size to avoid noise
• Visual Clarity - Clean boxes with color-coding
━━━━━━━━━━━━━━━━━━━━━━━━━━━━
📚 Understanding Fair Value Gaps
What Are Fair Value Gaps?
Fair Value Gaps (FVGs), also known as imbalances or inefficiencies, are zones where price moved so quickly that normal trading didn't occur. They represent:
• Price Imbalance - One-sided aggressive buying or selling
• Unfair Pricing - Some participants didn't get to trade at these levels
• Market Inefficiency - Supply/demand equilibrium was disrupted
• Rebalancing Zones - Price often returns to "fill" these gaps
The ICT Concept:
Markets constantly seek equilibrium (fair value). When price moves too fast:
1. It leaves gaps where normal trading didn't happen
2. These gaps represent unfair/inefficient pricing
3. Market has a tendency to return and "rebalance"
4. Smart money knows this and trades the fills
Why FVGs Work:
• Unfilled Orders - Traders who missed the move have pending orders in the gap
• Algorithmic Trading - Algos programmed to exploit inefficiencies
• Market Psychology - Traders notice gaps and place orders there
• Institutional Behavior - Smart money uses gaps for entries/exits
FVG vs Regular Gaps:
• Regular Gaps - Occur at market open, between daily closes
• Fair Value Gaps - Occur intraday, between 3 consecutive candles
• FVGs happen more frequently and on all timeframes
• FVGs are more tradeable for intraday/swing traders
━━━━━━━━━━━━━━━━━━━━━━━━━━━━
🟢 Bullish Fair Value Gaps Explained
How They Form:
Bullish FVG requires 3 candles:
1. Candle 1 - Any candle (sets the high reference)
2. Candle 2 - Strong bullish candle (aggressive buying)
3. Candle 3 - Continuation candle
The Gap: Candle 3's LOW is above Candle 1's HIGH = Gap left unfilled
Visual Example:
```
Candle 3: Low at $105 ──────────┐
│ ← GAP (Bullish FVG)
Candle 2: Strong bullish │
│
Candle 1: High at $100 ──────────┘
```
What It Means:
• Price jumped from $100 to $105+ so fast, no trading occurred in between
• This $100-$105 zone is "unfair" - buyers/sellers didn't get to trade there
• Market may return to this zone to "rebalance"
• When price returns, it often acts as support
Trading Bullish FVGs:
Strategy:
• Wait for price to retrace down into the bullish FVG (green box)
• Look for rejection/bounce from the gap zone
• Enter long when price respects the FVG as support
• Stop loss: Below the FVG
• Target: Previous high or opposite FVG
Best Entry Points:
• 50% Fill: Price enters middle of gap (highest probability)
• Full Fill: Price touches bottom of gap (aggressive entry)
• Tap & Reject: Price quickly enters and exits gap (strong signal)
Example Trade:
• Bullish FVG forms: $50,000 - $50,500 (500 point gap)
• Price rallies to $52,000 then retraces
• Price drops to $50,250 (50% of gap filled)
• Bullish reversal candle appears
• Enter long at $50,500, stop at $49,800
• Target: $52,000+
━━━━━━━━━━━━━━━━━━━━━━━━━━━━
🔴 Bearish Fair Value Gaps Explained
How They Form:
Bearish FVG requires 3 candles:
1. Candle 1 - Any candle (sets the low reference)
2. Candle 2 - Strong bearish candle (aggressive selling)
3. Candle 3 - Continuation candle
The Gap: Candle 3's HIGH is below Candle 1's LOW = Gap left unfilled
Visual Example:
```
Candle 1: Low at $100 ───────────┐
│ ← GAP (Bearish FVG)
Candle 2: Strong bearish │
│
Candle 3: High at $95 ───────────┘
```
What It Means:
• Price dropped from $100 to $95 so fast, no trading occurred in between
• This $95-$100 zone is "unfair" - buyers/sellers didn't get to trade there
• Market may return to this zone to "rebalance"
• When price returns, it often acts as resistance
Trading Bearish FVGs:
Strategy:
• Wait for price to retrace up into the bearish FVG (red box)
• Look for rejection/reversal from the gap zone
• Enter short when price respects the FVG as resistance
• Stop loss: Above the FVG
• Target: Previous low or opposite FVG
Best Entry Points:
• 50% Fill: Price enters middle of gap (highest probability)
• Full Fill: Price touches top of gap (aggressive entry)
• Tap & Reject: Price quickly enters and exits gap (strong signal)
Example Trade:
• Bearish FVG forms: $48,000 - $48,500 (500 point gap)
• Price drops to $46,000 then retraces
• Price rallies to $48,250 (50% of gap filled)
• Bearish reversal candle appears
• Enter short at $48,000, stop at $48,700
• Target: $46,000-
━━━━━━━━━━━━━━━━━━━━━━━━━━━━
📊 How To Use This Indicator
Strategy 1: FVG Rebalancing (Classic)
Best For: Swing trading, reversal trading
Timeframes: 15min, 1H, 4H
Win Rate: 65-75%
Entry Rules:
1. Identify unfilled FVG (bright color, not gray)
2. Wait for price to return to the gap
3. Best entry: 50% fill of the gap
4. Look for reversal confirmation:
• Bullish FVG: Pin bar, engulfing, hammer
• Bearish FVG: Shooting star, bearish engulfing
5. Enter when price bounces/rejects from FVG
6. Stop: Beyond opposite side of FVG
7. Target: 2-3R or previous high/low
Why It Works: 70%+ of FVGs get filled, and 60%+ show reaction
Strategy 2: FVG + Order Block Confluence
Best For: High-probability setups
Timeframes: 1H, 4H
Win Rate: 75-85%
Entry Rules:
1. Find FVG that overlaps with Order Block
2. This creates a "super zone" of confluence
3. Wait for price to return to this zone
4. Enter on first touch of confluence zone
5. Stop: Beyond the confluence zone
6. Target: 3-4R
Why It Works: Double institutional concepts = highest probability
Strategy 3: Multi-Timeframe FVG
Best For: Position trading, major moves
Timeframes: Combine Daily + 4H or 4H + 1H
Win Rate: 70-80%
Entry Rules:
1. Identify large FVG on higher timeframe (Daily/4H)
2. Wait for price to enter this HTF FVG
3. Switch to lower timeframe (4H/1H)
4. Look for LTF FVG within HTF FVG in same direction
5. Trade the LTF FVG fill
6. Stop: Below LTF FVG
7. Target: Exit HTF FVG or beyond
Why It Works: Timeframe alignment = institutional consensus
Strategy 4: FVG Rejection Trade
Best For: Quick scalps, day trading
Timeframes: 5min, 15min
Win Rate: 60-70%
Entry Rules:
1. Price enters FVG zone
2. Immediate rejection (strong reversal candle)
3. Enter on close of rejection candle
4. Tight stop beyond FVG
5. Quick target: 1-2R
Why It Works: Strong rejection = institutional defense of level
Strategy 5: FVG-to-FVG Trading
Best For: Momentum trading
Timeframes: 15min, 1H
Win Rate: 55-65%
Entry Rules:
1. Identify bullish FVG below and bearish FVG above
2. Enter long at bullish FVG, target bearish FVG
3. Or enter short at bearish FVG, target bullish FVG
4. Price often moves from one imbalance to another
5. Stop: Beyond trading FVG
6. Target: Opposite FVG
Why It Works: Price rebalances from one inefficiency to another
━━━━━━━━━━━━━━━━━━━━━━━━━━━━
⚙️ Settings Explained
Display Settings
Show Bullish/Bearish FVG
• Toggle each type on/off independently
• Customize colors for each FVG type
• Default: Green (bullish), Red (bearish)
• Tip: Use colors that contrast with your chart
Max FVG to Display (Default: 20)
• Limits how many gaps are shown at once
• Lower (10-15): Cleaner chart, recent gaps only
• Higher (30-50): More historical context
• Recommended: 15-25 for most trading
Show FVG Labels (Default: ON)
• Displays "FVG+" and "FVG-" text on gaps
• Shows 🎯 on active (nearest) gap
• Shows fill percentage (e.g., "FVG+ 35%")
• Turn OFF for minimal appearance
• Recommended: Keep ON for clarity
Extend Gaps (bars) (Default: 50)
• How far to extend gap boxes to the right
• Lower (20-30): Shorter boxes
• Higher (100+): Longer boxes, easier to see
• Gaps auto-extend until filled or limit reached
• Recommended: 40-60 bars
Filters
Min Gap Size % (Default: 0.05)
• Minimum gap size as percentage of price
• Filters out tiny, insignificant gaps
• Crypto: 0.05-0.15% (high volatility)
• Forex: 0.03-0.10% (moderate volatility)
• Stocks: 0.05-0.20% (varies by stock)
• Indices: 0.05-0.15%
• Adjust based on instrument's average move
Show Filled Gaps (Default: OFF)
• When ON: Shows gray boxes for filled gaps
• When OFF: Gaps disappear after mitigation
• Use ON: For learning and backtesting
• Use OFF: For clean, active trading view
Advanced Settings
Auto-Detect Mitigation (Default: ON)
• Automatically tracks when gaps are filled
• Updates fill percentage in real-time
• Marks gaps as "mitigated" when filled
• Recommended: Keep ON
Mitigation Type (Default: Full)
• Full: Gap considered filled when price closes through entire gap
• 50%: Gap considered filled at 50% (critical level)
• Partial: Gap considered filled on first touch
• For learning: Use "Full"
• For aggressive trading: Use "50%"
• For conservative trading: Use "Partial"
Highlight Nearest Gap (Default: ON)
• Highlights the closest unfilled gap to current price
• Active gap shown with 🎯 emoji and brighter color
• Helps focus on most relevant opportunity
• Recommended: Keep ON
━━━━━━━━━━━━━━━━━━━━━━━━━━━━
📱 Info Panel Guide
Bullish FVG Count
• Number of active (unfilled) bullish fair value gaps
• Higher number = More potential support zones below
• Multiple bullish FVGs = Strong rebalancing demand
Bearish FVG Count
• Number of active (unfilled) bearish fair value gaps
• Higher number = More potential resistance zones above
• Multiple bearish FVGs = Strong rebalancing supply
Bias Indicator
• ⬆ Bullish: More bullish FVGs than bearish
• ⬇ Bearish: More bearish FVGs than bullish
• ↔ Neutral: Equal FVGs on both sides
• Market tends to fill nearby gaps first
Target Indicator
• Shows nearest unfilled gap and distance
• Example: "Bull FVG -1.25%" = Bullish gap is 1.25% below price
• Example: "Bear FVG +0.85%" = Bearish gap is 0.85% above price
• Watch for price to reach these targets
━━━━━━━━━━━━━━━━━━━━━━━━━━━━
📱 Alert Setup
This indicator includes 4 alert types:
1. Price Entering Bullish FVG
• Fires when price drops into a bullish gap
• Action: Watch for bounce/reversal
• High-probability long setup developing
2. Price Entering Bearish FVG
• Fires when price rallies into a bearish gap
• Action: Watch for rejection/reversal
• High-probability short setup developing
3. New Bullish FVG Detected
• Fires when a new bullish gap forms
• Action: Mark zone for future fill
• New rebalancing target below identified
4. New Bearish FVG Detected
• Fires when a new bearish gap forms
• Action: Mark zone for future fill
• New rebalancing target above identified
To Set Up Alerts:
1. Click "Alert" button (clock icon)
2. Select "Fair Value Gap Detector"
3. Choose your alert condition
4. Configure notification method
5. Click "Create"
Pro Tip: Set "Price Entering" alerts to catch fills in real-time
━━━━━━━━━━━━━━━━━━━━━━━━━━━━
💎 Pro Tips & Best Practices
✅ DO:
• Wait for 50% fill - Middle of gap has highest win rate (65-70%)
• Use confirmation - Don't trade just because price touched gap
• Combine with structure - FVG + support/resistance = high probability
• Trade first fill - Unfilled gaps have better success rate than refilled
• Respect full fills - Once fully filled, gap is less reliable
• Use multiple timeframes - HTF FVGs are stronger than LTF
• Check session timing - FVGs work best during London/NY sessions
• Follow the bias - More bullish FVGs = favor longs
⚠️ DON'T:
• Don't blindly fade gaps - Wait for price action confirmation
• Don't ignore momentum - Strong trends can blow through FVGs
• Don't trade every gap - Quality over quantity
• Don't assume all gaps fill - About 70-80% fill, 20-30% don't
• Don't use tight stops - Allow room for wick into gap
• Don't overtrade - Wait for confluence and confirmation
• Don't fight trends - Best FVG trades are with higher TF trend
• Don't ignore fill percentage - 50% is often the sweet spot
🎯 Best Timeframes:
• Scalpers: 1min, 5min (many gaps, quick fills)
• Day Traders: 5min, 15min, 1H (balanced)
• Swing Traders: 1H, 4H, Daily (larger, more reliable gaps)
• Position Traders: 4H, Daily, Weekly (major imbalances)
🔥 Best Instruments:
• Excellent: BTC, ETH, ES, NQ, Forex majors (clean price action)
• Good: Gold, Oil, Major indices, Large-cap stocks
• Moderate: Altcoins, small-cap stocks (more noise)
• Best Markets: Trending markets with clear swings
⏰ Best Times for FVG Trading:
• London Session: High volume = reliable gap fills
• NY Session: Strong moves create quality gaps
• London-NY Overlap: Best time for gap creation and fills
• Asian Session: Lower probability, wait for London
━━━━━━━━━━━━━━━━━━━━━━━━━━━━
🎓 Advanced FVG Concepts
FVG Mitigation Levels
Understanding fill percentages:
• 0-25% Fill: Gap barely touched, often continues without fill
• 25-50% Fill: Partial rebalancing, may reverse here
• 50% Fill: CRITICAL LEVEL - Highest probability reversal zone
• 50-75% Fill: Deep rebalancing, strong reversal likely
• 75-100% Fill: Full rebalancing, gap's purpose fulfilled
Why 50% Matters: Market seeks equilibrium, and 50% represents perfect balance
FVG Inversions
When price breaks through a gap completely:
• Bullish FVG that's broken becomes bearish (support → resistance)
• Bearish FVG that's broken becomes bullish (resistance → support)
• Inverted gaps are weaker than fresh gaps
• Trading: Can fade the inverted gap but with caution
FVG Confluence Zones
Multiple FVGs at similar level:
• Creates "super gap" or confluence zone
• Much higher probability of reaction
• Wider zone for entries (more room for stops)
• Often aligns with other institutional concepts
FVG + Order Block Combo
When FVG overlaps with Order Block:
• Double institutional concept
• Extremely high probability setup (75-85% win rate)
• Price drawn to fill gap AND test order block
• Use tight stops, generous targets (3-5R possible)
Nested FVGs (Multi-Timeframe)
Small FVG inside larger FVG:
• Daily FVG contains 4H FVG contains 1H FVG
• Trade the smallest FVG in direction of larger ones
• Highest probability when all aligned
• Progressive targets: Fill small → medium → large gaps
FVG Exhaustion
When price creates multiple FVGs in same direction:
• Indicates strong momentum/impulsive move
• Each gap represents acceleration
• Last gap often signals exhaustion
• Watch for reversal after filling final gap
━━━━━━━━━━━━━━━━━━━━━━━━━━━━
📈 Common FVG Patterns
Pattern 1: The Perfect Rebalance
• FVG forms during strong move
• Price continues 100+ pips
• Clean return to 50% of gap
• Immediate reversal
• Textbook setup, 70%+ win rate
Pattern 2: The Double Fill
• Price partially fills gap (25%)
• Weak reaction, continues
• Returns again for deeper fill (75%)
• Strong reversal on second fill
• Second fill often better entry
Pattern 3: The Blow-Through
• Price approaches gap
• Completely ignores it, no reaction
• Keeps going in same direction
• Sign of very strong momentum
Pattern 4: The Magnet Effect
• Price slowly grinds toward gap
• Accelerates as it gets close
• Quickly fills and reverses
• Common in ranging markets
Pattern 5: The False Fill
• Price wicks into gap briefly
• Immediately reverses without filling
• "Stop hunt" or liquidity grab
• Gap remains unfilled
• Often precedes strong move
━━━━━━━━━━━━━━━━━━━━━━━━━━━━
🚀 What Makes This Different?
Unlike basic gap indicators, Fair Value Gap Detector:
• ICT Methodology - Based on proven institutional concepts
• Real-Time Fill Tracking - Shows percentage filled as it happens
• 3 Mitigation Types - Full, 50%, Partial for different strategies
• Active Gap Highlighting - Shows most relevant opportunity
• Smart Filtering - Minimum size to avoid noise
• Visual Clarity - Clean, professional appearance
• Auto-Management - Removes filled gaps automatically
• Distance Tracking - Know exactly where price needs to go
Based On Professional Concepts:
• ICT Fair Value Gap theory
• Market efficiency principles
• Price rebalancing dynamics
• Institutional order flow analysis
━━━━━━━━━━━━━━━━━━━━━━━━━━━━
📈 FVG Statistics & Probabilities
Based on ICT concepts and trader observations:
Gap Fill Rates:
• 70-80% of FVGs get filled eventually
• 60-70% show some reaction when filled
• 50% fill level has ~65% reversal rate
• Full fills have ~55% reversal rate
Timeframe Reliability:
• Daily FVGs: ~75-85% fill rate, strongest reactions
• 4H FVGs: ~70-80% fill rate, strong reactions
• 1H FVGs: ~65-75% fill rate, good reactions
• 15min FVGs: ~60-70% fill rate, moderate reactions
• 5min FVGs: ~55-65% fill rate, weaker reactions
Best Practices:
• First touch of gap = 65-70% win rate
• 50% fill = 65% win rate
• FVG + Order Block = 75-85% win rate
• Multi-timeframe aligned FVG = 70-80% win rate
• FVG in trending market = 60-70% win rate
Common Failures:
• Strong momentum blows through gaps (20-30% of time)
• Gaps in low-volume periods less reliable
• Very small gaps (<0.05%) often ignored
• Counter-trend gaps have lower success rate
━━━━━━━━━━━━━━━━━━━━━━━━━━━━
🙏 If You Find This Helpful
• ⭐ Leave your feedback
• 💬 Share your experience in the comments
• 🔔 Follow for updates and new tools
Questions about Fair Value Gaps? Feel free to ask in the comments.
━━━━━━━━━━━━━━━━━━━━━━━━━━━━
Version History
• v1.0 - Initial release with 3-candle FVG detection and real-time fill tracking

Cold Brew Ranges🧭 Core Logic and Calculation
The fundamental logic for each range (OR and CR) is identical:
Time Definition: Each range is defined by a specific Start Time and a fixed 30-second duration. The timestamp function, using the "America/New_York" time zone, is used to calculate the exact start time in Unix milliseconds for the current day.
Example: t0200 = timestamp(TZ, yC, mC, dC, 2, 0, 0) sets the start time for the 02:00 OR to 2:00:00 AM NY time.
Range Data Collection: The indicator uses the request.security_lower_tf() function to collect the High (hArr) and Low (lArr) prices of all bars that fall within the defined 30-second window, using a user-specified, sub-chart-timeframe (openrangetime, defaulted to "1" second, "30S", or "5" minutes). This ensures high precision in capturing the exact high and low during the 30-second window.
High/Low Determination: It iteratively finds the absolute highest price (OR_high) and the absolute lowest price (OR_low) recorded by the bars during that 30-second window.
Range Locking: Once the current chart bar's time (lastTs) passes the 30-second End Time (tEnd), the High and Low are locked (OR_locked = true), meaning the range calculation is complete for the day.
Drawing: Upon locking, the range is drawn on the chart using line.new for the High, Low, and Equilibrium, and box.new for the shaded fill. The lines are extended to a subsequent time anchor point (e.g., the 02:00 OR is extended to 08:20, the 09:30 OR is extended to 16:00).
Equilibrium (EQ): This is calculated as the simple average (midpoint) of the High and Low of the range.
EQ=
2
OR_High+OR_Low
⏰ Defined Trading Ranges
The indicator defines and tracks the following specific 30-second ranges:
Range Name Type Start Time (NY) Line Extension End Time (NY) Common Market Context
02:00 OR Opening 02:00:00 08:20:00 Asian/European Market Overlap
08:20 OR Opening 08:20:00 16:00:00 Pre-New York Open
09:30 OR Opening 09:30:00 16:00:00 New York Stock Exchange Open (Most significant OR)
18:00 OR Opening 18:00:00 20:00:00 Futures Market Open (Sunday/Monday)
20:00 OR Opening 20:00:00 Next Day's session start Asian Session Start
15:50 CR Closing 15:50:00 20:00:00 New York Close Range
⚙️ Key User Inputs and Customization
The script offers extensive control over which ranges are displayed and how they are visualized:
Range Time & History
openrangetime: Sets the sub-timeframe (e.g., "1" for 1 second) used to calculate the precise High/Low of the 30-second range. Crucial for accuracy.
showHistory: A toggle to show the ranges from previous days (up to a histCap of 50 days).
Range Toggles and Styling
On/Off Toggles: Independent input.bool (e.g., OR_0200_on) to enable or disable the display of each individual range.
Colors & Width: Separate color and width inputs for the High/Low lines (hlC), the Equilibrium line (eqC), and the background fill (fillC) for each range.
Line Styles: Global inputs for the line styles of High/Low (lineStyleInput) and Equilibrium (eqLineStyleInput) lines (Solid, Dotted, or Dashed).
showFill: Global toggle to enable the shaded background box that highlights the area between the High and Low.
Extensions
The script calculates and plots extensions (multiples of the initial range) above the High and below the Low.
showExt: Toggles the visibility of the extension lines.
useRangeMultiples: If true, the step size for each extension level is equal to the initial range size:
Step=Range=OR_High−OR_Low
If false, the step size is a fixed value defined by stepPts (e.g., 60.0 points, which is a common value for NQ futures).
stepCnt: Determines how many extension levels (multiples) are drawn above and below the range (default is 10).
📈 Trading Strategy Implications
The Cold Brew Ranges indicator is a tool for session-based support and resistance and range breakout/reversal strategies.
Key Support/Resistance: The High and Low of these defined opening ranges often act as strong, predefined price levels. Traders look for price rejection off these boundaries or a breakout with conviction.
Equilibrium (Midpoint): The EQ often represents a fair value for that specific session's opening. Movements away from it are seen as opportunities, and a return to it is common.
Extensions: The range extensions serve as potential profit targets or stronger, layered support/resistance levels if the market trends aggressively after the opening range is set.
The core idea is that the activity in the first 30 seconds of a significant trading session (like the NYSE or a market session open) sets a bias and initial boundary for the trading period that follows.

XAUUSD 1m SMC Zones (BOS + Flexible TP Modes + Trailing Runner)//@version=6
strategy("XAUUSD 1m SMC Zones (BOS + Flexible TP Modes + Trailing Runner)",
overlay = true,
initial_capital = 10000,
pyramiding = 10,
process_orders_on_close = true)
//━━━━━━━━━━━━━━━━━━━
// 1. INPUTS
//━━━━━━━━━━━━━━━━━━━
// TP / SL
tp1Pips = input.int(10, "TP1 (pips)", minval = 1)
fixedSLpips = input.int(50, "Fixed SL (pips)", minval = 5)
runnerRR = input.float(3.0, "Runner RR (TP2 = SL * RR)", step = 0.1, minval = 1.0)
// Daily risk
maxDailyLossPct = input.float(5.0, "Max daily loss % (stop trading)", step = 0.5)
maxDailyProfitPct = input.float(20.0, "Max daily profit % (stop trading)", step = 1.0)
// HTF S/R (1H)
htfTF = input.string("60", "HTF timeframe (minutes) for S/R block")
// Profit strategy (Option C)
profitStrategy = input.string("Minimal Risk | Full BE after TP1", "Profit Strategy", options = )
// Runner stop mode (your option 4)
runnerStopMode = input.string( "BE only", "Runner Stop Mode", options = )
// ATR trail settings (only used if ATR mode selected)
atrTrailLen = input.int(14, "ATR Length (trail)", minval = 1)
atrTrailMult = input.float(1.0, "ATR Multiplier (trail)", step = 0.1, minval = 0.1)
// Pip size (for XAUUSD: 1 pip = 0.10 if tick = 0.01)
pipSize = syminfo.mintick * 10.0
tp1Points = tp1Pips * pipSize
slPoints = fixedSLpips * pipSize
baseQty = input.float (1.0, "Base order size" , step = 0.01, minval = 0.01)
//━━━━━━━━━━━━━━━━━━━
// 2. DAILY RISK MANAGEMENT
//━━━━━━━━━━━━━━━━━━━
isNewDay = ta.change(time("D")) != 0
var float dayStartEquity = na
var bool dailyStopped = false
equityNow = strategy.initial_capital + strategy.netprofit
if isNewDay or na(dayStartEquity)
dayStartEquity := equityNow
dailyStopped := false
dailyPnL = equityNow - dayStartEquity
dailyPnLPct = dayStartEquity != 0 ? (dailyPnL / dayStartEquity) * 100.0 : 0.0
if not dailyStopped
if dailyPnLPct <= -maxDailyLossPct
dailyStopped := true
if dailyPnLPct >= maxDailyProfitPct
dailyStopped := true
canTradeToday = not dailyStopped
//━━━━━━━━━━━━━━━━━━━
// 3. 1H S/R ZONES (for direction block)
//━━━━━━━━━━━━━━━━━━━
htOpen = request.security(syminfo.tickerid, htfTF, open)
htHigh = request.security(syminfo.tickerid, htfTF, high)
htLow = request.security(syminfo.tickerid, htfTF, low)
htClose = request.security(syminfo.tickerid, htfTF, close)
// Engulf logic on HTF
htBullPrev = htClose > htOpen
htBearPrev = htClose < htOpen
htBearEngulf = htClose < htOpen and htBullPrev and htOpen >= htClose and htClose <= htOpen
htBullEngulf = htClose > htOpen and htBearPrev and htOpen <= htClose and htClose >= htOpen
// Liquidity sweep on HTF previous candle
htSweepHigh = htHigh > ta.highest(htHigh, 5)
htSweepLow = htLow < ta.lowest(htLow, 5)
// Store last HTF zones
var float htResHigh = na
var float htResLow = na
var float htSupHigh = na
var float htSupLow = na
if htBearEngulf and htSweepHigh
htResHigh := htHigh
htResLow := htLow
if htBullEngulf and htSweepLow
htSupHigh := htHigh
htSupLow := htLow
// Are we inside HTF zones?
inHtfRes = not na(htResHigh) and close <= htResHigh and close >= htResLow
inHtfSup = not na(htSupLow) and close >= htSupLow and close <= htSupHigh
// Block direction against HTF zones
longBlockedByZone = inHtfRes // no buys in HTF resistance
shortBlockedByZone = inHtfSup // no sells in HTF support
//━━━━━━━━━━━━━━━━━━━
// 4. 1m LOCAL ZONES (LIQUIDITY SWEEP + ENGULF + QUALITY SCORE)
//━━━━━━━━━━━━━━━━━━━
// 1m engulf patterns
bullPrev1 = close > open
bearPrev1 = close < open
bearEngulfNow = close < open and bullPrev1 and open >= close and close <= open
bullEngulfNow = close > open and bearPrev1 and open <= close and close >= open
// Liquidity sweep by previous candle on 1m
sweepHighPrev = high > ta.highest(high, 5)
sweepLowPrev = low < ta.lowest(low, 5)
// Local zone storage (one active support + one active resistance)
// Quality score: 1 = engulf only, 2 = engulf + sweep (we only trade ≥2)
var float supLow = na
var float supHigh = na
var int supQ = 0
var bool supUsed = false
var float resLow = na
var float resHigh = na
var int resQ = 0
var bool resUsed = false
// New resistance zone: previous bullish candle -> bear engulf
if bearEngulfNow
resLow := low
resHigh := high
resQ := sweepHighPrev ? 2 : 1
resUsed := false
// New support zone: previous bearish candle -> bull engulf
if bullEngulfNow
supLow := low
supHigh := high
supQ := sweepLowPrev ? 2 : 1
supUsed := false
// Raw "inside zone" detection
inSupRaw = not na(supLow) and close >= supLow and close <= supHigh
inResRaw = not na(resHigh) and close <= resHigh and close >= resLow
// QUALITY FILTER: only trade zones with quality ≥ 2 (engulf + sweep)
highQualitySup = supQ >= 2
highQualityRes = resQ >= 2
inSupZone = inSupRaw and highQualitySup and not supUsed
inResZone = inResRaw and highQualityRes and not resUsed
// Plot zones
plot(supLow, "Sup Low", color = color.new(color.lime, 60), style = plot.style_linebr)
plot(supHigh, "Sup High", color = color.new(color.lime, 60), style = plot.style_linebr)
plot(resLow, "Res Low", color = color.new(color.red, 60), style = plot.style_linebr)
plot(resHigh, "Res High", color = color.new(color.red, 60), style = plot.style_linebr)
//━━━━━━━━━━━━━━━━━━━
// 5. MODERATE BOS (3-BAR FRACTAL STRUCTURE)
//━━━━━━━━━━━━━━━━━━━
// 3-bar swing highs/lows
swHigh = high > high and high > high
swLow = low < low and low < low
var float lastSwingHigh = na
var float lastSwingLow = na
if swHigh
lastSwingHigh := high
if swLow
lastSwingLow := low
// BOS conditions
bosUp = not na(lastSwingHigh) and close > lastSwingHigh
bosDown = not na(lastSwingLow) and close < lastSwingLow
// Zone “arming” and BOS validation
var bool supArmed = false
var bool resArmed = false
var bool supBosOK = false
var bool resBosOK = false
// Arm zones when first touched
if inSupZone
supArmed := true
if inResZone
resArmed := true
// BOS after arming → zone becomes valid for entries
if supArmed and bosUp
supBosOK := true
if resArmed and bosDown
resBosOK := true
// Reset BOS flags when new zones are created
if bullEngulfNow
supArmed := false
supBosOK := false
if bearEngulfNow
resArmed := false
resBosOK := false
//━━━━━━━━━━━━━━━━━━━
// 6. ENTRY CONDITIONS (ZONE + BOS + RISK STATE)
//━━━━━━━━━━━━━━━━━━━
flatOrShort = strategy.position_size <= 0
flatOrLong = strategy.position_size >= 0
longSignal = canTradeToday and not longBlockedByZone and inSupZone and supBosOK and flatOrShort
shortSignal = canTradeToday and not shortBlockedByZone and inResZone and resBosOK and flatOrLong
//━━━━━━━━━━━━━━━━━━━
// 7. ORDER LOGIC – TWO PROFIT STRATEGIES
//━━━━━━━━━━━━━━━━━━━
// Common metrics
atrTrail = ta.atr(atrTrailLen)
// MINIMAL MODE: single trade, BE after TP1, optional trailing
// HYBRID MODE: two trades (Scalp @ TP1, Runner @ TP2)
// Persistent tracking
var float longEntry = na
var float longTP1 = na
var float longTP2 = na
var float longSL = na
var bool longBE = false
var float longRunEntry = na
var float longRunTP1 = na
var float longRunTP2 = na
var float longRunSL = na
var bool longRunBE = false
var float shortEntry = na
var float shortTP1 = na
var float shortTP2 = na
var float shortSL = na
var bool shortBE = false
var float shortRunEntry = na
var float shortRunTP1 = na
var float shortRunTP2 = na
var float shortRunSL = na
var bool shortRunBE = false
isMinimal = profitStrategy == "Minimal Risk | Full BE after TP1"
isHybrid = profitStrategy == "Hybrid | Scalp TP + Runner TP"
//━━━━━━━━━━ LONG ENTRIES ━━━━━━━━━━
if longSignal
if isMinimal
longEntry := close
longSL := longEntry - slPoints
longTP1 := longEntry + tp1Points
longTP2 := longEntry + slPoints * runnerRR
longBE := false
strategy.entry("Long", strategy.long)
supUsed := true
supArmed := false
supBosOK := false
else if isHybrid
longRunEntry := close
longRunSL := longRunEntry - slPoints
longRunTP1 := longRunEntry + tp1Points
longRunTP2 := longRunEntry + slPoints * runnerRR
longRunBE := false
// Two separate entries, each 50% of baseQty (for backtest)
strategy.entry("LongScalp", strategy.long, qty = baseQty * 0.5)
strategy.entry("LongRun", strategy.long, qty = baseQty * 0.5)
supUsed := true
supArmed := false
supBosOK := false
//━━━━━━━━━━ SHORT ENTRIES ━━━━━━━━━━
if shortSignal
if isMinimal
shortEntry := close
shortSL := shortEntry + slPoints
shortTP1 := shortEntry - tp1Points
shortTP2 := shortEntry - slPoints * runnerRR
shortBE := false
strategy.entry("Short", strategy.short)
resUsed := true
resArmed := false
resBosOK := false
else if isHybrid
shortRunEntry := close
shortRunSL := shortRunEntry + slPoints
shortRunTP1 := shortRunEntry - tp1Points
shortRunTP2 := shortRunEntry - slPoints * runnerRR
shortRunBE := false
strategy.entry("ShortScalp", strategy.short, qty = baseQty * 50)
strategy.entry("ShortRun", strategy.short, qty = baseQty * 50)
resUsed := true
resArmed := false
resBosOK := false
//━━━━━━━━━━━━━━━━━━━
// 8. EXIT LOGIC – MINIMAL MODE
//━━━━━━━━━━━━━━━━━━━
// LONG – Minimal Risk: 1 trade, BE after TP1, runner to TP2
if isMinimal and strategy.position_size > 0 and not na(longEntry)
// Move to BE once TP1 is touched
if not longBE and high >= longTP1
longBE := true
// Base SL: BE or initial SL
float dynLongSL = longBE ? longEntry : longSL
// Optional trailing after BE
if longBE
if runnerStopMode == "Structure trail" and not na(lastSwingLow) and lastSwingLow > longEntry
dynLongSL := math.max(dynLongSL, lastSwingLow)
if runnerStopMode == "ATR trail"
trailSL = close - atrTrailMult * atrTrail
dynLongSL := math.max(dynLongSL, trailSL)
strategy.exit("Long Exit", "Long", stop = dynLongSL, limit = longTP2)
// SHORT – Minimal Risk: 1 trade, BE after TP1, runner to TP2
if isMinimal and strategy.position_size < 0 and not na(shortEntry)
if not shortBE and low <= shortTP1
shortBE := true
float dynShortSL = shortBE ? shortEntry : shortSL
if shortBE
if runnerStopMode == "Structure trail" and not na(lastSwingHigh) and lastSwingHigh < shortEntry
dynShortSL := math.min(dynShortSL, lastSwingHigh)
if runnerStopMode == "ATR trail"
trailSLs = close + atrTrailMult * atrTrail
dynShortSL := math.min(dynShortSL, trailSLs)
strategy.exit("Short Exit", "Short", stop = dynShortSL, limit = shortTP2)
//━━━━━━━━━━━━━━━━━━━
// 9. EXIT LOGIC – HYBRID MODE
//━━━━━━━━━━━━━━━━━━━
// LONG – Hybrid: Scalp + Runner
if isHybrid
// Scalp leg: full TP at TP1
if strategy.opentrades > 0
strategy.exit("LScalp TP", "LongScalp", stop = longRunSL, limit = longRunTP1)
// Runner leg
if strategy.position_size > 0 and not na(longRunEntry)
if not longRunBE and high >= longRunTP1
longRunBE := true
float dynLongRunSL = longRunBE ? longRunEntry : longRunSL
if longRunBE
if runnerStopMode == "Structure trail" and not na(lastSwingLow) and lastSwingLow > longRunEntry
dynLongRunSL := math.max(dynLongRunSL, lastSwingLow)
if runnerStopMode == "ATR trail"
trailRunSL = close - atrTrailMult * atrTrail
dynLongRunSL := math.max(dynLongRunSL, trailRunSL)
strategy.exit("LRun TP", "LongRun", stop = dynLongRunSL, limit = longRunTP2)
// SHORT – Hybrid: Scalp + Runner
if isHybrid
if strategy.opentrades > 0
strategy.exit("SScalp TP", "ShortScalp", stop = shortRunSL, limit = shortRunTP1)
if strategy.position_size < 0 and not na(shortRunEntry)
if not shortRunBE and low <= shortRunTP1
shortRunBE := true
float dynShortRunSL = shortRunBE ? shortRunEntry : shortRunSL
if shortRunBE
if runnerStopMode == "Structure trail" and not na(lastSwingHigh) and lastSwingHigh < shortRunEntry
dynShortRunSL := math.min(dynShortRunSL, lastSwingHigh)
if runnerStopMode == "ATR trail"
trailRunSLs = close + atrTrailMult * atrTrail
dynShortRunSL := math.min(dynShortRunSL, trailRunSLs)
strategy.exit("SRun TP", "ShortRun", stop = dynShortRunSL, limit = shortRunTP2)
//━━━━━━━━━━━━━━━━━━━
// 10. RESET STATE WHEN FLAT
//━━━━━━━━━━━━━━━━━━━
if strategy.position_size == 0
longEntry := na
shortEntry := na
longBE := false
shortBE := false
longRunEntry := na
shortRunEntry := na
longRunBE := false
shortRunBE := false
//━━━━━━━━━━━━━━━━━━━
// 11. VISUAL ENTRY MARKERS
//━━━━━━━━━━━━━━━━━━━
plotshape(longSignal, title = "Long Signal", style = shape.triangleup,
location = location.belowbar, color = color.lime, size = size.tiny, text = "L")
plotshape(shortSignal, title = "Short Signal", style = shape.triangledown,
location = location.abovebar, color = color.red, size = size.tiny, text = "S")

CRR Nemesis Fear & Greed ProIt measures 4 market indicators:
ATR → volatility.
Relative Volume (rVOL) → whether there is more or less volume than average.
Price distance from the moving average (SMA 50) in ATR → how much the trend has extended.
Candlestick shape → size of the body and wicks (who is dominating, bulls or bears).
It calculates two scores (0–100):
Greed → when:
The candlestick is bullish,
The price is above the SMA 50 (uptrend),
There is a good body, good rVOL, the price is far from the average, high volatility,
A longer upper wick adds a little more.
Fear → when:
The candlestick is bearish,
The price is below the SMA 50 (downtrend),
Similarly: strong body, rVOL, distance from the average, volatility,
A longer lower wick adds a little more.
Both scores are smoothed with a 3-period EMA (greedSmoothed and fearSmoothed).
It determines the overall market sentiment (HUD):
ANGEL (greed dominates):
Greed ≥ 55 and Greed − Fear ≥ 10.
DEVIL (fear dominates):
Fear ≥ 55 and Fear − Greed ≥ 10.
If neither condition is met → NEUTRAL.
HUD on screen (table in the upper right corner):
Displays:
STATUS: ANGEL / DEVIL / NEUTRAL (with color).
FEAR: smoothed fear value.
GREED: smoothed greed value.
🧠 In simple terms:
It's a market sentiment engine: it combines volume, ATR, distance from the trend, and candlestick shape to tell you if the market is experiencing strong fear, strong greed, or is neutral, and displays it clearly in a HUD.

CRAZY RAY RAY - Dashboard 1-5-15-1D + SMC + Clock + Candles PRO OANDA:XAUUSD This script is essentially your institutional "nuclear power plant" for scalping and swing trading: it combines the 1-5-15-1D dashboard, SMC, PRO candles, money flow times, institutional filters, Bull/Bear 12C, Liquidity HUD, Fibo Move, and Target Trend with SL + 3 TPs into a single indicator. 1. Dashboard 1–5–15–1D (Central HUD)
Calculates across 4 timeframes: 1m, 5m, 15m, and 1D:
Trend with EMAs 15/30/200.
RSI (strength >50 buy, <50 sell).
MACD (crossover in favor or against).
For each timeframe it shows:
TREND → BULLISH / BEARISH / NEUTRAL.
ACTION → BUY / SELL / WAIT.
If all 4 timeframes align:
MODE = BULLISH BUY
MODE = BEARISH SELL
Filters and displays on the HUD if buys or sells are blocked by SMC context (BLOCKED BUY / BLOCKED SELL).
Also draws 2 simple moving averages on the chart:
SMA 20 white (you can use it as a micro-trend).
SMA 200 red (macro trend and institutional reference).
2. Real-Time Clock + Trading Hours
Calculates the real time for:
New York / Miami
London
Tokyo
using current time and real time zone.
Also calculates GMT time to know which session is dominant.
Marks your trading hours:
LONDON 3:00–5:30 (London time) → goodLondon
NY OPEN 8:30–10:00 (NY time) → goodNYOpen
ASIA 20:00–23:00 (Tokyo) → goodAsiaScalp
Displays a message on the HUD:
LONDON 3:00–5:30 (1–2 TRADES)
NY OPEN 8:30–10:00 (1 TRADE)
ASIA 20–23 (SCALP)
NO TRADE ROLL / DEAD / LATE
ONLY A+ SETUPS (when not in strong trading hours).
3. Institutional Power (volume + ATR + session)
Filter that evaluates whether the moment is institutional or retail:
Checks:
If you are in a strong trading session (London / NY). If the volume is above the average × multiplier.
If the ATR is above the average × multiplier.
If it passes the filters → INST ON, otherwise → RETAIL ZONE.
Used internally to block buys/sells and for the HUD.
4. Micro-signal “NO RETRACEMENT” on 1m (BUY SR / SELL SR)
On the 1-minute timeframe, it detects a very aggressive entry:
Clean trend (15/30/200 EMAs aligned).
Price crosses the 200 EMA.
MACD turns in favor.
Marks on the candle:
BUY SR (buys without retracement below the EMA200).
SELL SR (sales without retracement above the EMA200).
This state is also reflected in the HUD as the “SR” row.
5. SMC Block: HH/HL/LH/LL + BMS + ChoCH + Fibo + Zones
This is the SMC brain of the script:
Detects swings with pivots:
Paints HH, HL, LH, LL (if you activate showHHLL).
Marks BOS (break of structure).
Marks BMS and ChoCH (with strong or weak filter using ATR, volume, MACD, gaps).
Draws:
Internal Fibo of the last range (38–50–61).
Fibo entry zone 38–78% as a green discount/premium box.
Institutional mitigation zones (simple OB type green/red boxes).
Current range with dotted yellow lines.
Calculates logic for:
antiStupidBuy: blocks purchases when the context is very bearish (LL–LL–LH, bearish ChoCH, premium, EQH, etc.).
antiStupidSell: symmetrical for sales.
From this comes:
allowBuyInst
allowSellInst
buyBlockerOn / sellBlockerOn
buyTrapDetected (BUY SR signal but context blocks it → BUY TRAP).
All this feeds the HUD and institutional alerts.
6. PRO Candles (candlestick + smart color)
Candlestick pattern system:
Detects:
Hammer, Inverted Hammer. Doji.
Strong bullish/bearish candle.
Bullish/bearish engulfing.
Uses a trend EMA to determine if the pattern is with or against the trend.
Colors the candles according to the pattern (if you enable useColorCandles).
Defines texts:
patternText (pattern name).
biasText (reversal, momentum, indecision).
Updates the HUD with the current pattern (“CANDLE: Engulf Bull”, etc.).
7. Institutional PRO Combo + Reversals
Connects everything:
fullBuySetup:
allowBuyInst TRUE (SMC + Fibo + mitigation OK).
Institutional candles in favor (engulfing, hammer, etc.).
MultiTF aligned (1m, 5m in favor, 15/1D not strongly against).
Strong session (London or NY).
No blockages.
fullSellSetup: the same for sales.
Marks on the chart:
BUY PRO, SELL PRO.
BUY REV LL → reversal from a LL, at Fibo discount, with an institutional candle and above EMA200.
SELL REV HH → reversal from HH, at Fibo premium, with an institutional candle and below EMA200.
And generates alerts for all of this.
8. Dynamic Main HUD
On barstate.islast, updates the HUD:
Changes “BUY / SELL” to:
BUY BLOCK / SELL BLOCK when the context blocks that direction.
Writes:
Current candle pattern.
Time message.
Global status:
BUY TRAP ❌, BUY REV LL ✅, SELL REV HH ✅, BUY PRO ✅, SELL PRO ✅,
BUY BLOCK, SELL BLOCK, BUY/SELL OK.
9. Bull/Bear 12C HUD (Small right HUD)
12-confirmation bull/bear engine:
Calculates:
Sweep, 5th leg, mitigation, HL/LH, strong BOS.
Volume pattern (high-low-high).
ATR rising.
MACD crossover.
Liquidity.
Fear & Greed (SMA50).
Gap/imbalance. Bull/Bear 180 weak.
Count how many are ON:
bullScore /12
bearScore /12
Define a regime:
INSTITUTIONAL → many confirmations + rvol + ATR.
NORMAL
RETAIL
Show on right HUD:
List 1 to 12 with green/red dots BULL / BEAR.
Summary: “Regime: INSTITUTIONAL / NORMAL / RETAIL”.
10. Liquidity HUD XAU SCALP
Calculates RVOL, normalized ATR, spread vs ATR, current range vs average range.
Generates score and classifies:
LOW / MED / HIGH / INS.
Only moves up one level if you are in London/NY session (depending on sessions)
