HighLowBox+220MAs[libHTF]HighLowBox+220MAs
This is a sample script of libHTF to use HTF values without request.security().
import nazomobile/libHTFwoRS/1
HTF candles are calculated internally using 'GMT+3' from current TF candles by libHTF .
To calcurate Higher TF candles, please display many past bars at first.
The advantage and disadvantage is that the data can be generated at the current TF granularity.
Although the signal can be displayed more sensitively, plots such as MAs are not smooth.
In this script, assigned ➊,➋,➌,➍ for htf1,htf2,htf3,htf4.
HTF candles
Draw candles for HTF1-4 on the right edge of the chart. 2 candles for each HTF.
They are updated with every current TF bar update.
Left edge of HTF candles is located at the x-postion latest bar_index + offset.
DMI HTF
ADX/+DI/DI arrows(8lines) are shown each timeframes range.
Current TF's is located at left side of the HighLowBox.
HTF's are located at HighLowBox of HTF candles.
The top of HighLowBox is 100, The bottom of HighLowBox is 0.
HighLowBox HTF
Enclose in a square high and low range in each timeframe.
Shows price range and duration of each box.
In current timeframe, shows Fibonacci Scale inside(23.6%, 38.2%, 50.0%, 61.8%, 76.4%)/outside of each box.
Outside(161.8%,261.8,361.8%) would be shown as next target, if break top/bottom of each box.
In HTF, shows Fibonacci Level of the current price at latest box only.
Boxes:
1 for current timeframe.
4 for higher timeframes.(Steps of timeframe: 5, 15, 60, 240, D, W, M, 3M, 6M, Y)
HighLowBox TrendLine
Draw TrendLine for each HighLow Range. TrendLine is drawn between high and return high(or low and return low) of each HighLowBox.
Style of TrendLine is same as each HighLowBox.
HighLowBox RSI
RSI Signals are shown at the bottom(RSI<=30) or the top(RSI>=70) of HighLowBox in each timeframe.
RSI Signal is color coded by RSI9 and RSI14 in each timeframe.(current TF: ●, HTF1-4: ➊➋➌➍)
In case of RSI<=30, Location: bottom of the HighLowBox
white: only RSI9 is <=30
aqua: RSI9&RSI14; <=30 and RSI9RSI14
green: only RSI14 <=30
In case of RSI>=70, Location: top of the HighLowBox
white: only RSI9 is >=70
yellow: RSI9&RSI14; >=70 and RSI9>RSI14
orange: RSI9&RSI14; >=70 and RSI9=70
blue/green and orange/red could be a oversold/overbought sign.
20/200 MAs
Shows 20 and 200 MAs in each TFs(tfChart and 4 Higher).
TFs:
current TF
HTF1-4
MAs:
20SMA
20EMA
200SMA
200EMA
"200亿美元是多少人民币"に関するスクリプトを検索

Session Moving AveragesAdds EMAs and SMAs to chart using 8am-8pm EST values. Completely configurable in settings.
Some platforms allow users to configure what time frame they would like to view market data. One popular selection is 8am-8pm EST as 8am is when institutional orders go through. An argument can be made that price action before 8am EST is not valid yet moving averages will use that data.
This matters less for shorter moving averages such as a 9 or 20 ema, but it dramatically changes the 200 or the 50 sma for example.
This script allows you to ignore that pre-market data (or any data you choose to configure in the settings) and select up to 3 moving averages (either Exponential or Simple) for a set time.
By default the moving averages include the 9-ema (gray), 20-ema (green), and 200-sma (purple) and is set to 8am-8pm EST
This is configurable in the settings including the time frame you would like the moving averages to start using market data.
By default the script will use your charts timeframe. You are able to use multi-time frames with this script just scroll down to "timeframe", then click "chart" in settings... this will then allow you to select a timeframe.
A popular choice is 5-minute value of 8am-8pm EST moving averages. This means regardless of the time frame you are on (sub 1-minute, 1-minute, etc.) the script will display 5-minute data.
Final note: In settings you are able to turn on/off shapes (the gray lines at the bottom) which shows when the data is being used. This can be helpful on certain tickers that trade continuously such as /ES or /NQ.

Ahsan Tufail Precise MA Crossover Filter for Reliable SignalsIntroduction:
In the ever-evolving world of Forex trading, strategies that provide a competitive edge are highly sought after. The Moving Average (MA) crossover technique is a popular long-term approach, but its vulnerability to false signals can lead to potential losses. To overcome this challenge, we introduce a game-changing MA crossover filter designed to weed out false signals and unlock the full potential of this strategy. In this article, we delve into the mechanics of this filter, providing a comprehensive analysis of its components and how it enhances the accuracy of buy and sell signals.
The Power of the MA Crossover Filter:
The essence of our MA crossover filter lies in the integration of a specialized indicator that operates on a scale of 0 to 100. This ingenious indicator dynamically measures the distance between the middle Bollinger band and either the upper or lower Bollinger band. By analyzing the values of the last 504 candlesticks, it maps the range from 50 to 100 for the largest and smallest distances between the middle and upper Bollinger bands. Similarly, for values ranging from 0 to 50, it measures the distance between the middle and lower Bollinger bands.
Unveiling the Signal Execution Process:
The brilliance of this filter is revealed in its meticulous execution of buy and sell signals, which significantly reduces false crossovers. Let's explore the process step-by-step:
Buy Signal Precision:
To initiate a buy signal, the price must be positioned above the 200-period Simple Moving Average (SMA).
The filter validates the crossover by checking the indicator's value, ensuring it falls below the threshold of 25.
Sell Signal Accuracy:
For a sell signal, the price must be below the 200-period Simple Moving Average (SMA).
The filter confirms the crossover by verifying the indicator's value, which should exceed the threshold of 75.
This selective approach ensures that only high-confidence crossovers are considered, maximizing the potential for profitable trades.
Fine-Tuning the Filter for Optimal Performance:
While the MA crossover filter exhibits its prowess in GBPUSD and EURUSD currency pairs, it may require adjustments for other pairs. Currency pairs possess unique characteristics, and adapting the filter to specific behavior is crucial for its success.
To fine-tune the filter for alternative currency pairs, traders should conduct rigorous backtesting and analyze historical price data. By experimenting with indicator threshold values, traders can calibrate the filter to accurately match the dynamics of the target currency pair. This iterative process allows for customization, ultimately resulting in a finely-tuned filter that aligns with the unique behavior of the selected market.
Conclusion:
The MA crossover filter represents a paradigm shift in long-term Forex trading strategies. By intelligently filtering false signals, this precision tool unleashes the true potential of the MA crossover technique, elevating its profitability and enhancing overall trading performance. While no strategy guarantees absolute success, incorporating this filter empowers traders with a heightened level of confidence in their buy and sell signals. Embracing the power of this innovative filter can be a transformative step towards mastering Forex profits and staying ahead in the dynamic world of currency trading.

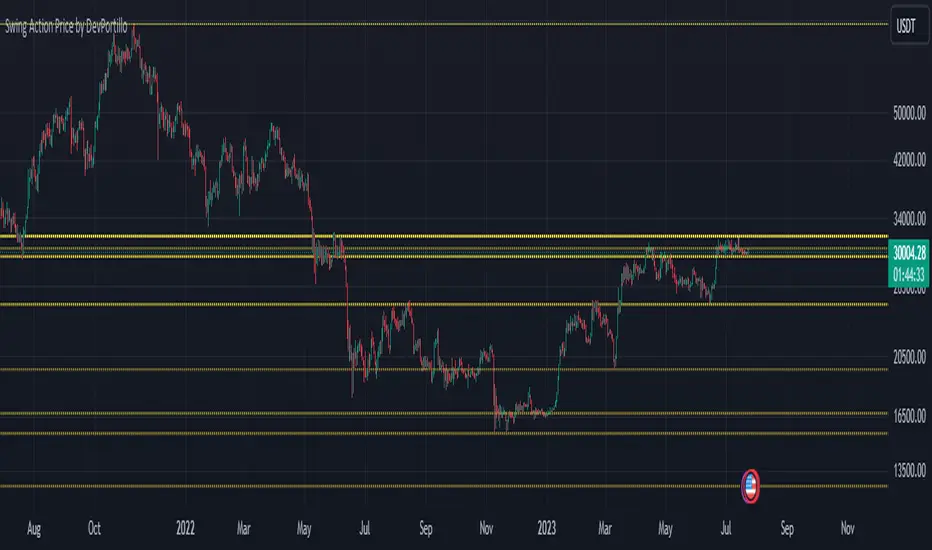
Swing Action PriceEnglish:
**Description of "Swing Action Price" TradingView Script**
"Swing Action Price" is a custom technical indicator designed to identify swing highs and swing lows in a financial market. The script calculates and plots various lines on the chart to visualize these swing points. Swing highs are points where the price has made a local peak, while swing lows are points where the price has made a local trough.
The indicator displays the following lines on the chart:
1. Dotted lines representing each individual swing high and swing low identified on different timeframes (10, 30, 60, 100, 150, 200, 700, and 1000 bars).
2. Dotted lines representing the most recent swing high and swing low for the current bar.
How the indicator works:
1. The script uses historical price data to calculate swing highs and swing lows based on specific conditions.
2. For each of the mentioned timeframes, the indicator identifies the highest high and lowest low within a defined number of bars (10, 30, 60, etc.).
3. Once a new swing high or swing low is identified, the corresponding dotted lines are drawn on the chart, extending from the previous swing point to the current one.
The "Swing Action Price" indicator can be used by traders to visually identify key support and resistance levels in the market. It helps them recognize potential trend reversals or continuation points, which may be valuable for making trading decisions.
Please note that trading indicators should always be used in conjunction with other technical and fundamental analysis tools to make informed trading choices. The "Swing Action Price" indicator is offered under the Mozilla Public License 2.0, and the developer's username is "damianjorgeportillo."
Remember that past performance is not indicative of future results, and it's essential to exercise caution and apply risk management strategies when trading financial markets.
/******************************/
Spanish:
**Descripción del Script "Swing Action Price" en TradingView**
"Swing Action Price" es un indicador técnico personalizado diseñado para identificar máximos y mínimos en un mercado financiero. El script calcula y muestra diversas líneas en el gráfico para visualizar estos puntos de inflexión. Los máximos se producen cuando el precio alcanza un pico local, mientras que los mínimos ocurren cuando el precio alcanza un valle local.
El indicador muestra las siguientes líneas en el gráfico:
1. Líneas punteadas que representan cada máximo y mínimo individual identificado en diferentes marcos de tiempo (10, 30, 60, 100, 150, 200, 700 y 1000 barras).
2. Líneas punteadas que representan el máximo y mínimo más reciente para la barra actual.
Cómo funciona el indicador:
1. El script utiliza datos históricos de precios para calcular los máximos y mínimos en función de ciertas condiciones.
2. Para cada uno de los marcos de tiempo mencionados, el indicador identifica el máximo más alto y el mínimo más bajo dentro de un número específico de barras (10, 30, 60, etc.).
3. Una vez que se identifica un nuevo máximo o mínimo, se dibujan las líneas punteadas correspondientes en el gráfico, extendiéndose desde el punto de inflexión anterior hasta el actual.
El indicador "Swing Action Price" puede ser utilizado por traders para identificar visualmente niveles clave de soporte y resistencia en el mercado. Ayuda a reconocer posibles puntos de inversión o continuación de tendencia, lo que puede ser valioso para tomar decisiones comerciales.
Por favor, ten en cuenta que los indicadores de trading siempre deben utilizarse junto con otras herramientas de análisis técnico y fundamental para tomar decisiones comerciales informadas. El indicador "Swing Action Price" se ofrece bajo la Licencia Pública de Mozilla 2.0, y el nombre de usuario del desarrollador es "damianjorgeportillo".
Recuerda que el rendimiento pasado no garantiza resultados futuros, y es esencial ser cauteloso y aplicar estrategias de gestión de riesgos al operar en los mercados financieros.
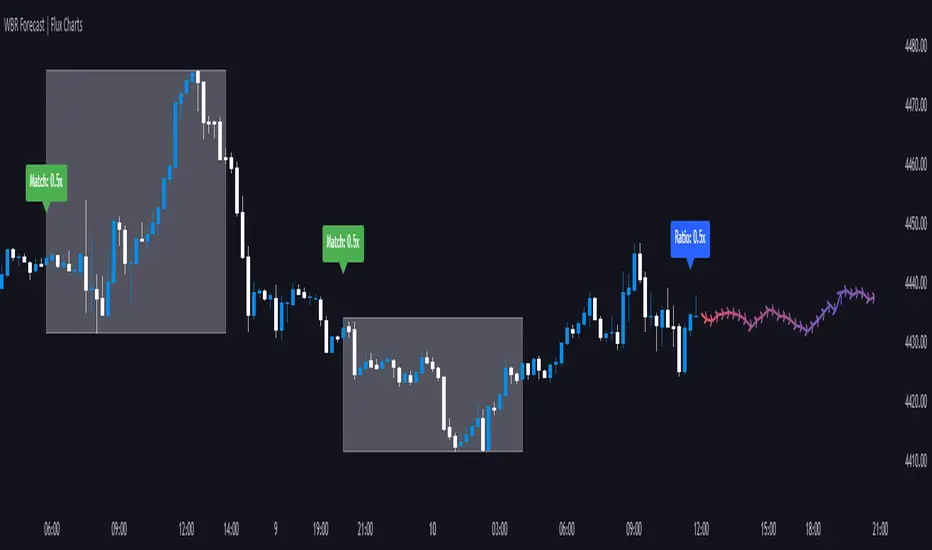
Wick-to-Body Ratio Trend Forecast | Flux ChartsThe Wick-to-Body Ratio Trend Forecast Indicator aims to forecast potential movements following the last closed candle using the wick-to-body ratio. The script identifies those candles within the loopback period with a ratio matching that of the last closed candle and provides an analysis of their trends.
➡️ USAGE
Wick-to-body ratios can be used in many strategies. The most common use in stock trading is to discern bullish or bearish sentiment. This indicator extends candle ratios, revealing previous patterns that follow a candle with a similar ratio. The most basic use of this indicator is the single forecast line.
➡️ FORECASTING SYSTEM
This line displays a compilation of the averages of all the previous trends resulting from those historical candles with a matching ratio. It shows the average movements of the trends as well as the 'strength' of the trend. The 'strength' of the trend is a gradient that is blue when the trend deviates more from the average and red when it deviates less.
Chart: AMEX:SPY 30 min; Indicator Settings: Loopback 700, Previous Trends ON
The color-coded deviation is visible in this image of the indicator with the default settings (except for Forecast Lines > Previous Trends ), and the trend line grows bluer as the past patterns deviate more.
➡️ ADAPTIVE ACCEPTABLE RANGE
The algorithm looks back at every candle within the loopback period to find candles that match the last closed candle. The algorithm adaptively changes the acceptable range to which a candle can differ from the ratio of the last closed candle. The algorithm will never have more than 15 historical points used, as it will lower its sensitivity before it reaches that point.
Chart: BITSTAMP:BTCUSD 5 min; Indicator Settings: Loopback 700
Here is the BTC chart on 7/6/23 with default settings except for the loopback period at 700.
Chart: BITSTAMP:BTCUSD 5 min; Indicator Settings: Loopback 200
Here is the exact same chart with a loopback period of 200. While the first ratio for both is the same, a new ratio is revealed for the chart with a loopback of only 200 because the adaptive range is adjusted in the algorithm to find an acceptable number of reference points. Note the table in the top right however, while the algorithm adapts the acceptable range between the current ratio and historical ones to find reference points, there is a threshold at which candles will be considered too inaccurate to be considered. This prevents meaningless associations between candles due to a particularly rare ratio. This threshold can be adjusted in the settings through "Default Accuracy".
Developing Market Profile / TPO [Honestcowboy]The Developing Market Profile Indicator aims to broaden the horizon of Market Profile / TPO research and trading. While standard Market Profiles aim is to show where PRICE is in relation to TIME on a previous session (usually a day). Developing Market Profile will change bar by bar and display PRICE in relation to TIME for a user specified number of past bars.
What is a market profile?
"Market Profile is an intra-day charting technique (price vertical, time/activity horizontal) devised by J. Peter Steidlmayer. Steidlmayer was seeking a way to determine and to evaluate market value as it developed in the day time frame. The concept was to display price on a vertical axis against time on the horizontal, and the ensuing graphic generally is a bell shape--fatter at the middle prices, with activity trailing off and volume diminished at the extreme higher and lower prices."
For education on market profiles I recommend you search the net and study some profitable traders who use it.
Key Differences
Does not have a value area but distinguishes each column in relation to the biggest column in percentage terms.
Updates bar by bar
Does not take sessions into account
Shows historical values for each bar
While there is an entire education system build around Market Profiles they usually focus on a daily profile and in some cases how the value area develops during the day (there are indicators showing the developing value area).
The idea of trading based on a developing value area is what inspired me to build the Developing Market Profile.
🟦 CALCULATION
Think of this Developing Market Profile the same way as you would think of a moving average. On each bar it will lookback 200 bars (or as user specified) and calculate a Market Profile from those bars (range).
🔹Market Profile gets calculated using these steps:
Get the highest high and lowest low of the price range.
Separate that range into user specified amount of price zones (all spaced evenly)
Loop through the ranges bars and on each bar check in which price zones price was, then add +1 to the zones price was in (we do this using the OccurenceArray)
After it looped through all bars in the range it will draw columns for each price zone (using boxes) and make them as wide as the OccurenceArray dictates in number of bars
🔹Coloring each column:
The script will find the biggest column in the Profile and use that as a reference for all other columns. It will then decide for each column individually how big it is in % compared to the biggest column. It will use that percentage to decide which color to give it, top 20% will be red, top 40% purple, top 60% blue, top 80% green and all the rest yellow. The user is able to adjust these numbers for further customisation.
The historical display of the profiles uses plotchar() and will not only use the color of the column at that time but the % rating will also decide transparancy for further detail when analysing how the profiles developed over time. Each of those historical profiles is calculated using its own 200 past bars. This makes the script very heavy and that is why it includes optimisation settings, more info below.
🟦 USAGE
My general idea of the markets is that they are ever changing and that in studying that changing behaviour a good trader is able to distinguish new behaviour from old behaviour and adapt his approach before losing traders "weak hands" do.
A Market Profile can visually show a trader what kind of market environment we currently are in. In training this visual feedback helps traders remember past market environments and how the market behaved during these times.
Use the history shown using plotchars in colors to get an idea of how the Market Profile looked at each bar of the chart.
This history will help in studying how price moves at different stages of the Market Profile development.
I'm in no way an expert in trading Market Profiles so take this information with a grain of salt. Below an idea of how I would trade using this indicator:
🟦 SETTINGS
🔹MARKET PROFILING
Lookback: The amount of bars the Market Profile will look in the past to calculate where price has been the most in that range
Resolution: This is the amount of columns the Market Profile will have. These columns are calculated using the highest and lowest point price has been for the lookback period
Resolution is limited to a maximum of 32 because of pinescript plotting limits (64). Each plotchar() because of using variable colors takes up 2 of these slots
🔹VISUAL SETTINGS
Profile Distance From Chart: The amount of bars the market profile will be offset from the current bar
Border width (MP): The line thickness of the Market Profile column borders
Character: This is the character the history will use to show past profiles, default is a square.
Color theme: You can pick 5 colors from biggest column of the Profile to smallest column of the profile.
Numbers: these are for % to decide column color. So on default top 20% will be red, top 40% purple... Always use these in descending order
Show Market Profile: This setting will enable/disable the current Market Profile (columns on right side of current bar)
Show Profile History: This setting will enable/disable the Profile History which are the colored characters you see on each bar
🔹OPTIMISATION AND DEBUGGING
Calculate from here: The Market Profile will only start to calculate bar by bar from this point. Setting is needed to optimise loading time and quite frankly without it the script would probably exceed tradingview loading time limits.
Min Size: This setting is there to avoid visual bugs in the script. Scaling the chart there can be issues where the Market Profile extends all the way to 0. To avoid this use a minimum size bigger than the bugged bottom box

REVE Cohorts - Range Extension Volume Expansion CohortsREVE Cohorts stands for Range Extensions Volume Expansions Cohorts.
Volume is divided in four cohorts, these are depicted in the middle band with colors and histogram spikes.
0-80 percent i.e. low volumes; these get a green color and a narrow histogram bar
80-120 percent, normal volumes, these get a blue color and a narrow histogram bar
120-200 percent, high volume, these get an orange color and a wide histogram bar
200 and more percent is extreme volume, maroon color and wide bar.
All histogram bars have the same length. They point to the exact candle where the volume occurs.
Range is divided in two cohorts, these are depicted as candles above and below the middle band.
0-120 percent: small and normal range, depicted as single size, square candles
120 percent and more, wide range depicted as double size, rectangular candles.
The range candles are placed and colored according to the Advanced Price Algorithm (published script). If the trend is up, the candles are in the uptrend area, which is above the volume band, , downtrend candles below in the downtrend area. Dark blue candles depict a price movement which confirms the uptrend, these are of course in the uptrend area. In this area are also light red candles with a blue border, these depict a faltering price movement countering the uptrend. In the downtrend area, which is below the volume band, are red candles which depict a price movement confirming the downtrend and light blue candles with a red border depicting price movement countering the downtrend. A trend in the Advanced Price Algorithm is in equal to the direction of a simple moving average with the same lookback. The indicator has the same lagging.as this SMA.
Signals are placed in the vacated spaces, e.g. during an uptrend the downtrend area is vacated.
There are six signals, which arise as follows:
1 Two blue triangles up on top of each other: high or extreme volume in combination with wide range confirming uptrend. This indicates strong and effective up pressure in uptrend
2 Two pink tringles down on top of each other: high or extreme volume in combination with wide range down confirming downtrend. This indicates strong and effective down pressure in downtrend
3 Blue square above pink down triangle down: extreme volume in combination with wide range countering uptrend. This indicates a change of heart, down trend is imminent, e.g. during a reversal pattern. Down Pressure in uptrend
4 Pink square below blue triangle up: extreme volume in combination with wide range countering downtrend. This indicates a change of heart, reversal to uptrend is imminent. Up Pressure in downtrend
5 single blue square: a. extreme volume in combination with small range confirming uptrend, b. extreme volume in combination with small range countering downtrend, c. high volume in combination with wide range countering uptrend. This indicates halting upward price movement, occurs often at tops or during distribution periods. Unresolved pressure in uptrend
6 Single pink square: a extreme volume in combination with small range confirming downtrend, b extreme volume in combination with small range countering uptrend, c high volume in combination with wide range countering downtrend. This indicated halting downward price movement. Occurs often at bottoms or during accumulation periods. Unresolved pressure in downtrend.
The signals 5 and 6 are introduced to prevent flipping of signals into their opposite when the lookback is changed. Now signals may only change from unresolved in directional or vice versa. Signals 3 and 4 were introduced to make sure that all occurrences of extreme volume will result in a signal. Occurrences of wide volume only partly lead to a signal.
Use of REVE Cohorts.
This is the indicator for volume-range analyses that I always wanted to have. Now that I managed to create it, I put it in all my charts, it is often the first part I look at, In my momentum investment system I use it primarily in the layout for following open positions. It helps me a lot to decide whether to close or hold a position. The advantage over my previous attempts to create a REVE indicator (published scripts), is that this version is concise because it reports and classifies all possible volumes and ranges, you see periods of drying out of volume, sequences of falter candles, occurrences of high morning volume, warning and confirming signals.. The assessment by script whether some volume should be considered low, normal, high or extreme gives an edge over using the standard volume bars.
Settings of REVE Cohorts
The default setting for lookback is ‘script sets lookback’ I put this in my indicators because I want them harmonized, the script sets lookback according to timeframe. The tooltip informs which lookback will be set at which timeframe, you can enable a feedback label to show the current lookback. If you switch ‘script sets lookback’ off, you can set your own preferred user lookback. The script self-adapts its settings in such a way that it will show up from the very first bar of historical chart data, it adds volume starting at the fourth bar.
You can switch off volume cohorts, only range candles will show while the middle band disappears. Signals will remain if volume is present in the data. Some Instruments have no volume data, e.g. SPX-S&P 500 Index,, then only range candles will be shown.
Colors can be adapted in the inputs. Because the script calculates matching colors with more transparency it is advised to use 100 percent opacity in these settings.
Take care, Eykpunter

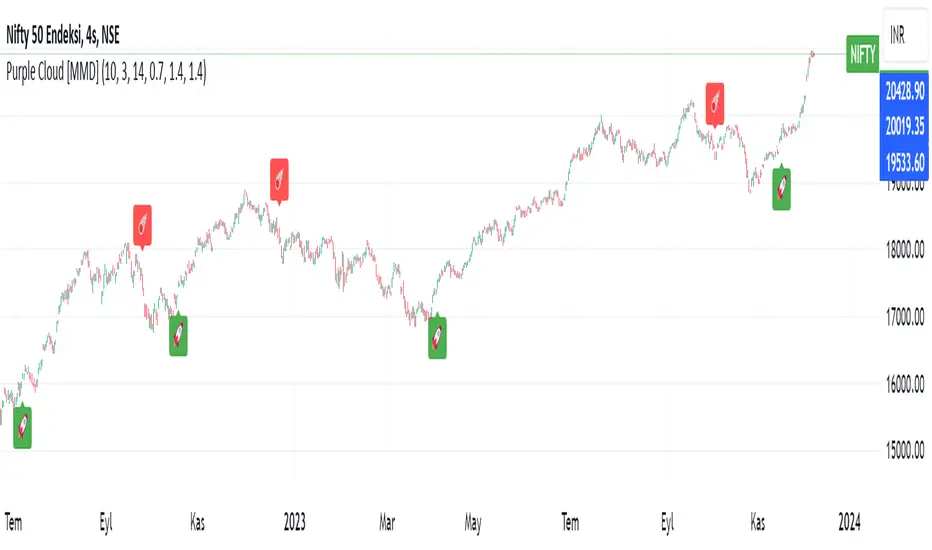
Purple CloudThe above lines calculate several intermediate values used in the indicator's calculations. Here's a breakdown of each variable:
a1: Represents a modified Exponential Moving Average (EMA) of the high price series, subtracted by a Simple Moving Average (SMA) of the low price series.
a2: Takes the square root of the lowest value between the highest close price over the last 200 bars and the current close price, multiplied by a1.
b1: Represents a modified EMA of the low price series, subtracted by an SMA of the high price series.
b2: Takes the square root of the highest value between the lowest close price over the last 200 bars and the current close price, multiplied by b1.
c1: Represents the square root of a2 multiplied by b2.
These lines create multiple plots using the plot function. Each plot represents a displaced version of c1 by a certain multiple of the Average True Range (ATR) multiplied by a constant factor (0.1, 0.2, 0.3, etc.). The transparency (transp) is set to 100 for all plots.
Buying/Selling Pressure Cycle (PreCy)No lag estimation of the buying/selling pressure for each candle.
----------------------------------------------------------------------------------------------------
WHY PreCY?
How much bearish pressure is there behind a group of bullish candles ?
Is this bearish pressure increasing?
When might it overcome the bullish pressure?
Those were my questions when I started this indicator. It lead me through the rabbit hole, where I discovered some secrets about the market. So I pushed deeper, and developped it a lot more, in order to understand what is really happening "behind the scene".
There are now 3 ways to read this indicator. It might look complicated at first, but the reward is to be able to anticipate and understand a lot more.
You can show/hide all the plots in the settings. So you can choose the way you prefer to use it.
----------------------------------------------------------------------------------------------------
FIRST WAY TO READ PreCy : The SIGNAL line
Go in the settings of PreCy, in "DISPLAY", uncheck "The pivot lines of the SIGNAL" and "The CYCLE areas". Make sure "The SIGNAL line" is checked.
The SIGNAL shows an estimation of the buying/selling pressure of each candle, going from 100 (100% bullish candle) to -100 (100% bearish candle). A doji would be shown close to zero.
Formula: Estimated % of buying pressure - Estimated % of selling pressure
It is a very choppy line in general, but its colors help make sense of it.
When this choppiness alternates between the extremes, then there is not much pressure on each candle, and it's very unpredictable.
When the pressure increases, the SIGNAL's amplitude changes. It "compresses", meaning there is some interest in the market. It can compress by alternating above and below zero, or it can stay above zero (bullish), or below zero (bearish) for a while.
When the SIGNAL becomes linear (in opposition to choppy), there is a lot of pressure, and it is directional. The participants agree for a move in a chosen direction.
The trajectory of the SIGNAL can help anticipate when a move is going to happen (directional increase of pressure), or stop (returning to zero) and possibly reverse (crossing zero).
Advanced uses:
The SIGNAL can make more sense on a specific timeframe, that would be aligned with the frequency of the orders at that moment. So it is a good idea to switch between timeframes until it gets less choppy, and more directional.
It is interesting to follow any regular progression of the SIGNAL, as it can reveal the intentions of the market makers to go in a certain direction discretely. There can be almost no volume and no move in the price action, yet the SIGNAL gets linear and moves away from one extreme, slowly crosses the zeroline, and pushes to the other extreme at the same time as the amplitude of the price action increases drastically.
----------------------------------------------------------------------------------------------------
SECOND WAY TO READ PreCy : The PIVOTS of the SIGNAL line
Go in the settings of PreCy, in "DISPLAY", and uncheck "The CYCLE areas". Make sure "The SIGNAL line" and "The pivot lines of the SIGNAL" are checked.
The PIVOTS help make sense of the apparent chaos of the SIGNAL. They can reveal the overall direction of the choppy moves.
Especially when the 2 PIVOTS lines are parallel and oriented.
----------------------------------------------------------------------------------------------------
THIRD WAY TO READ PreCy : The CYCLE
Go in the settings of PreCy, in "DISPLAY", and uncheck "The SIGNAL line" and "The pivot lines of the SIGNAL". Make sure "The CYCLE areas" is checked.
The CYCLE is a Moving Average of the SIGNAL in relation to each candle's size.
Formula: 6 periods Moving Average of the SIGNAL * (body of the current candle / 200 periods Moving Average of the candle's bodies)
The result goes from 200 to -200.
The CYCLE shows longer term indications of the pressures of the market.
Analysing the trajectory of the CYCLE can help predict the direction of the price.
When the CYCLE goes above or below the gray low intensity zone, it signals some interest in the move.
When the CYCLE stays above 100 or below -100, it is a sign of strength in the move.
When it stayed out of the gray low intensity zone, then returns inside it, it is a strong signal of a probable change of behavior.
----------------------------------------------------------------------------------------------------
ALERTS
In the settings, you can pick the alerts you're interested in.
To activate them, right click on the chart (or alt+a), choose "Add alert on Buying/Selling Pressure Cycle (PreCy)" then "Any alert()", then "Create".
Feel free to activate them on different timeframes. The alerts show which timeframe they are from (ex: "TF:15" for the 15 minutes TF).
I have added a lot more conditions to my PreCy, taken from FREMA Trend, for ex. You can do the same with your favorite scripts, to make PreCy more accurate for your style.
----------------------------------------------------------------------------------------------------
Borrowed scripts:
To estimate the buying and selling pressures, PreCy uses the wicks calculations of "Volume net histogram" by RafaelZioni
To filter the alerts, PreCy uses the calculations of "Amplitude" by Koholintian:
----------------------------------------------------------------------------------------------------
DO NOT BASE YOUR TRADING DECISIONS ON 1 SINGLE INDICATOR'S SIGNALS.
Always confirm your ideas by other means, like price action and indicators of a different nature.

JS-TechTrading: Supertrend-Strategy_Basic versionAre you looking for a reliable and profitable algorithmic trading strategy for TradingView? If so, you might be interested in our Supertrend basic strategy, which is based on three powerful indicators: Supertrend (ATR), RSI and EMA.
Supertrend is a trend-following indicator that helps you identify the direction and strength of the market. It also gives you clear signals for entry and exit points based on price movements.
RSI is a momentum indicator that measures the speed and change of price movements. It helps you filter out false signals and avoid overbought or oversold conditions.
EMA is a moving average indicator that smooths out price fluctuations and shows you the long-term trend of the market. It helps you confirm the validity of your trades and avoid trading against the trend.
Our Supertrend basic strategy combines these three indicators to give you a simple yet effective way to trade any market. Here's how it works:
- For long trades, you enter when the price is above Supertrend and pulls back below it (the low of the candle crosses Supertrend) and then rebounds above it (the high of the next candle goes above the pullback candle). You exit when the price closes below Supertrend or when you reach your target profit or stop loss.
- For short trades, you enter when the price is below Supertrend and pulls back above it (the high of the candle crosses Supertrend) and then drops below it (the low of the next candle goes below the pullback candle). You exit when the price closes above Supertrend or when you reach your target profit or stop loss.
- You can also use RSI and EMA filters to improve your results. For long trades, you only enter if RSI is above 50 and price is above 200 EMA. For short trades, you only enter if RSI is below 50 and price is below 200 EMA.
- You can set your stop loss and target profit as a percentage of your entry price or based on other criteria. You can also adjust the parameters of each indicator according to your preferences and risk tolerance.
Our Supertrend basic strategy is easy to use and has been tested on various markets and time frames. It can help you capture consistent profits while minimizing your losses.

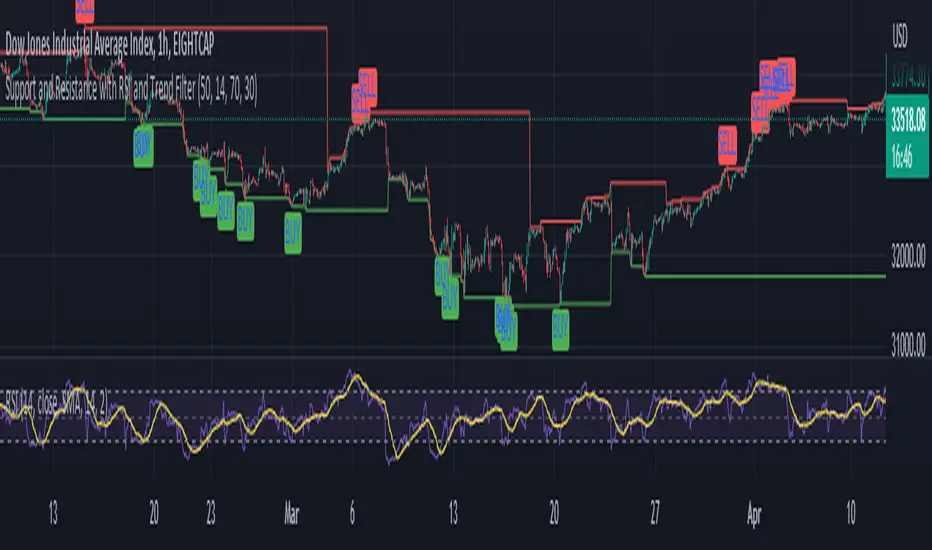
S & R RSi stratIn this updated version, a trend filter is applied using the Simple Moving Average (SMA) on the 4-hour timeframe. The trend is considered up when the 50-period SMA is below the 200-period SMA (ta.sma(trendFilterSource, 50) < ta.sma(trendFilterSource, 200)).
The buy condition (buyCondition) is triggered when the RSI crosses above the oversold threshold (ta.crossover(rsi, oversoldThreshold)), the trend filter confirms an uptrend (isUptrend is true), and the close price is greater than or equal to the support level (close >= supportLevel).
The sell condition (sellCondition) is triggered when the RSI crosses below the overbought threshold (ta.crossunder(rsi, overboughtThreshold)), the trend filter confirms a downtrend (isUptrend is false), and the close price is less than or equal to the resistance level (close <= resistanceLevel).
With this implementation, the signals will only be generated in the direction of the trend on the 4-hour timeframe.
NOMMO AUTOMATE🖖 Hi all!
Check out my NOMMO AUTOMATE indicator for trend detection, trend change points, hedging opposite trend impulses.
What the script do:
☑️ Detecting local and global trends and trend change points, detecting opposite to current trend impulses.
How the script do it:
☑️ The indicator compares RSI indicators on chosen by user Trend TF1 and Trend TF2 and marks trend change points.
☑️ The indicator compares different length HMA indicators on chosen by user Hedge TF to detect opposite to current trend impulses.
How to use it:
☑️ There are 4 states in the indicator: Long, Short, Flat, Hedge, marked by corresponding (adjustable) color zones, where Long = uptrend, Short = downtrend, Flat = sideways movement, Hedge = possible impulse in the opposite trend direction.
☑️ Select Trend TF1 and Trend TF2 and RSI length to determine the trend, depending on how a big picture you want to see, the more major TF you choose the more global picture of the trend change you get.
☑️ Select Hedge TF to determine the possible impulses opposite to the current trend (does not work in detected Flat movement).
☑️ For each trading pair you need to try individual settings, the default settings I use for BTC swing trading, to reduce the noise level of hedging put Hedge TF the same as the smaller Trend TF.
☑️ Try different settings, experiment and you will find the most suitable settings for your trading pair.
How magic works:
☑️ RSI Trend TF1 > 50 + RSI Trend TF2 > 50 = Long
☑️ RSI Trend TF1 > 50 + RSI Trend TF2 < 50 = Flat
☑️ RSI Trend TF1 < 50 + RSI Trend TF2 > 50 = Flat
☑️ RSI Trend TF1 < 50 + RSI Trend TF2 < 50 = Short
☑️ Long + Hedge TF (HMA 10 < HMA 70 < HMA 200) = Hedge
☑️ Short + Hedge TF (HMA 10 > HMA 70 > HMA 200) = Hedge
For example:
☑️ Try Trend TF1 = 1D, Trend TF2 = 1D and Hedge TF = 1D, with RSI period = 21, to check mid-term trend on BTCUSD
May the trade force be with you.

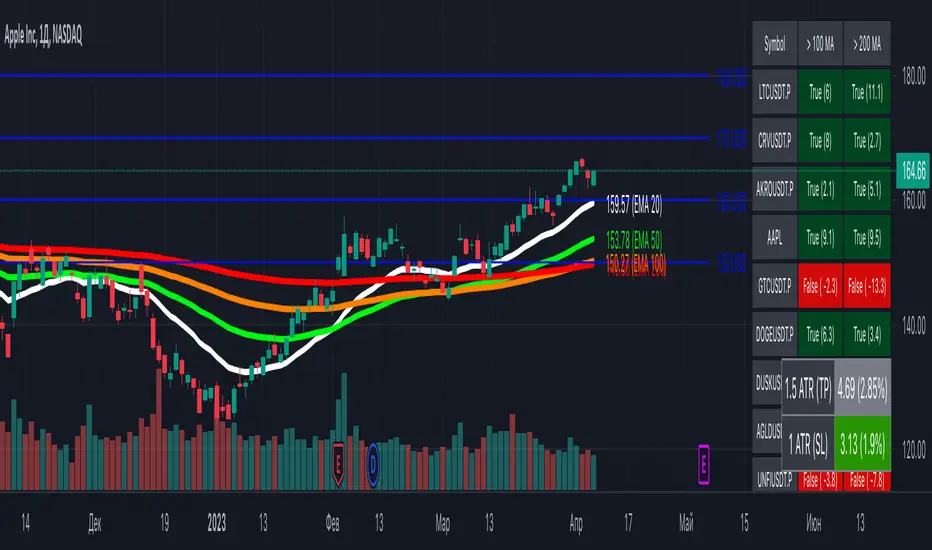
[MiV] MA Screener v1.0In my trading I stick to the following strategy: I buy an asset above the 100/200 moving average and then sell it.
The most problematic thing in all this is to look for assets that are above the 100 or 200 moving average, and to assess how "far" the price is from that moving average.
In fact, to solve this problem I created this indicator.
It works with 30 different assets and displays the state of its two moving averages, whether the price is higher or not, and how much higher the price is from that level.
*Backtesting System ⚉ OVERVIEW ⚉
One of the best Systems for Backtesting your Strategies.
Incredibly flexible, simple, fast and feature-rich system — will solve most of your queries without much effort.
Many systems for setting StopLoss, TakeProfit, Risk Management and advanced Filters.
All you need to do is plug in your indicator and start Backtesting .
I intentionally left the option to use my System on Full Power before you load your indicator into it.
The system uses the built-in simple and popular moving average crossover signal for this purpose. (EMA 50 & 200).
Also Highly Recommend that you Fully use ALL of the features of this system so that you understand how they work before you ask questions.
Also tried to leave TIPS for each feature everywhere, read Tips, activate them and see how they work.
But before you use this system, I Recommend you to read the following description in Full.
—————— How to connect your indicator in 2 steps:
Adapt your indicator by adding only 2 lines of code and then connect it to this Backtesting System.
Step 1 — Create your connector, For doing so:
• 1 — Find or create in your indicator where are the conditions printing the Long-Buy and Short-Sell signals.
• 2 — Create an additional plot as below
I'm giving an example with a Two moving averages cross.
Please replicate the same methodology for your indicator wether it's a MACD, RSI , Pivots, or whatever indicator with Clear Buy and Sell conditions.
//@version=5
indicator('Moving Average Cross', overlay = true)
MA200 = ta.𝚎𝚖𝚊(close, 200)
MA50 = ta.𝚎𝚖𝚊(close, 50)
// Generate Buy and Sell conditions
buy = ta.crossover (MA200, MA50)
sell = ta.crossunder (MA200, MA50)
plot(MA200, color=color.green)
plot(MA50 , color=color.red )
bgcolor(color = buy ? color.green : sell ? color.red : na, title='SIGNALS')
// ———————————————— SIGNAL FOR SYSTEM ————————————————
Signal = buy ? +1 : sell ? -1 : 0
plot(Signal, title='🔌Connector🔌', display = display.none)
// —————— 🔥 The Backtesting System expects the value to be exactly +1 for the 𝚋𝚞𝚕𝚕𝚒𝚜𝚑 signal, and -1 for the 𝚋𝚎𝚊𝚛𝚒𝚜𝚑 signal
Basically, I identified my Buy & Sell conditions in the code and added this at the bottom of my indicator code
Now you can connect your indicator to the Backtesting System using the Step 2
Step 2 — Connect the connector
• 1 — Add your updated indicator to a TradingView chart and Add the Backtesting System as well to the SAME chart
• 2 — Open the Backtesting System settings and in the External Source field select your 🔌Connector🔌 (which comes from your indicator)
_______________________________
⚉ MAIN SETTINGS ⚉
‾‾‾‾‾‾‾‾‾‾‾‾‾‾‾‾‾‾‾‾‾‾‾‾‾‾‾‾‾‾‾
𝐄𝐱𝐭𝐞𝐫𝐧𝐚𝐥 𝐒𝐨𝐮𝐫𝐜𝐞 — Select your indicator. Add your indicator by following the 2 steps described above and select it in the menu. To familiarize yourself with the system until you select your indicator, you will have an in-built strategy of crossing the two moving EMA's of 50 and 200.
Long Deals — Enable/Disable Long Deals.
Short Deals — Enable/Disable Short Deals.
Wait End Deal — Enable/Disable waiting for a trade to close at Stop Loss/Take Profit. Until the trade closes on the Stop Loss or Take Profit, no new trade will open.
Reverse Deals — To force the opening of a trade in the opposite direction.
ReEntry Deal — Automatically open the same new deal after the deal is closed.
ReOpen Deal — Reopen the trade if the same signal is received. For example, if you are already in the long and a new signal is received in the long, the trade will reopen. * Does not work if Wait End Deal is enabled.
𝐓𝐚𝐤𝐞 𝐏𝐫𝐨𝐟𝐢𝐭:
None — Disables take profit. Useful if you only want to use dynamic stoplosses such as MA, Fast-Trailing, ATR Trail.
FIXED % — Fixed take profit in percent.
FIXED $ — Fixed Take in Money.
ATR — Fixed Take based on ATR.
R:R — Fixed Take based on the size of your stop loss. For example, if your stop is 10% and R:R=1, then the Take would be 10%. R:R=3 Take would be 30%, etc.
HH / LL — Fixed Take based on the previous maximum/minimum (extremum).
𝐒𝐭𝐨𝐩 𝐋𝐨𝐬𝐬:
None — Disables Stop Loss. Useful if you want to work without a stop loss. *Be careful if Wait End Deal is enabled, the trade may not close for a long time until it reaches the Take.
FIXED % — Fixed Stop in percent.
FIXED $ — Fixed Stop in Money.
TRAILING — Dynamic Trailing Stop like on the stock exchanges.
FAST TRAIL — Dynamic Fast Trailing Stop moves immediately in profit and stays in place if the price stands still or the price moves in loss.
ATR — Fixed Stop based on the ATR.
ATR TRAIL — Dynamic Trailing Stop based on the ATR.
LO / HI — A Fixed Stop based on the last Maximum/Minimum extemum. Allows you to place a stop just behind or above the low/high candle.
MA — Dynamic Stop based on selected Moving Average. * You will have 8 types of MA (EMA, SMA, HMA, etc.) to choose from, but you can easily add dozens of other MAs, which makes this type of stop incredibly flexible.
Add % — If true, then with the "𝗦𝘁𝗼𝗽 %" parameter you can add percentages to any of the current SL. Can be especially useful when using Stop - 𝗔𝗧𝗥 or 𝗠𝗔 or 𝗟𝗢/𝗛𝗜. For example with 𝗟𝗢/𝗛𝗜 to put a stop for the last High/Low and add 0.5% additional Stoploss.
Fixed R:R — If the stop loss is Dynamic (Trailing or MA) then if R:R true can also be made Dynamic * Use it carefully, the function is experimental.
_________________________________________
⚉ TAKE PROFIT LEVELS ⚉
‾‾‾‾‾‾‾‾‾‾‾‾‾‾‾‾‾‾‾‾‾‾‾‾‾‾‾‾‾‾‾‾‾‾‾‾‾‾‾‾‾
A unique method of constructing intermediate Take Profit Levels will allow you to select up to 5 intermediate Take Profit Levels and one intermediate Stop Loss.
Intermediate Take Profit Levels are perfectly calculated into 5 equal parts in the form of levels from the entry point to the final Take Profit target.
All you need to do is to choose the necessary levels for fixing and how much you want to fix at each level as a percentage. For example, TP 3 will always be exactly between the entry point and the Take Profit target. And the value of TP 3 = 50 will close 50% of the amount of the remaining size of the position.
Note: all intermediate SL/TP are closed from the remaining position amount and not from the initial position size, as TV does by default.
SL 0 Position — works in the same way as TP 1-5 but it's Stop. With this parameter you can set the position where the intermediate stop will be set.
Breakeven on TP — When activated, it allows you to put the stop loss at Breakeven after the selected TP is reached. For this function to work as it should - you need to activate an intermediate Take. For example, if TP 3 is activated and Breakeven on TP = 3, then after the price reaches this level, the Stop loss will go to Breakeven.
* This function will not work with Dynamic Stoplosses, because it simply does not make sense.
CoolDown # Bars — When activated, allows you to add a delay before a new trade is opened. A new trade after CoolDown will not be opened until # bars pass and a new signal appears.
_____________________________
⚉ TIME FILTERS ⚉
‾‾‾‾‾‾‾‾‾‾‾‾‾‾‾‾‾‾‾‾‾‾‾‾‾‾‾‾‾
Powerful time filter code that allows you to filter data based on specific time zones, dates, and session days. This code is ideal for those who need to analyze data from different time zones and weed out irrelevant data.
With Time Filter, you can easily set the starting and ending time zones by which you want to filter the data.
You can also set a start and end date for your data and choose which days of the week to include in the analysis. In addition, you can specify start and end times for a specific session, allowing you to focus your analysis on specific time periods.
_________________________________
⚉ SIGNAL FILTERS ⚉
‾‾‾‾‾‾‾‾‾‾‾‾‾‾‾‾‾‾‾‾‾‾‾‾‾‾‾‾‾‾‾‾‾
Signal Filters — allows you to easily customize and optimize your trading strategies based on 10 filters.
Each filter is designed to help you weed out inaccurate signals to minimize your risks.
Let's take a look at their features:
__________________________________
⚉ RISK MANAGEMENT ⚉
‾‾‾‾‾‾‾‾‾‾‾‾‾‾‾‾‾‾‾‾‾‾‾‾‾‾‾‾‾‾‾‾‾‾
Risk management tools that allow you to set the maximum number of losing trades in a row, a limit on the number of trades per day or week and other filters.
Loss Streak — Set Max number of consecutive loss trades.
Win Streak — Max Winning Streak Length.
Row Loss InDay — Max of consecutive days with a loss in a row.
DrawDown % — Max DrawDown (in % of strategy equity).
InDay Loss % — Set Max Intraday Loss.
Daily Trades — Limit the number of MAX trades per day.
Weekly Trades — Limit the number of MAX trades per week.
* 🡅 I would Not Recommend using these functions without understanding how they work.
Order Size — Position Size
• NONE — Use the default position size settings in Tab "Properties".
• EQUITY — The amount of the allowed position as a percentage of the initial capital.
• Use Net Profit — On/Off the use of profit in the following trades. *Only works if the type is EQUITY.
• SIZE — The size of the allowed position in monetary terms.
• Contracts — The size of the allowed position in the contracts. 1 Сontract = Сurrent price.
________________
⚉ NOTES ⚉
‾‾‾‾‾‾‾‾‾‾‾‾‾‾‾‾
It is important to note that I have never worked with Backtesting and the functions associated with them before.
It took me about a month of slow work to build this system.
I want to say Big Thanks:
• The PineScripters🌲 group, the guys suggested how to implement some features. Especially @allanster
• Thanks to all those people who share their developments for free on TV and not only.
• I also thank myself for not giving up and finishing the project, and not trying to monetize the system by selling it. * Although I really want the money :)
I tried hard to make it as fast and convenient as possible for everyone who will use my code.
That's why I didn't use any libraries and dozens of heavy functions, and I managed to fit in 8+-functions for the whole code.
Absolutely every block of code I tried to make full-fledged modular, that it was easy to import/edit for myself (you).
I have abused the Ternary Pine operator a little (a lot) so that the code was as compact as possible.
Nevertheless, I tried very hard to keep my code very understandable even for beginners.
At last I managed to write 500 lines of code, making it one of the fastest and most feature-rich systems out there.
I hope everyone enjoys my work.
Put comments and write likes.

L_Trade_BoundariesLibrary "L_Trade_Boundaries"
Trade Boundaries suggest a strength of the security with respect to previous lows. The "L" implies library, and the trade boundaries implies it could be utilized for price strengths. Though, this should not be used as a single parameter to trade wildly. This library can be imported to a custom indicator to utilized the custom functions. There are moving averages attached at the bottom right of the canvas (overlay) to benchmark the closing price with respect to Moving Averages: 20, 28, and 200 (i.e., "D" if timeframe == "D") respectively. The Volume Indicator located at the top of the canvas is a default function (function already made by the trading view) this shows the volume with respect to the selected time frame. All of the indicators tell a story with regard to the security price (in strength terms).
What is available in this Library?
Litmus Color
> This is a function will change color of two numbers, if the first number is less than the second, the color will be red; otherwise, the color will be green.
Lister
> This is simply using an array by revisiting previous lows and plotting to the current time frame (i.e., "D"). There is a custom frequency input for the function, it will go back as much as the implied/specified length. Note: I am still learning how to use array, use this function with discretion. I would also appreciate if there are suggestions commented below.
Moving Average
> This function invokes three moving average metrics: 20, 28, and 200 respectively. The values are displayed at the bottom right of the canvas.
Timeframe Highlight
> This function checks for the input timeframe (i.e., "D", "W", "M") and if the time frame happens to be the same, it will give a "true" result. This result can be utilized for highlighting the positive results on the canvas (the red lines).
litmus_color(value1, value2)
Parameters:
value1
value2
lister(length)
Parameters:
length
moving_averages()
timeframe_highlight(timeframe)
Parameters:
timeframe

Modified Mannarino Market Risk Indicator MMMRI MMRIModified Mannarino Market Risk Indicator MMMRI was developed by "Nobody Special Finance" as an enhancement to the original MMRI developed by Gregory Mannarino. The original and modified version were created as a way to gauge current level of risk in the market. This published indicator includes both versions along with ability to customize the symbols, denominators, and ratio factors that are used within their formulas. Additional options have been included to colorize the candles, plot, and level fills, as well as the option to show or hide a table containing the realtime values for both versions, along with the current dollar strength and 10Y yield.
Levels of market risk are denoted by dashed lines which represent the following levels: 0-50 slight risk, 50-100 low risk, 100-200 moderate risk, 200-300 high risk, 300+ extreme risk. The plot displays whichever of the following two formulas has been selected in the indicator settings, the default choice has been set to MMMRI:
MMRI = (USD Strength * USD Interest Rate) / 1.61
MMMRI = (Debt / GDP) * (USD Strength * USD Interest Rate) / 1.61
NOTICE: This is an example script and not meant to be used as an actual strategy. By using this script or any portion thereof, you acknowledge that you have read and understood that this is for research purposes only and I am not responsible for any financial losses you may incur by using this script!
