Multicolor Bollinger Bands - Market PhasesHi everyone
Hope you're all doing well 😘
Today I feel gracious and decided to give to the community. And giving not only an indicator but also a trading method
This trading method shows how a convergence based on moving averages is tremendous
Multicolour Bollinger Bands indicator that indicates market phases.
It plots on the price chart, thanks to different color zones between the bands, a breakdown of the different phases that the price operates during a trend.
The different zones are identified as follows:
- red color zone: trend is bearish, price is below the 200 periods moving average
- orange color zone: price operate a technical rebound below the 200 periods moving average
- yellow color zone: (phase 1 which indicate a new bearish cycle)
- light green zone: (phase 2 which indicate a new bullish cycle)
- dark green zone: trend is bullish, price is above the 200 periods moving average
- grey color zone: calm phase of price
- dark blue color zone: price is consolidating in either bullish or bearish trend
- light blue zones: price will revert to a new opposite trend (either long or short new trend)
By identifying clearly the different market phases with the multicolor Bollinger bands, the market entries by either a the beginning of a new trend or just after a rebound or a consolidating phase is easier to spot on.
Trade well and trade safe
Dave
"200元+股票大盘"に関するスクリプトを検索

EMA - Baby WhaleThis script will show you the 8, 13, 21, 55, 100 and 200 EMA .
You can change the colors yourself if you want.
You can use the EMA to define the trend.
A good strategy that traders use is a 55 EMA crossover.
This means that when the 8, 13 and 21 all cross the 55 EMA you place a buy or sell order.
You close your position when the same thing happens on the other side.
Another great way that traders use these EMA's is to spot a Golden or Death cross.
When the 55 and 200 EMA cross and the 200 becomes support it means we're in a uptrend and vice versa.
If you want access, just send a message please.
Much love from Baby Whale!!
🙏❤️🐳

BTC 1D Alerts V1This script contains a variety of key indicator for bitcoin all-in-one and they can be activated individually in the menu. These are meant to be used on the 1D chart for Bitcoin.
1457 Day Moving Average: the bottom of the bitcoin price and arguably the rock bottom price target.
Ichimoku Cloud: a common useful indicator for bitcoin support and resistance.
350ma fibs (21 8 5 3 2 and 1.6) : Signify the tops of each logarthmic rise in bitcoin price. They are generally curving higher over the long term. For halvening #3, the predicted market crash would be after hitting the 350ma x3 fib. Also the 350 ma / 111 ma cross signifies bull market top within about 3 days as well. Using the combination of the 350ma fibs and the 350/111 crosses, reasonably identify when market top is about to occur.
50,120,200 ma: Common moving averages that bitcoin retests during bull market runs. Also, the 50/200 golden and death crosses.
1D EMA Superguppy Ribbons: green = bull market, gray is indeterminate, red = bear market. Very high specificity indicator of bull runs, especially for bitcoin. You can change to 3D candle for even more specificity for a bull market start. Use the 1W for even more specificity. 1D Superguppy is recommended for decisionmaking.
1W EMA21: a very good moving average programmed to be shown on both the daily and weekly candle time. Bitcoin commonly corrects to this repeatedly during past bull runs. Acts as support during bull run and resistance during a bear market.
Steps to identifying a bull market:
1. 50/200 golden cross
2. 1D EMA superguppy green
3. 3D EMA superguppy green (if you prefer more certainty than step 2).
4. Hitting the 1W EMA21 and bouncing off during the bull run signifies corrections.
Once a bull market is identified,
Additional recommended buying and selling techniques:
Indicators:
- Fiblines - to determine retracements from peaks (such as all time high or recent highs)
- Stochastic RSI - 1d, 3d, and 1W SRSI are great time to buy, especially the 1W SRSI which comes much less frequently.
- volumen consolidado - for multi exchange volumes compiled into a single line. I prefer buying on the lowest volume days which generally coincide with dips.
- MACD - somewhat dubious utility but many algorithms are programmed to buy or sell based on this.
Check out the Alerts for golden crosses and 350ma Fib crosses which are invaluable for long term buying planning.
I left this open source so that all the formulas can be understood and verified. Much of it hacked together from other sources but all indicators that are fundamental to bitcoin. I apologize in advance for not attributing all the articles and references... but then again I am making no money off of this anyway.

Ultimate Moving Average Package (17 MA's)Included is the:
VWAP
Current time frame 10 EMA
Current time frame 20 EMA
Current time frame 50 EMA
Current time frame 10 SMA
Current time frame 20 SMA
Current time frame 50 SMA
Daily 10 EMA
Daily 20 EMA
Daily 50 EMA
Daily 50 SMA
Daily 100 SMA
Daily 200 SMA
Weekly 100 SMA
Weekly 200 SMA
Monthly 100 SMA
Monthly 200 SMA
All Daily/Weekly/Monthly MA's can be seen on intraday charts. Current time frame MA's change depending on your time frame. Obviously you dont need all 17 on your chart but you can pick the ones you like and disable the rest.

Fischy Bands (multiple periods)Just a quick way to have multiple periods. Coded at (14,50,100,200,400,600,800). Feel free to tweak it. Default is all on, obviously not as usable! Try just using 14, and 50.
This was generated with javascript for easy templating.
Source:
```
const periods = ;
const generate = (period) => {
const template = `
= bandFor(${period})
plot(b${period}, color=colorFor(${period}, b${period}), linewidth=${periods.indexOf(period)+1}, title="BB ${period} Basis", transp=show${period}TransparencyLine)
pb${period}Upper = plot(b${period}Upper, color=colorFor(${period}, b${period}), linewidth=${periods.indexOf(period)+1}, title="BB ${period} Upper", transp=show${period}TransparencyLine)
pb${period}Lower = plot(b${period}Lower, color=colorFor(${period}, b${period}), linewidth=${periods.indexOf(period)+1}, title="BB ${period} Lower", transp=show${period}TransparencyLine)
fill(pb${period}Upper, pb${period}Lower, color=colorFor(${period}, b${period}), transp=show${period}TransparencyFill)`
console.log(template);
}
console.log(`//@version=4
study(shorttitle="Fischy BB", title="Fischy Bands", overlay=true)
stdm = input(1.25, title="stdev")
bandFor(length) =>
src = hlc3
mult = stdm
basis = sma(src, length)
dev = mult * stdev(src, length)
upper = basis + dev
lower = basis - dev
`);
periods.forEach(e => console.log(`show${e} = input(title="Show ${e}?", type=input.bool, defval=true)`));
periods.forEach(e => console.log(`show${e}TransparencyLine = show${e} ? 20 : 100`));
periods.forEach(e => console.log(`show${e}TransparencyFill = show${e} ? 80 : 100`));
console.log('\n');
console.log(`colorFor(period, series) =>
c = period == 14 ? color.white :
period == 50 ? color.aqua :
period == 100 ? color.orange :
period == 200 ? color.purple :
period == 400 ? color.lime :
period == 600 ? color.yellow :
period == 800 ? color.orange :
color.black
c
`);
periods.forEach(e => generate(e))
```

MACD/EMA Long StrategyThis incredibly simple strategy uses a combination of the 20 EMA and bullish/bearish MACD crosses as a low risk method of getting in and out of markets.
Depending on whether the market is above or below the 200 SMA, the script determines if the market is in bullish or bearish territory. Above the 200 SMA, the script will ignore the 20 EMA as a buy condition and buy solely on the confirmation of a bullish MACD cross upon the close of a candle. In this bullish market, the script will only enable the sell condition if both the MACD is bearish AND a close below the 20 EMA occurs. This is to reduce the chances of the script selling prematurely in the event of a bearish MACD cross, if the market is still in overall bullish territory.
When the market is below the 200 SMA, the confirmation occurs in the opposite direction. The buy condition will only be met if both the MACD is bullish AND a close above the 20 EMA occurs. However, the sell condition ignores the 20 EMA and will sell solely on the confirmation of a bearish MACD cross upon the close of the candle.
This strategy can be used in both bullish and bearish markets. This conservative strategy will slightly underperform in a bull market, with the sell condition occasionally being met and then potentially buying back higher. However, it will successfully get you out of a turning market and automatically switch into a more 'risk-off' mentality during a bear market. This strategy is not recommended for sideways markets, as trading around the 20 EMA coupled with a relatively flat MACD profile can cause the strategy to buy the peaks and sell troughs easily.

market phases - JDThis indicator shows the relation of price against different period ma's.
When put in daily Timeframe it gives the 1400 Day (= 200 Weekly) and the 200 ,100 an 50 Daily.
The lines show the 200,100 and 50 ma in relation to the 1400 ma.
JD.
#NotTradingAdvice #DYOR

Trend Lines and MoreMulti-Indicator consisting of several useful indicators in a single package.
TREND LINES
-By default the 20 SMA and 50 SMA are shown.
-Use "MOVING AVERAGE TYPE" to select SMA, EMA, Double-EMA, Triple-EMA, or Hull.
-Use "50 MA TREND COLOR" to have the 50 turn green/red for uptrend/downtrend.
-Use "DAILY SOURCE ONLY" to always show daily averages regardless of timeframe.
-Use "SHOW LONG MA" to also include 100, 150, and 200 moving averages.
-Use "SHOW MARKERS" to show a small colored marker identifying which line is which.
OTHER INDICATORS
-You can show Bollinger Bands and Parabolic SAR.
-You can highlight key reversal times (9:50-10:10 and 14:40-15:00).
-You can show price offset markers, where was the price "n" periods ago.
That last one is useful to show the level of prices which are about to "fall off" the moving average
and be replaced with current price. So for example, if current price is significantly below the
200-days-ago price, you can gauge the difficulty for the 200 MA to start climbing again.

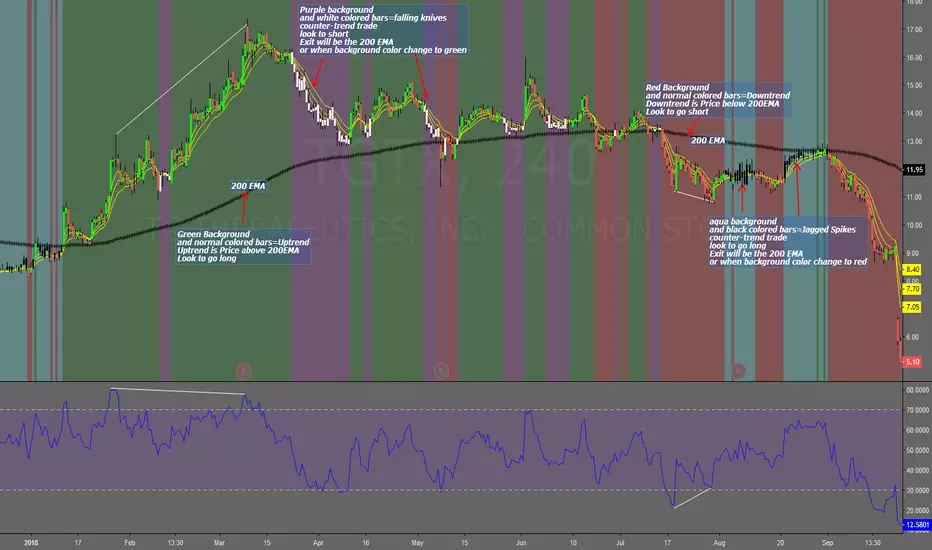
Falling Knives Jagged SpikesThe purpose of this script is to trade with the trend, trade trend continuation, and counter-trend trades.
Uptrend is price above 200 ema: Background is green and the bar colors are normal
Downtrend is price below 200 ema: Background is red and the bar colors are normal
Counter-trend to uptrend--Bar colors are white and the background is purple
counter-trend to downtrend--Bar colors are black and the background is aqua.
How to use:
Uptrend (green background): Only go long
Downtrend (red background): only go short
Counter-trend to uptrend/downtrend (white bars/black bars): Take counter-trend trade when price is a substantial distance from the 200 EMA. Best if there was a divergence with an oscillator. A lot of times these are just deep pullbacks or rallies.
trend continuation: In uptrend, after falling knives, and trend continues up (background turns to green) look to buy, you are getting a great price on the asset. Same for downtrend.
Keep in mind that nothing is perfect, and to of-course test everything.
Best of luck in all you do. Get money.
3 EMAS strategy to define trendsBasic script that allows you to have 3 scripts all in one EMA (exponential moving averages). They are useful to know the general trends of your chart: current long-term trend, short-term (or immediately) and general.
1 ° EMA 36 serves to define or mark action of the market trend price.
At the moment of crossing EMA 36 with EMA 200 upwards it indicates continuation to level 2 ...
2 ° EMA 200 serves as support or resistance according to the case, confirms continuation of trend in medium or long term when crossing with EMA 500, upward trend probability level 3 confirmed. As the case may be, cross up or down.
3 ° EMA 500 serves as support or resistance of the price action.
EMAS 200 and 500 give you a probability of Starting Area ...
Confirming with support or resistance.
Complementation with Stochastics ..
MACD
Note: Remember that "exponential" means that these indicators give more weight to the most recent data, making them more reactive to price changes (react faster to changes in recent prices than simple moving averages)
GROWINGS CRYPTOTRADERS

Mayer Multiple @ Current PriceThough this script is by me, the original idea comes from a podcast I heard where Trace Mayer talks about how he does crypto valuation. It is based on current price against the 200 day moving average. This indicator script will simply plot that value as a label overlayed on your trading view chart. Best long term results occur when acquiring BTC when the multiple is 2.4 or less. For more info, google "mayer multiple" This script/indicator is strictly for educational purposes. It is not exclusive to bitcoin.
To get the best look out of your charts I make the following changes.
1.Apply the indicator to your chart.
2. In the tools palette of trading view, when looking at a chart, click "Show Objects Tree" the icon displayed above the trash can.
In the objects tree panel, click the preferences icon for "Mayer Multiple @ Current Price"
Switch "scale" to "scale Left"
3. Then for your chart preferences (right click on chart background and select "Properties", and be sure the following are checked on the "Scales" tab
Left Axis
Right Axis
Indicator Last Value
Indicator Labels
Screenshots are not allowed in this view, so I can't post screenshots, but the view above is what it should look like when you are done.
For anyone who wants to see the code, here is the code of the script:
Use at will, and at your own risk.
//@version=3
// Created By Timothy Luce, inspired by Trace Mayer's 200 Day SMA cryptocurrency valuation method
study("Mayer Multiple @ Current Price", overlay=true)
currentPrice = close
currentDay = security(tickerid, "D", sma(close, 200))
mayerMultiple = currentPrice/currentDay
plot(mayerMultiple, color=#00ffaa, transp=100)
If you want to change the color, change this line: #00ffaa

Multiple Moving AveragesThis is really simple. But useful for me as I don't have a paid account. No-pro users can only use 3 indicators at once and because I rely heavily on simple moving averages it can be a real pain.
This one indicator features:
20 MA
50 MA
100 MA
200 MA
which I find are the most useful overall. The 20 and 50 over all time frame but in particular < 1 day, the 100 and 200 at > 4 hr time frames. In general I don't use the 100 MA that much. The daily 200 MA is a critical support for many assets like stocks and cryptos. I'm by no means a pro and if you are learning I recommend becoming familiar with moving averages right at the beginning.
If you want to deactivate some of the lines, you can do it via the indicator's settings icon.

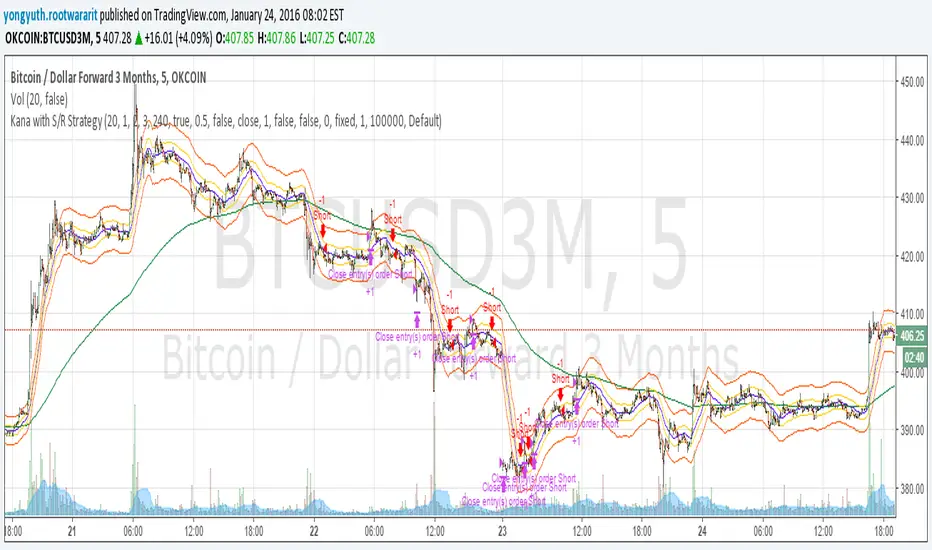
Yuthavithi Kana with S/R StrategyI have got the idea from this page iwongsakorn.com and wrote my own kana scalper. This strategy draws 3 200 ATR level along side with the sma. It uses 200 ema as trend. Once the price approaches the 20 ema. it will place orders according to trend and take profit and stop loss quickly using the 200 ATR lines.
This is a quick scalper strategy with winrate over 50%
Advanced Confluence DashboardAdvanced Confluence Dashboard - Multi-Indicator Technical Analysis Tool
OVERVIEW
The Advanced Confluence Dashboard is a comprehensive technical analysis tool designed to help traders identify high-probability trade setups by tracking multiple technical indicators simultaneously. The indicator displays up to 13 different technical confluences in an easy-to-read dashboard format, providing both individual signals and an overall market bias percentage. Switch between full table view and condensed view for maximum chart flexibility.
FEATURES
- 13 Technical Confluences: RSI, VWAP, EMA Cross (9/21), MACD, Stochastic, Trend (50 EMA), Bollinger Bands, ADX Strength, Price Momentum, Volume Breakout, VWAP Bands, 200 EMA, and Price Action (Higher Highs/Lower Lows)
- Real-time Confluence Scoring: Automatically calculates bullish vs bearish signal strength
- Multi-Timeframe Support: Analyze indicators on any timeframe while viewing your chart on another
- Customizable Display: Toggle individual indicators on/off, adjust table position, size, and transparency
- ATR Information: Optional ATR display for volatility-based position sizing
- Condensed View Mode: Ultra-minimal display showing only confluence score and ATR (perfect for scalpers who want maximum chart visibility)
- Full Table View: Detailed breakdown of each indicator's value and signal
- Color-Coded Signals: Green (bullish), red (bearish), white (neutral) for instant visual clarity
HOW IT WORKS
The indicator evaluates each enabled technical indicator and assigns it either a bullish or bearish signal based on its current state. The confluence score shows how many indicators are aligned in each direction, giving you a clear percentage-based view of market bias. For example, if 8 out of 13 indicators are bullish, you'll see a 62% LONG BIAS signal.
DISPLAY MODES
Full View: Shows all enabled indicators with their current values and signals in a detailed table format. Perfect for understanding exactly which indicators are bullish or bearish and why.
Condensed View: Shows only the confluence score (e.g., "4/13 LONG | 9/13 SHORT - SHORT BIAS 69%") and optional ATR information. This minimal display keeps your chart clean while still providing the essential confluence data you need for quick trading decisions. Ideal for scalpers and traders who want maximum chart space.
CONFLUENCES EXPLAINED
- RSI: Momentum oscillator (>50 bullish, <50 bearish, shows overbought/oversold)
- VWAP: Volume-weighted average price (above = bullish, below = bearish)
- EMA Cross: Fast EMA (9) vs Slow EMA (21) with price position
- MACD: Trend-following momentum (line above signal = bullish)
- Stochastic: Momentum oscillator (>50 bullish, <50 bearish)
- Trend (50 EMA): Price position relative to 50-period EMA
- Bollinger Bands: Volatility and mean reversion (above middle = bullish)
- ADX Strength: Trend strength indicator (shows strong trends)
- Price Momentum: Rate of price change over specified period
- Volume Breakout: Detects unusual volume with directional bias
- VWAP Bands: Standard deviation bands around VWAP
- 200 EMA: Long-term trend indicator
- Price Action: Higher Highs and Lower Lows pattern detection
SETTINGS
Timeframe Settings:
- Indicator Timeframe: Analyze indicators on a different timeframe than your chart
Display Options:
- Condensed View: Toggle between full table and minimal display
- Show ATR Info: Display/hide ATR information
- Table Position: 9 positions (top/middle/bottom + left/center/right)
- Text Size: Auto, tiny, small, normal, large, huge
- Table Transparency: 0-100%
- Border Width: 1-5 pixels
Confluence Toggles:
- Enable/disable any of the 13 confluences individually
- Confluence score automatically adjusts based on enabled indicators
Indicator Settings:
- RSI Length (default: 14)
- ATR Length (default: 14)
- Fast/Slow EMA (default: 9/21)
- Trend EMA (default: 50)
- Volume SMA Length (default: 20)
- Volume Breakout Multiplier (default: 2.0x)
- Bollinger Bands Length/StdDev (default: 20/2.0)
- ADX Length (default: 14)
- ADX Strength Threshold (default: 25)
- Momentum Length (default: 10)
IDEAL USE CASES
- Scalping: Quick identification of confluence for fast entries/exits - use condensed view for clean charts
- Day Trading: Multi-timeframe analysis for intraday setups
- Swing Trading: Confirmation of longer-term bias
- Risk Management: Higher confluence = higher probability trades
- Trade Filtering: Only take trades when confluence reaches your threshold
- Multi-Monitor Setups: Use condensed view on execution charts, full view on analysis charts
HOW TO USE
1. Add the indicator to your chart
2. Toggle on/off the confluences you prefer to use
3. Choose between Full View (detailed) or Condensed View (minimal)
4. Adjust the table position and size to your preference
5. Look for high confluence percentages (70%+ is strong bias)
6. Use the individual indicator signals (full view) to understand market structure
7. Combine with your trading strategy for entry/exit confirmation
TIPS
- Use Condensed View when scalping to keep your chart clean and uncluttered
- Switch to Full View when you need to analyze which specific indicators are conflicting
- Higher confluence doesn't guarantee success - always use proper risk management
- Consider using 60%+ confluence as a minimum threshold for trades
- Pay attention to which specific indicators are aligned vs conflicting
- Use the ATR display for quick reference on position sizing
- Experiment with different timeframes to find what works for your style
- Disable indicators you don't use to simplify your confluence scoring
DISCLAIMER
This indicator is for educational and informational purposes only. It does not constitute financial advice, investment advice, trading advice, or any other type of advice. Trading and investing in financial markets involves substantial risk of loss and is not suitable for every investor. Past performance is not indicative of future results. Always do your own research and consult with a qualified financial advisor before making any investment decisions.

UNDETECTED FX - Psychologic LevelsThis indicator automatically plots major 250-pip psychological levels on XAUUSD and highlights the price zones around them. These levels act as strong reaction points where liquidity, reversals, and institutional activity commonly occur.
What the Indicator Does
✔ Plots every 250-pip level starting from a user-defined base (e.g., 4050 → 4075 → 4100 → 4125 → …)
✔ Each level is represented by a thick black horizontal line for maximum visual clarity
✔ Around every 250-pip level, the indicator draws a liquidity zone
Top of zone: +200 pips
Bottom of zone: –200 pips
(configured as ± zoneHalf in settings)
✔ Uses extend: both, so levels stretch across the entire chart and stay fixed, no matter how far you scroll
✔ Zones are filled with a customizable color for clear premium/discount visualization
✔ The indicator never repaints and requires no updates after drawing — all levels are fixed on their price coordinates
Why It’s Useful
🔹 Helps quickly identify institutional levels where gold often reacts
🔹 Acts as a framework for scalping, intraday trading, and swing bias
🔹 Makes it easy to spot liquidity sweeps, rejections, and premium/discount areas
🔹 Clearly shows market structure breaks around key psychological levels
🔹 Forces discipline by creating predefined, fixed levels for trading decisions
Best Use Case
XAUUSD scalpers
Intraday traders who rely on precision entries
Traders who use psychological levels, liquidity grabs, or smart-money concepts
Anyone wanting a clean, non-cluttered chart with high-impact levels only

SNIPER ORB# 🎯 SNIPER ORB TRADING CHEAT SHEET
## Quick Reference Guide for Live Trading
---
## 📊 VISUAL IDENTIFICATION GUIDE
```
═══════════════════════════════════════════════════════════════════
YOUR CHART AT A GLANCE
═══════════════════════════════════════════════════════════════════
🔵 BRIGHT BLUE BOX (5min) → Fastest ORB, early warning signals
🔷 CYAN BOX (15min) → Mid-term institutional reference
🟣 PURPLE BOX (30min) → PRIMARY TRADING RANGE (your base)
🟢 GREEN DASHED LINES → Upside profit targets (long)
🔴 RED DASHED LINES → Downside profit targets (short)
🟡 GOLD LINE (VWAP) → Institutional fair value anchor
═══════════════════════════════════════════════════════════════════
```
---
## ⏰ SESSION TIMING MATRIX
| Session | Start Time | ORB Complete | Breakout Window | End Time |
|---------|-----------|--------------|-----------------|----------|
| **London Open** | 3:00 AM ET | 3:30 AM ET | 3:30-5:00 AM | 9:30 AM ET |
| **New York Open** | 9:30 AM ET | 10:00 AM ET | 10:00-11:30 AM | 5:00 PM ET |
**💡 GOLDEN RULE**: Wait for 30min ORB to **complete** before taking breakout trades!
---
## 🎯 THE 5 HIGH-PROBABILITY SETUPS
### **SETUP #1: CLEAN BREAKOUT** ⭐⭐⭐⭐⭐
```
CONDITIONS:
✅ 30min ORB complete (10:00 AM for NY / 3:30 AM for London)
✅ Price breaks ABOVE purple high (bullish) or BELOW purple low (bearish)
✅ VWAP confirms direction:
• Long: VWAP below price
• Short: VWAP above price
✅ Volume spike on breakout candle
ENTRY: Breakout candle close
STOP: Inside 30min ORB (opposite side)
TARGET 1: First green/red target (0.5x range)
TARGET 2: Second target (1x range)
TARGET 3: Third target (1.5x range)
WIN RATE: 65-75% | R:R = 1:2 minimum
```
---
### **SETUP #2: FALSE BREAKOUT REVERSAL** ⭐⭐⭐⭐⭐
```
CONDITIONS:
✅ Price breaks purple high/low initially
✅ Fails to hold (wick reversal or immediate rejection)
✅ Re-enters 30min ORB zone
✅ VWAP acts as rejection point
✅ Breaks opposite side of 30min ORB
ENTRY: When price breaks opposite ORB boundary
STOP: Original false breakout high/low
TARGET 1: VWAP (quick scalp)
TARGET 2: First opposite target line
WIN RATE: 70-80% | R:R = 1:3+ (trapped traders exit)
NOTES: Most profitable setup - institutions hunting stops
```
---
### **SETUP #3: TRIPLE ORB COMPRESSION** ⭐⭐⭐⭐
```
CONDITIONS:
✅ All 3 ORBs tightly aligned (5min, 15min, 30min overlap)
✅ Range < 0.5% of price (very tight)
✅ VWAP sitting in middle of compression
✅ Multiple candles consolidating inside
ENTRY: Simultaneous break of ALL 3 ORBs
STOP: Middle of compression zone
TARGET: 2x-3x normal targets (explosive move)
WIN RATE: 60-70% | R:R = 1:4+ (volatility expansion)
NOTES: Low volume → high volume shift = institutional play
```
---
### **SETUP #4: VWAP RETEST CONTINUATION** ⭐⭐⭐⭐
```
CONDITIONS:
✅ 30min ORB already broken (trend established)
✅ Price pulls back to VWAP
✅ VWAP acts as dynamic support/resistance
✅ Rejection candle forms at VWAP
ENTRY: Candle closes back in trend direction from VWAP
STOP: 10-15 points beyond VWAP
TARGET: Next target line (1x, 1.5x, 2x)
WIN RATE: 70-75% | R:R = 1:2
NOTES: Safest continuation entry, institutions defending VWAP
```
---
### **SETUP #5: OPENING RANGE FADE** ⭐⭐⭐
```
CONDITIONS:
✅ Price stuck inside 30min ORB for 1+ hours post-formation
✅ Multiple failed attempts to break high or low
✅ VWAP in dead center (neutral)
✅ Decreasing volume
ENTRY: Sell at purple high, buy at purple low (range bound)
STOP: Outside ORB by 20 points
TARGET: Opposite ORB boundary + VWAP
WIN RATE: 55-65% | R:R = 1:1.5
NOTES: Use on slow/choppy days only, exit if breakout starts
```
---
## 🛡️ RISK MANAGEMENT RULES
### **Position Sizing Matrix**
```
Account Size: $50,000 example
Risk Per Trade: 1-2% max
ORB Range | Stop Distance | Position Size (1% risk) | YM Contracts
-------------|---------------|-------------------------|-------------
50 points | 50 points | $500 risk | 1 contract
100 points | 100 points | $500 risk | 1 contract
150 points | 150 points | $500 risk | 1 contract
200 points | 200 points | $500 risk | 1 contract
Formula: Risk $ ÷ (Stop Distance × $5 per point) = Contracts
```
### **The 3-Strike Rule**
```
✅ Strike 1: Full position size
❌ Stop hit → Strike 2: Half position size
❌ Stop hit → Strike 3: 1/4 position size
❌ Stop hit → DONE for the session
```
### **Profit Taking Strategy**
```
TARGET 1 (0.5x): Take 50% off, move stop to breakeven
TARGET 2 (1x): Take 30% off, trail stop 20 points
TARGET 3 (1.5x): Take 15% off, let 5% run to 2x-3x
```
---
## ⚠️ DO NOT TRADE IF...
```
🚫 30min ORB incomplete (wait until 10:00 AM NY / 3:30 AM London)
🚫 ORB range < 30 points YM (too tight, likely fake breakout)
🚫 ORB range > 300 points YM (too wide, unpredictable)
🚫 Major news release within 30 minutes
🚫 You've hit 3 losses in the session (walk away)
🚫 Price whipsawing violently (wait for structure)
🚫 You're tired, emotional, or distracted
```
---
## 🔍 PRE-MARKET CHECKLIST
**Every Morning Before Trading:**
```
□ Check economic calendar (avoid high-impact news)
□ Identify previous day's high/low (macro context)
□ Note overnight price action (gap up/down?)
□ Load SNIPER ORB on 1min or 5min chart
□ Select active session (London or New York)
□ Set TradingView alerts for ORB breakouts
□ Prepare stop/target orders in advance
□ Review yesterday's ORB ranges (context)
```
---
## 🎨 INDICATOR SETTINGS QUICK REFERENCE
### **Default Configuration (Recommended)**
```
Session: New York
Number of Targets: 3
Target % Increment: 50% (gives 0.5x, 1x, 1.5x)
Show VWAP: ON
VWAP Line Width: 2
ORB Line Width: 2
Target Line Width: 1
```
### **Aggressive Day Trading Setup**
```
Session: New York
Number of Targets: 5
Target % Increment: 30% (tighter targets)
Show VWAP: ON
```
### **Conservative Swing Setup**
```
Session: New York
Number of Targets: 2
Target % Increment: 75% (wider targets)
Show VWAP: ON
```
---
## 📈 OPTIMAL TIMEFRAME BY STYLE
| Trading Style | Recommended TF | Why? |
|--------------|----------------|------|
| **Scalper** | 1-minute | See every tick, 5-15 min holds |
| **Day Trader** | 5-minute | Balanced view, 30-90 min holds |
| **Swing Trader** | 15-minute | Less noise, 2-4 hour holds |
**💡 PRO TIP**: Use 5min chart for entries, but watch 1min for precise timing!
---
## 🧠 PATTERN RECOGNITION QUICK GUIDE
### **Bullish ORB Patterns**
```
1. "Staircase" → Price respects each target as new support
2. "Rocket Launch" → Clean break through all targets no pullback
3. "VWAP Bounce" → Pullback to VWAP, then continuation higher
4. "Triple Compression" → All ORBs converge then explosive breakout
```
### **Bearish ORB Patterns**
```
1. "Waterfall" → Price cascades through all downside targets
2. "Failed High" → Breaks top, immediately reverses to bottom
3. "VWAP Rejection" → Hits VWAP from above, hard rejection down
4. "Slow Bleed" → Gradual drift lower, respecting each target
```
### **Neutral/Chop Patterns**
```
1. "Ping Pong" → Price bouncing between ORB high/low repeatedly
2. "Flat VWAP" → VWAP horizontal, price hugging it (no trade)
3. "Wide Range" → ORB > 300 points, too much uncertainty
4. "Gap Confusion" → Opens far outside all ORBs, wait for reset
```
---
## 📊 CONFLUENCE SCORING SYSTEM
**Rate Each Trade 1-10 Before Entry:**
```
Breakout confirmed (30min ORB): +2 points
VWAP alignment: +2 points
Volume spike on breakout: +1 point
All 3 ORBs align: +1 point
Clean candle close beyond ORB: +1 point
Your YM SNIPER GOD MODE signal: +2 points
Time: 10:00-11:30 AM ET window: +1 point
SCORING:
9-10 points = SNIPER SETUP (maximum size)
7-8 points = GOOD TRADE (standard size)
5-6 points = MARGINAL (half size or skip)
< 5 points = NO TRADE (wait for better)
```
---
## 🎯 INTEGRATION WITH YM ULTIMATE SNIPER v8.1
**The Perfect Confluence:**
```
STEP 1: SNIPER ORB identifies the STRUCTURE
→ 30min ORB defines "Zones That Matter"
→ VWAP shows institutional bias
→ Targets define profit zones
STEP 2: YM ULTIMATE SNIPER triggers the ENTRY
→ Wait for GOD MODE signal at ORB boundary
→ 6-gate system confirms institutional pressure
→ Score ≥9.0, fat body ≥70%, delta dominance ≥70%
STEP 3: Execute with PRECISION
→ ORB break + GOD MODE = highest probability
→ Enter only when BOTH systems align
→ This is TRUE "sniper" trading
```
---
## 💡 COMMON MISTAKES TO AVOID
```
❌ Entering BEFORE 30min ORB completes
✅ Wait until 10:00 AM (NY) or 3:30 AM (London)
❌ Ignoring VWAP position
✅ Always check: is VWAP confirming your directional bias?
❌ Chasing breakouts after 50+ point move
✅ Wait for pullback to VWAP or first target
❌ Trading during lunch (12-1 PM ET)
✅ Volume dies, false signals increase
❌ Using same target % in all conditions
✅ Adjust: 30-40% in chop, 50-75% in trends
❌ Forgetting to move stop to breakeven at Target 1
✅ NEVER give back a winning trade
❌ Overtrading on slow days
✅ Some days only have 1-2 clean setups, that's okay!
❌ Not respecting the 3-strike rule
✅ 3 losses = done, come back tomorrow
```
---
## 📱 MOBILE TRADING SETUP
**TradingView Mobile App:**
```
1. Save SNIPER ORB as "Default Layout"
2. Enable push notifications for alerts
3. Set bracket orders (stop + targets) in advance
4. Keep phone charged during trading hours
5. Have broker app ready for quick execution
```
---
## 🔔 ALERT CONFIGURATION
**Essential Alerts to Set:**
```
1. "30min ORB Complete"
→ Time-based: 10:00 AM ET (NY) / 3:30 AM ET (London)
2. "ORB Breakout Up"
→ Built-in: Price > 30min ORB high
3. "ORB Breakout Down"
→ Built-in: Price < 30min ORB low
4. "VWAP Touch"
→ Custom: Price crosses VWAP line
5. "Target 1 Hit"
→ Price level: First green/red target line
```
---
## 🎓 DAILY REVIEW TEMPLATE
**After Each Trading Session:**
```
Date: __________ Session: London / New York
Total Setups Identified: ____
Trades Taken: ____
Win Rate: ____%
P&L: $______
Best Trade:
- Setup type: _________________
- Entry: ______ Exit: ______
- What went right: _________________
Worst Trade:
- Setup type: _________________
- Entry: ______ Exit: ______
- What went wrong: _________________
Tomorrow's Adjustments:
□ _________________________________
□ _________________________________
□ _________________________________
```
---
## 🚀 QUICK START: YOUR FIRST TRADE
**5-Minute Walkthrough:**
```
1. ADD TO CHART (9:25 AM ET)
→ Load SNIPER ORB indicator
→ Select "New York" session
→ Set targets: 3 levels, 50%
2. WAIT (9:30-10:00 AM)
→ Watch 30min ORB form (purple box)
→ Note VWAP position
→ Identify if price trending or ranging
3. PREPARE (10:00 AM)
→ 30min ORB complete!
→ Measure range (info table shows points)
→ Set alerts for breakout
4. EXECUTE (10:00-11:30 AM)
→ Breakout signal fires
→ Check VWAP alignment
→ Check YM SNIPER confluence
→ Enter trade if 7+ confluence points
5. MANAGE
→ Target 1: Take 50%, move stop to BE
→ Target 2: Take 30%, trail stop
→ Target 3: Let remainder run
6. REPEAT
→ Maximum 3 trades per session
→ Stop after 3 losses
```
---
## 🏆 WINNING TRADER MINDSET
```
"I don't need to trade every ORB breakout.
I only need the HIGH-PROBABILITY setups.
3-5 trades per day is enough.
90%+ win rate on those 3-5 trades = success.
Patience + Precision = Profitability"
```
---
## 📞 TROUBLESHOOTING
**Indicator Not Showing?**
- Check max_boxes/max_lines limits in code
- Verify you're on 1min-30min timeframe
- Ensure TradingView session is 9:30-17:00 ET
**ORBs Look Wrong?**
- Verify timezone: should be "America/New_York"
- Check if market has DST adjustment today
- Confirm broker chart time matches indicator
**VWAP Disappeared?**
- Toggle "Show Anchored VWAP" in settings
- Check if session ended (auto-disappears at 5 PM)
- Verify you're not in pre-market hours
**Targets Too Close/Far?**
- Adjust "Target % Increment" setting
- 30% = tighter, 75% = wider
- Default 50% works for most conditions
---
## 🎯 FINAL CHECKLIST BEFORE GOING LIVE
```
□ Backtested on replay mode for 2+ weeks
□ Understand all 5 setup types
□ Risk management rules memorized
□ YM Ultimate SNIPER v8.1 loaded on same chart
□ TradingView alerts configured
□ Stop/target calculator ready
□ Trading journal template prepared
□ Emotional state: calm and focused
□ Sufficient account size (minimum $10k recommended)
□ Broker platform tested and ready
IF ALL CHECKED → YOU'RE READY TO SNIPE! 🎯
```
---
## 📚 ADVANCED RESOURCES
**Combine SNIPER ORB with:**
- Cumulative Volume Delta (CVD) for confirmation
- Footprint charts for order flow at ORB boundaries
- Market profile for volume-at-price context
- Options flow for institutional positioning
- Economic calendar for high-volatility avoidance
**Study Material:**
- Mark Fisher "The Logical Trader" (ORB bible)
- SMB Capital YouTube (institutional ORB strategies)
- Your own YM Ultimate SNIPER documentation
- Price action at previous session ORBs (historical analysis)
---
**💎 REMEMBER: Quality over quantity. Sniper precision over shotgun spray.**
**🎯 Good luck, and happy sniping! 🎯**
═══════════════════════════════════════════════════════════════════
END OF SNIPER ORB TRADING CHEAT SHEET
═══════════════════════════════════════════════════════════════════

AQR Momentum AQR Momentum – Short Description
Uses the slopes of 20/55/200-day moving averages to measure short-, mid-, and long-term trend direction.
Green = rising trend; Red = falling trend.
55-day slope is the primary momentum signal; 200-day shows the market regime.

Quicksilver Master Terminal [Institutional]Overview
The Quicksilver Master Terminal is a comprehensive data visualization interface designed to bring institutional-grade market awareness to the retail chart. It replaces the need for multiple cluttered indicators by consolidating Trend, Momentum, Volatility, and Structure into a single Heads-Up Display (HUD).
Designed by Quicksilver Algo Systems, this tool is engineered for precision scalpers and prop firm traders who require instant situational awareness without switching timeframes.
Features
1. The Institutional HUD (Heads-Up Display)
Located in the top-right corner, this live dashboard provides real-time metrics on:
Market Structure: Instantly identifies if the asset is in a Bullish or Bearish regime relative to the 200 EMA.
Momentum Status: Tracks overbought/oversold conditions using smoothed Stochastic logic.
Volatility (ATR): Displays live Average True Range data for precise Stop Loss placement.
Volume Flow: Detects institutional volume spikes (1.5x average).
2. The Trend Cloud
A dynamic visual ribbon that fills the space between the Fast EMA (50) and Slow EMA (200).
Green Cloud: Strong Bullish Trend (Look for Longs).
Red Cloud: Strong Bearish Trend (Look for Shorts).
Cross: Visual warning of trend reversals.
3. Sniper Signal Logic
The script paints "INSTITUTIONAL BUY" and "INSTITUTIONAL SELL" labels only when high-probability confluence occurs:
Exhaustion: Stochastic RSI breaches extreme levels (<20 or >80).
Confirmation: Price action aligns with Heikin Ashi smoothing to filter noise.
Momentum: Fast %K crosses Slow %D.
How to Use
For Scalping (1m - 5m): Wait for the Trend Cloud to align with the Signal. Take "BUY" signals only when the Cloud is Green.
For Risk Management: Use the live "Volatility" number in the HUD to set your Stop Loss (e.g., 1.5x the current Volatility value).
About the Developer
This script is part of the Quicksilver Ecosystem. We build algorithmic solutions focused on capital preservation and risk management for funded traders.
Disclaimer: This tool is for educational market analysis only. Past performance is not indicative of future results.

BB & MTF EMAs + DPOC/WPOC v0.1This indicator combines multiple trend and support/resistance tools into a single overlay with specific customization for the Indian Standard Time (IST) session.
Features Included:
Bollinger Bands: 20-period SMA Basis, 1.5 StdDev.
4 Multi-Timeframe EMAs:
EMA 1: 9 Length (1m timeframe)
EMA 2: 20 Length (3m timeframe)
EMA 3: 50 Length (15m timeframe)
EMA 4: 200 Length (15m timeframe)
Session POCs (IST):
Daily POC (DPOC): Calculated 05:30-05:29 IST. Extends for full 24h session.
Weekly POC: Calculated from Monday 05:30 IST Open. Extends for full 7-day week.
Controls:
Toggle visibility for all individual components.
"Show Historical" toggle for pivots to see past levels or keep charts clean.
2 days ago
Release Notes
Description:
This indicator combines multiple trend and support/resistance tools into a single overlay with specific customization for the Indian Standard Time (IST) session.
Features Included:
Bollinger Bands: 20-period SMA Basis, 1.5 StdDev.
4 Multi-Timeframe EMAs:
EMA 1: 9 Length (1m timeframe)
EMA 2: 20 Length (3m timeframe)
EMA 3: 50 Length (15m timeframe)
EMA 4: 200 Length (15m timeframe)
Session POCs (IST):
Daily POC (DPOC): Calculated 05:30-05:29 IST. Extends for full 24h session.
Weekly POC: Calculated from Monday 05:30 IST Open. Extends for full 7-day week.
Controls:
Toggle visibility for all individual components.
"Show Historical" toggle for pivots to see past levels or keep charts clean.

On Balance Volume [BrightSideTrading]
# On Balance Volume - Complete User Guide
## Overview
This enhanced OBV indicator provides clean, actionable volume analysis with intelligent signal filtering. It combines On-Balance Volume (OBV) with a smoothed signal line to identify shifts in buying and selling pressure without chart clutter.
**Key Features:**
- Real-time OBV and signal line visualization
- Smart crossover detection with confirmation filtering
- Z-Score momentum analysis
- Customizable signal alerts with V-shaped markers
- Window-normalized option for detrended analysis
---
## What is On-Balance Volume (OBV)?
OBV is a volume-based momentum indicator that accumulates volume on up days and subtracts volume on down days. It answers a fundamental question: **Is volume flowing in (buying) or out (selling)?**
**Formula:**
- If Close > Previous Close: OBV = Previous OBV + Volume
- If Close < Previous Close: OBV = Previous OBV - Volume
- If Close = Previous Close: OBV = Previous OBV (unchanged)
**What it tells you:**
- **Rising OBV** = Accumulation (smart money buying)
- **Falling OBV** = Distribution (smart money selling)
- **OBV above zero line** = Net positive buying pressure
- **OBV below zero line** = Net negative selling pressure
---
## Interface & Settings
### **MAIN VISUALIZATION**
**OBV Line (Green/Red Ribbon)**
- Green when OBV is above the signal line (bullish trend)
- Red when OBV is below the signal line (bearish trend)
- Toggles between window-normalized (detrended) and raw values
**Signal Line (Orange)**
- Smoothed average of OBV
- Crossovers with OBV generate buy/sell signals
- Default: 21-period SMA
**V-Shaped Markers**
- Green upward V = Bullish crossover (buy signal)
- Red downward V = Bearish crossover (sell signal)
- Appears at the OBV value when signal is triggered
**Zero Line (Yellow)**
- Center equilibrium point for volume balance
- Acts as support/resistance for OBV
- Separates buying pressure (above) from selling pressure (below)
---
### **SOURCE GROUP**
**Source**
- **Default:** Close
- **Options:** Open, High, Low, or any custom value
- Controls which price value triggers OBV direction changes
- Most traders use Close for standard OBV calculation
---
### **SIGNAL SMOOTHING GROUP**
**Show Signal?**
- **Default:** ON
- Toggle visibility of the signal line
- Disable if you prefer to see raw OBV only
**Smoothing Type**
- **SMA (Simple Moving Average)** - Default, standard smoothing
- **EMA (Exponential Moving Average)** - Faster response, weights recent bars more heavily
- **Choose SMA** for consistent, traditional OBV signals
- **Choose EMA** for faster trend identification (more whipsaws possible)
**Smoothing Length**
- **Default:** 21 bars
- **Range:** 1-200 bars
- **Lower values** (5-14): Faster signals, more noise
- **Higher values** (30-50): Slower signals, fewer false alarms
- **Recommendation:** Use 21-25 for most timeframes
---
### **SIGNAL FILTERING GROUP**
This is your primary control for signal quality and frequency.
**Show Signal Markers?**
- **Default:** ON
- Toggle the V-shaped buy/sell markers on/off
- Disable if markers distract from your analysis
**Signal Filter Type**
- **None** - Shows every single crossover (noisy, best for skilled traders)
- **Confirmation Bars** - Waits N bars before confirming signal (recommended)
- **Strength-Based** - Only signals during strong momentum (filters weakest moves)
#### **CONFIRMATION BARS MODE** (Recommended)
Best for reducing false signals while staying responsive to real moves.
**Confirmation Bars**
- **Default:** 2 bars
- **Range:** 1-10 bars
- Waits for the signal to hold for N consecutive bars after crossover
- **Setting 1:** Every crossover (same as "None")
- **Setting 2:** Wait 1 bar confirmation (good balance)
- **Setting 3:** Wait 2 bars confirmation (filters 50% of noise)
- **Setting 4+:** Very selective, misses quick reversals
**How it works:**
1. OBV crosses signal line → Confirmation counter starts
2. If OBV stays on correct side for 2 bars → V-marker appears
3. If OBV crosses back → Counter resets, no signal
#### **STRENGTH-BASED MODE**
Only signals when momentum is statistically significant.
**Min Z-Score Strength**
- **Default:** 0.3
- **Range:** 0.0-3.0
- Requires OBV deviation from its mean to reach this threshold
- **Setting 0.1-0.3:** More signals, lower quality
- **Setting 0.5-0.8:** Moderate signals, good quality
- **Setting 1.0+:** Only the strongest momentum shifts
**How it works:**
- Calculates how far OBV is from its 50-bar average (Z-score)
- Only shows signals when this distance is meaningful
- Automatically avoids weak, choppy market conditions
---
### **VISUALS & COLORS GROUP**
**Highlight Crossovers?**
- **Default:** ON
- Master toggle for all signal markers
- Turn OFF to see only the OBV/signal lines
**Apply Ribbon Filling?**
- **Default:** ON
- Colors the space between OBV and signal line
- Green fill = OBV above signal (bullish)
- Red fill = OBV below signal (bearish)
- Provides clear visual trend confirmation
- Turn OFF for minimal chart clutter
---
### **STATS & ZONES GROUP**
**Use Window-Normalized OBV (visual only)?**
- **Default:** ON
- Removes long-term trend from OBV for clearer short-term signals
- Detrends the indicator to highlight recent momentum changes
- **ON:** Better for swing trading and identifying reversals
- **OFF:** Better for trend-following strategies
- Note: Z-Score always uses raw OBV for statistical accuracy
**OBV Normalize Window**
- **Default:** 200 bars
- Lookback period for detrending calculation
- Larger values = more aggressive detrending
- Adjust if you want OBV to oscillate more/less around zero
**Show Z-Score (OBV)?**
- **Default:** ON
- Displays statistical momentum indicator below main chart
- Ranges from -3 to +3 (most data within -2 to +2)
- High Z-Score = Strong buying momentum
- Low Z-Score = Strong selling momentum
**Z-Score Lookback**
- **Default:** 50 bars
- Period for calculating Z-Score mean and standard deviation
- Larger = smoother Z-Score, slower response
- Smaller = noisier Z-Score, faster response
**Show ROC (OBV Momentum)?**
- **Default:** OFF
- Rate of Change indicator for OBV velocity
- Useful for identifying momentum turning points
- Enable if you want to see speed of volume changes
**ROC Lookback**
- **Default:** 14 bars
- Period for ROC calculation
**Show Z-Score StdDev Zones?**
- **Default:** ON
- Shaded regions around zero line showing statistical boundaries
- Inner Zone (±1 Z) = Normal variation
- Outer Zone (±2 Z) = Extreme moves, potential reversals
- Helps identify overbought/oversold volume conditions
**Inner Zone (±Z)**
- **Default:** 1.0
- First boundary for standard deviation zones
- Most normal trading occurs within ±1
**Outer Zone (±Z)**
- **Default:** 2.0
- Second boundary for extreme conditions
- Crossing these zones indicates significant momentum shift
---
## Trading Strategy Examples
### **Strategy 1: Signal Line Crossovers (Beginner)**
**Setup:**
- Signal Filter Type: **Confirmation Bars**
- Confirmation Bars: **2-3**
- Show Signal Markers: **ON**
**Rules:**
1. **BUY signal** (green V): When OBV crosses above signal line and holds for 2-3 bars
- Confirms buying pressure is building
- Look for price to follow within 1-3 bars
2. **SELL signal** (red V): When OBV crosses below signal line and holds for 2-3 bars
- Confirms selling pressure is increasing
- Expect price decline
3. **Exit:** Take profits at next signal or use price support/resistance
**Best For:** Swing trading, intraday reversals, timeframes 5m-1h
---
### **Strategy 2: Zero Line Bounce (Intermediate)**
**Setup:**
- Signal Filter Type: **Strength-Based**
- Min Z-Score Strength: **0.5**
- Show Z-Score StdDev Zones: **ON**
**Rules:**
1. **Watch OBV approach zero line** during established trends
- OBV bouncing repeatedly off zero = trend is healthy
- OBV breaking through zero = trend reversal imminent
2. **Enter on bounce:** Buy when OBV bounces from zero line in uptrend
3. **Exit on break:** Close position when OBV breaks below zero line
4. **Confirm with Z-Score:** Only take trades when Z-Score shows momentum (|Z| > 0.5)
**Best For:** Trend traders, identifying trend strength, medium timeframes 15m-4h
---
### **Strategy 3: Momentum Extremes (Advanced)**
**Setup:**
- Signal Filter Type: **None**
- Show Z-Score StdDev Zones: **ON**
- Outer Zone: **2.0**
**Rules:**
1. **Identify extremes:** When Z-Score breaks outer zone (±2.0)
- Indicator is in extreme territory
- Likely overextended
2. **Fade extremes:** Take opposite position when Z-Score hits extreme
- High Z (>2.0) = OBV overbought, expect pullback
- Low Z (<-2.0) = OBV oversold, expect bounce
3. **Confirm:** Wait for crossover signal to enter
4. **Target:** Outer zone of opposite side or zero line
**Best For:** Range trading, mean reversion, experienced traders only
---
## Reading the Indicator in Different Markets
### **Strong Uptrend**
- OBV consistently above signal line (green)
- OBV well above zero line, rising higher lows
- Z-Score positive, trending upward
- **Action:** Buy dips to signal line, sell at resistance
### **Strong Downtrend**
- OBV consistently below signal line (red)
- OBV well below zero line, making lower highs
- Z-Score negative, trending downward
- **Action:** Sell rallies to signal line, cover at support
### **Consolidation/Choppy Market**
- OBV whipsaws around signal line frequently
- Crossovers occur every few bars
- Z-Score oscillating between -1 and +1
- **Action:** Increase confirmation bars to 3-4, or switch to strength-based filter
### **Accumulation (Bottom Formation)**
- OBV rising while price is flat or falling
- Volume flowing in despite downtrend (bullish divergence)
- Z-Score climbing while price lows hold
- **Action:** Expect breakout up; prepare buy near support
### **Distribution (Top Formation)**
- OBV falling while price is flat or rising
- Volume flowing out despite uptrend (bearish divergence)
- Z-Score falling while price continues higher
- **Action:** Expect breakdown down; prepare short near resistance
---
## Parameter Tuning Guide
### **Aggressive Settings (More Signals)**
- Smoothing Length: 14
- Signal Filter: None or Confirmation Bars: 1
- Min Z-Score: 0.1
- Best for: Day trading, high volatility stocks
- Risk: More false signals
### **Balanced Settings (Recommended)**
- Smoothing Length: 21
- Signal Filter: Confirmation Bars: 2
- Min Z-Score: 0.3
- Best for: Swing trading, most market conditions
- Risk/Reward: Moderate
### **Conservative Settings (Fewer Signals)**
- Smoothing Length: 30-40
- Signal Filter: Confirmation Bars: 3-4 or Strength-Based: 0.7+
- Min Z-Score: 0.8
- Best for: Position trading, high-conviction trades only
- Risk: May miss some moves
---
## Common Questions & Troubleshooting
**Q: Why are there more sell signals than buy signals?**
A: This reflects the actual market action. Markets often decline faster than they rise (fear > greed). Confirm signals with price action and support/resistance.
**Q: The indicator keeps whipsawing, should I hide it?**
A: Increase Confirmation Bars to 3-4 or switch to Strength-Based filter. Market conditions matter—choppy markets require stricter filters.
**Q: What's the difference between normalized and raw OBV?**
A: Normalized (detrended) shows shorter-term momentum by removing long-term trends. Raw OBV shows absolute accumulation/distribution over the full period. Use normalized for swing signals, raw for trend confirmation.
**Q: My signals come too late. How do I get faster entry?**
A: Reduce Smoothing Length (try 14 instead of 21), use EMA instead of SMA, or set Confirmation Bars to 1. Trade-off: More false signals.
**Q: Can I use this for day trading?**
A: Yes, on 1m-5m charts with aggressive settings. Use Confirmation Bars: 1 and focus on Z-Score > 0.5 entries only.
**Q: Should I trade every signal?**
A: No. Filter signals using: price near support/resistance, multiple indicators confirming, and Z-Score showing momentum. Best signals occur at key levels.
---
## Best Practices
1. **Always confirm with price action:** OBV signals work best when price is near support, resistance, or moving average. Don't trade signals in a vacuum.
2. **Use volume context:** Check if volume is increasing or decreasing on the signal. Strong signals have volume confirmation (increasing volume on OBV spikes).
3. **Adjust settings per timeframe:**
- 1m-5m: Smoothing 12, Confirmation 1, Z-Score 0.2
- 15m-1h: Smoothing 20, Confirmation 2, Z-Score 0.3
- 4h-1d: Smoothing 25, Confirmation 3, Z-Score 0.5
4. **Watch the zero line:** It's your friend. OBV behavior at the zero line reveals trend strength. Bounces = healthy trend. Breaks = reversal.
5. **Risk management:** No indicator is perfect. Use proper position sizing and stop losses. OBV should confirm your thesis, not be the only reason to trade.
6. **Combine with other indicators:**
- Price moving averages for trend confirmation
- RSI or Stochastic for overbought/oversold levels
- Support/resistance for entry/exit zones
- MACD for momentum divergences
---
## Disclaimer
This indicator is for educational and informational purposes only. It is not financial advice. Past performance does not guarantee future results. Always conduct your own research and consult with a financial advisor before making trading decisions. Trading carries risk, including potential loss of principal.
---
## Version History
**Version 1.0** - Initial release with enhanced signal filtering, Z-Score analysis, and customizable parameters.

Golden Cross RSI Daily Helper (US Stocks)//@version=5
indicator("Golden Cross RSI Daily Helper (US Stocks)", overlay=true, timeframe="D", timeframe_gaps=true)
//========= الإعدادات الأساسية =========//
emaFastLen = input.int(50, "EMA سريع (اتجاه قصير المدى)")
emaSlowLen = input.int(200, "EMA بطيء (اتجاه طويل المدى)")
rsiLen = input.int(14, "فترة RSI")
rsiMin = input.float(40.0, "حد RSI الأدنى للدخول", 0.0, 100.0)
rsiMax = input.float(60.0, "حد RSI الأعلى للدخول", 0.0, 100.0)
slBufferPerc = input.float(1.5, "نسبة البفر لوقف الخسارة (%) أسفل/أعلى EMA200", 0.1, 5.0)
rrRatio = input.float(2.0, "نسبة العائد إلى المخاطرة (R:R)", 1.0, 5.0)
//========= حساب المؤشرات =========//
emaFast = ta.ema(close, emaFastLen)
emaSlow = ta.ema(close, emaSlowLen)
rsiVal = ta.rsi(close, rsiLen)
// اتجاه السوق
trendUp = emaFast > emaSlow
trendDown = emaFast < emaSlow
// ارتداد السعر من EMA50 أو EMA200 تقريبياً
bounceFromEmaFast = close > emaFast and low <= emaFast
bounceFromEmaSlow = close > emaSlow and low <= emaSlow
bounceLong = bounceFromEmaFast or bounceFromEmaSlow
bounceFromEmaFastShort = close < emaFast and high >= emaFast
bounceFromEmaSlowShort = close < emaSlow and high >= emaSlow
bounceShort = bounceFromEmaFastShort or bounceFromEmaSlowShort
// فلتر RSI
rsiOk = rsiVal >= rsiMin and rsiVal <= rsiMax
//========= شروط الدخول =========//
// شراء
longSignal = trendUp and bounceLong and rsiOk
// بيع
shortSignal = trendDown and bounceShort and rsiOk
//========= حساب وقف الخسارة والأهداف =========//
// نستخدم سعر إغلاق شمعة الإشارة كسعر دخول افتراضي
entryPriceLong = close
entryPriceShort = close
// وقف الخسارة حسب EMA200 + البفر
slLong = emaSlow * (1.0 - slBufferPerc / 100.0)
slShort = emaSlow * (1.0 + slBufferPerc / 100.0)
// المسافة بين الدخول ووقف الخسارة
riskLong = math.max(entryPriceLong - slLong, syminfo.mintick)
riskShort = math.max(slShort - entryPriceShort, syminfo.mintick)
// هدف الربح حسب R:R
tpLong = entryPriceLong + rrRatio * riskLong
tpShort = entryPriceShort - rrRatio * riskShort
//========= الرسم على الشارت =========//
// رسم المتوسطات
plot(emaFast, title="EMA 50", color=color.new(color.blue, 0), linewidth=2)
plot(emaSlow, title="EMA 200", color=color.new(color.orange, 0), linewidth=2)
// تلوين الخلفية حسب الاتجاه
bgcolor(trendUp ? color.new(color.green, 92) : trendDown ? color.new(color.red, 92) : na)
// إشارة شراء
plotshape(
longSignal,
title = "إشارة شراء",
style = shape.triangleup,
location = location.belowbar,
size = size.large,
color = color.new(color.green, 0),
text = "BUY")
// إشارة بيع
plotshape(
shortSignal,
title = "إشارة بيع",
style = shape.triangledown,
location = location.abovebar,
size = size.large,
color = color.new(color.red, 0),
text = "SELL")
// رسم SL و TP عند ظهور الإشارة
slPlotLong = longSignal ? slLong : na
tpPlotLong = longSignal ? tpLong : na
slPlotShort = shortSignal ? slShort : na
tpPlotShort = shortSignal ? tpShort : na
plot(slPlotLong, title="وقف خسارة شراء", color=color.new(color.red, 0), style=plot.style_linebr)
plot(tpPlotLong, title="هدف شراء", color=color.new(color.green, 0), style=plot.style_linebr)
plot(slPlotShort, title="وقف خسارة بيع", color=color.new(color.red, 0), style=plot.style_linebr)
plot(tpPlotShort, title="هدف بيع", color=color.new(color.green, 0), style=plot.style_linebr)
//========= إعداد التنبيهات =========//
alertcondition(longSignal, title="تنبيه إشارة شراء", message="إشارة شراء: ترند صاعد + ارتداد من EMA + RSI في المنطقة المسموحة.")
alertcondition(shortSignal, title="تنبيه إشارة بيع", message="إشارة بيع: ترند هابط + ارتداد من EMA + RSI في المنطقة المسموحة.")

Vassago & Tesla Ex-Machina 197 45 21 [Hakan Yorganci]Vassago & Tesla Ex-Machina 197 45 21
"Any sufficiently advanced technology is indistinguishable from magic." — Arthur C. Clarke
🌑 The Genesis: Algorithmic Esotericism
This script is not merely a technical indicator; it is a digital artifact born from the convergence of Software Engineering and Hermetic Tradition.
As a developer and researcher dedicated to "Technomancy"—the study of applying esoteric logic to computational systems—I designed this algorithm using a custom, experimental programming environment I am currently developing. My goal was to move beyond standard, arbitrary financial inputs (like the default 200 SMA or 14 RSI) and instead derive parameters based on Universal Harmonics and Historical Archetypes.
This indicator, Ex-Machina, is the result of that transmutation. It applies ancient numeric precision to modern market chaos.
🔢 Decoding the Protocol: 197 - 45 - 21
Why these specific numbers? They were not chosen randomly; they were calculated through specific harmonic reductions to filter out market noise.
1. The Harmonic Trend (Tesla Protocol)
* The Logic: Standard analysis uses the 200-period Moving Average simply out of habit. However, applying Nikola Tesla’s 3-6-9 vibrational principles, the engine reduced the period to 197.
* The Numerology: 1+9+7 = 17 \rightarrow 1+7 = \mathbf{8}. In esoteric numerology, 8 represents infinite power, authority, and financial flow. This creates a baseline that aligns more organically with market accumulation than the static 200.
2. The Hidden Dip (Solomonic Sight)
* The Archetype: Based on the attributes of Vassago, the archetype of discovering "hidden things," the algorithm identified 45 as the precise threshold for a "Sniper Entry."
* The Function: Unlike the standard 30 RSI, this level identifies the exact moment a correction matures within a bullish trend—catching the dip before the crowd returns.
3. The Prophetic Vision
* The Logic: Using the Fibonacci Sequence, the indicator projects the support line 21 bars into the future.
* The Utility: This allows you to visualize where the support will be, granting you foresight before price action arrives.
⚖️ The Dual Mode Engine: Sealed vs. Living
Respecting the user's will, I have engineered this script as a Hybrid System. You can choose how the "spirit" of the code interacts with the market via the settings menu.
1. The Sealed Ritual (Default - Unchecked)
* Philosophy: "Trust in the Constants."
* Behavior: Strictly adheres to the 197 SMA and 45 RSI.
* Visual: Displays a Blue Trend Line.
* Best For: Traders who value stability, long-term trends, and the unyielding nature of harmonic mathematics.
2. The Living Spirit (Adaptive Mode - Checked)
* Philosophy: "As the market breathes, so does the code."
* Behavior:
* Transmutation: The trend line shifts from a Simple Moving Average (SMA) to an Exponential Moving Average (EMA 197) for faster reaction.
* Adaptive Volatility: The RSI entry level (45) becomes dynamic. It expands and contracts based on ATR (Average True Range). In high volatility, it demands a deeper dip to trigger a signal, protecting you from fake-outs.
* Visual: Displays a Fuchsia (Pink) Trend Line.
* Best For: Volatile markets (Crypto/Forex) and traders who want the algorithm to "sense" the fear and greed in the air.
⚙️ How to Trade
* Timeframe: Optimized for 4H (The Builder) and 1D (The Architect).
* The Signal: Wait for the "EX-MACHINA ENTRY" label. This signal manifests ONLY when:
* Price is holding above the 197 Harmonic Trend.
* Momentum crosses the Optimized Threshold (45 or Adaptive).
* Trend Strength is confirmed via ADX.
Author's Note:
I built this tool for those who understand that code is the modern spellbook. Use it wisely, risk responsibly, and let the harmonics guide your entries.
— Hakan Yorganci
Technomancer & Full Stack Developer

Wheel Strategy SMAsPlots the 200 SMA and 50 SMA- For CSP, look for a strike price that is at or just below teh 200 sma
