BOS mark-out (by Lumiere)Advanced BOS Detection with Strict Swing Confirmation
This indicator implements BOS detection with several unique features:
🔹 Dual-Candle Swing Validation - Unlike most BOS indicators that use single candle swings, this uses a two-candle confirmation for swing highs/lows, analyzing both the candle wicks and body transitions.
🔹 Directional Lock System - Implements a state machine that prevents duplicate signals until an opposite-direction BOS occurs, reducing noise.
🔹 Precision Wick Analysis - Compares wicks between the reversal candle and confirmation candle to identify the true swing point.
🔹 Real-Time Update & Live Market Adaptation – The indicator continuously monitors price action and instantly updates BOS signals as new candles form, ensuring you never miss a BOS.
How It Differs From Other BOS Indicators:
Most public BOS indicators use simple HH/HL or LH/LL detection.
Many don't implement the directional locking mechanism.
Few use the two-candle wick comparison approach.
Wick-Based Precision uses the extreme wicks of two candles (not just the body).
Strict Confirmation requires a close beyond the swing point (no "wick breaks" counted).
Usage Examples:
🟦 Bullish BOS:
A green candle closes, followed by a red candle. This will be the new high, and if the next candle closes above the highest wick of those two, it will be a BOS (only if we had a bearish BOS before)
🟥 Bearish BOS:
A red candle closes, followed by a green candle. This will be the new low, and if the next candle closes below the lowest wick of those two, it will be a BOS (only if we had a Bullish BOS before)
"BOS"に関するスクリプトを検索

BOS and CHoCHThe market never moves in a straight line. It moves in waves.
It makes a High, comes down a bit (Low), then breaks the previous High to make a new High.
Similarly, It makes a Low, goes up a bit (High), then breaks the previous Low to make a new Low.
BOS (Break Of Structure) - Trend Continuation
BOS means the market is continuing its current trend. If the market is in an Uptrend and breaks the old "High" -> Bullish BOS. If the market is in a Downtrend and breaks the old "Low" -> Bearish BOS.
3. CHOCH (Change Of Character) - Trend Reversal
CHOCH means the mood of the market has changed. For the first time, the trend has shifted its nature.
Bullish to Bearish CHOCH: The market was making Higher Highs, but suddenly it broke its previous "Low". Now the market can fall.
Bearish to Bullish CHOCH: The market was falling (Lower Lows), but suddenly it broke its previous "High". Now the market can rise.
BOS: Confirms the trend (Breaking the ceiling to go higher).
CHOCH: Signals a trend change (Slipping and falling below the previous floor).

BOS & CHoCH (v6, UA)The logic of the trading strategy
This is a well-structured and concise summary of a trading strategy based on market structure analysis. Here is the English translation.
Swings
ta.pivothigh/low on a selected structure timeframe (TF). When a swing is confirmed, we fix the level and the bar_index of the current chart as an anchor for a horizontal line.
BOS (Break of Structure)
A breakout of the last Swing High (SH) or Swing Low (SL) in the direction of the current trend.
CHoCH (Change of Character)
A breakout against the trend, signaling a potential trend reversal.
Breakout
By close or by high/low (you can switch the breakout confirmation mode to closing price).

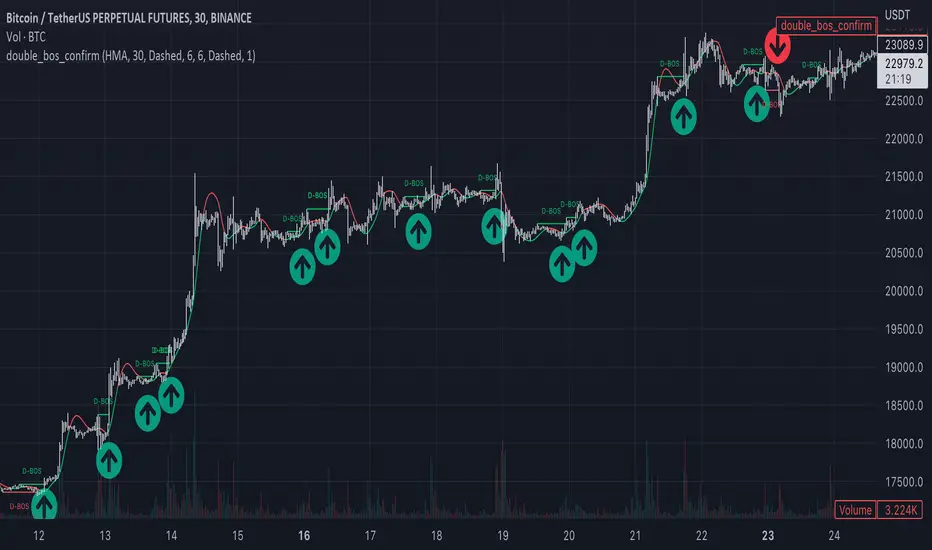
Market Structure Double BOS Confirm
🔥 Overview
🎯 This Double BOS(Break Of Structure) Confirm indicator combined ma-based BOS and classic BOS
to achieve a more credible BOS signal . it works well in most symbols with 2 parameters finetune.
🎯 It's a enhanced version compare with previous script.
🎯 at the same time, I keep D-BOS and BOS separately, you can use them in combination freely.
🔥 Indicator design logic
🎯 there are 3 parts in this indicator.
Part 1: MA-Based BOS
1. use close-in EMA's highest/lowest value mark as SWING High/Low when EMA crossover/under,
not use func ta.pivothigh()/ta.pivotlow()
2. once price reaching EMA’s SWING High/Low, draw a line link High/Low to current bar, labled as BOS
3. more MA-Based BOS details can get from my previous script.
Part 2: Classic BOS
1. use pivothigh/low function to find pivot (decided by left/right swing length)
2. when get new pivothigh, compare with previous high, calculate HH/LH/HL/LL result
3. once bar closed and break pivothigh then labed as BOS
Part 3: Double BOS Confirms
1. when MA-Based BOS and Classic BOS occured at the same bar closed signed as D-BOS
2. when two BOS events one bar apart, signed as D-BOS
🔥 Settings
🎯 there are 13 input properties in script, 4 properties(Bold field) have an impact on the results and the other 9 show display effects.
GRP1
MA_Type : MA type you can choose(EMA/RMA/SMA/HMA/WMA/VWMA), default is HMA
short_ma_len : MA length of your current timeframe on chart, default 30
show_ma_bos_line: whether show ma-based BOS line, default false
GRP2
left_swing_len : pivothigh(source, left,right), it‘s left swing length
right_swing_len : right swing length
show_pivot_bos_line: whether show pivot-based BOS line, default false
GRP3
show_double_bos_line: show double_bos_line, default true
double_bos_linewidth: linewidth, default 2 (Bold line)
double_bos_linestyle: default Dashed
🔥 Usage
🎯 BOS signal usually worked fine in high volatility market, low volatility is meaningless.
🎯 D-BOS will filtered much more signals than ma-based BOS and classic BOS
We can see that it performs well in trending market of different symbols, and BOS is an opportunity to add positions,
D-BOS will filtered much more signals
Double-BOS Confirm : BINANCE:BTCUSDTPERP 30m
MA-Based BOS : BINANCE:BTCUSDTPERP 30m
🎯 Support classic HH/HL label, MA-Based Zigzag
🎯 You can use only D-BOS, MA-BOS or Classic-BOS alone, or D-BOS and one of the other, it's up to you,
but my personal preference is to use D-BOS and MA-BOS in combination
🎯 any questions or suggestion please comment below, I would appreciate it greatly.
Additionally, I plan to publish 20 profitable strategies in 2023; indicatior not one of them,
let‘s witness it together!
Hope this indicator will be useful for you :)
enjoy! 🚀🚀🚀
SMC BOS - Structure Breaks & Median Continuation ProjectionsThis tool shows what usually happens after a Break of Structure (BOS).
It scans past BOS events on your chart, finds the ones most similar to the latest break (using ATR to filter by volatility), and then plots the median continuation path.
Optional percentile bands (P10–P90) display the possible range of outcomes around the median.
Key features:
• Automatic detection of bullish and bearish BOS events
• Library of past BOS with adjustable size and spacing
• ATR-based similarity and recency weighting
• Median continuation projections with optional percentile bands
• Customizable colors, signals, and stats table
• Works on any market and timeframe
Use cases:
• See how price typically behaves after a BOS
• Support SMC analysis with data-driven projections
• Improve trade planning by visualizing likely continuations
• Apply across crypto, forex, stocks, and futures
Originality:
Instead of only marking BOS, this script learns from history and projects forward the median path of the most similar past cases, adjusted for volatility. It turns BOS signals into practical continuation scenarios.
Instructions:
Add the indicator to your chart. When a BOS is detected, the projection is drawn automatically.
Use the settings to adjust the library, ATR weighting, projection style, percentile bands, and the display of signals or stats.
For questions or customization, contact Julien Eche (Julien_Eche) on TradingView.

Market Structure ICT Screener [TradingFinder] BoS ChoCh🔵 Introduction
Market Structure is the foundation of every Smart Money and ICT based trading model. It describes how price moves through a sequence of highs and lows, forming clear phases of expansion, retracement and reversal. Understanding this structure allows traders to read institutional order flow and align their positions with the true direction of liquidity.
Two of the most critical components in Market Structure are the Break of Structure (BOS) and Change of Character (CHOCH). A BOS represents trend continuation, confirming strength within the current direction. In contrast, CHOCH also known as a Market Structure Shift (MSS) signals the first sign of a trend reversal or liquidity shift where order flow begins to change from bullish to bearish or vice versa.
Because the market is fractal, structure can exist at multiple levels known as Major (External) and Minor (Internal). Major structure defines the overall trend on higher timeframes while minor or internal structure reveals short term swings and early reversals within that larger move.
🔵 How to Use
Understanding Market Structure starts with identifying how price interacts with previous swing highs and swing lows. Every trend in the market, whether bullish or bearish, is built from a sequence of impulsive and corrective moves. Impulsive legs show strong displacement in the direction of liquidity flow, while corrective legs represent temporary pullbacks as the market rebalances before the next expansion. Recognizing these sequences is essential for reading the story of price and anticipating what may happen next.
A Break of Structure (BOS) occurs when price decisively moves beyond a previous structural point by breaking above the last high in an uptrend or falling below the last low in a downtrend. This event confirms that the current trend remains intact and that liquidity has been successfully taken from one side of the market. A BOS acts as confirmation of continuation and reflects strength within the existing directional bias.
A Change of Character (CHOCH) appears when price violates structure in the opposite direction of the prevailing trend. This is the first signal that market sentiment and order flow may be shifting. For example, during a downtrend if price breaks above a previous high, it indicates that sellers are losing control and a potential bullish reversal may be developing. In an uptrend, when price drops below a recent low, it suggests a possible bearish transition.
Because the market is fractal, structure exists across multiple layers. Major structure reflects the dominant movement visible on higher timeframes and defines the broader directional bias. Minor or internal structure represents smaller swings within that move and helps identify early transitions before they appear on the higher timeframe. When internal and external structures align, they offer a high probability signal for trend continuation or reversal.
By observing BOS and CHOCH across both internal and external structures, traders can clearly visualize when the market is expanding, contracting or preparing to shift direction. This structured understanding of price movement forms the foundation for precise trend analysis and high quality decision making in any Smart Money or ICT based trading approach.
🔵 Settings
🟣 Display Settings
Table on Chart : Allows users to choose the position of the signal dashboard either directly on the chart or below it, depending on their layout preference.
Number of Symbols : Enables users to control how many symbols are displayed in the screener table, from 10 to 20, adjustable in increments of 2 symbols for flexible screening depth.
Table Mode : This setting offers two layout styles for the signal table :
Basic : Mode displays symbols in a single column, using more vertical space.
Extended : Mode arranges symbols in pairs side-by-side, optimizing screen space with a more compact view.
Table Size : Lets you adjust the table’s visual size with options such as: auto, tiny, small, normal, large, huge.
Table Position : Sets the screen location of the table. Choose from 9 possible positions, combining vertical (top, middle, bottom) and horizontal (left, center, right) alignments.
🟣 Symbol Settings
Each of the 20 symbol slots comes with a full set of customizable parameters :
Symbol : Define or select the asset (e.g., XAUUSD, BTCUSD, EURUSD, etc.).
Timeframe : Set your desired timeframe for each symbol (e.g., 15, 60, 240, 1D).
Pivot Period : Set the length used to detect swing highs and lows. Shorter values increase sensitivity, longer ones focus on major structures.
🔵 Conclusion
Mastering Market Structure and understanding the relationship between BOS and CHOCH allows traders to see the market with greater clarity and confidence. These two elements reveal how liquidity moves through different phases of expansion and retracement and how institutional order flow shifts between accumulation and distribution.
By analyzing both internal and external structures, traders can align short term and long term perspectives and anticipate where price is most likely to react. The ability to read these structural shifts helps identify continuation points, reversals and areas where liquidity is engineered or collected.
Incorporating Market Structure into a consistent trading process transforms the way a trader views the chart. Instead of reacting to random movements, each swing, break and shift becomes part of a logical framework that reflects the true behavior of the market. Understanding BOS and CHOCH is not just a concept but a complete language of price that guides every professional decision in Smart Money and ICT based trading.

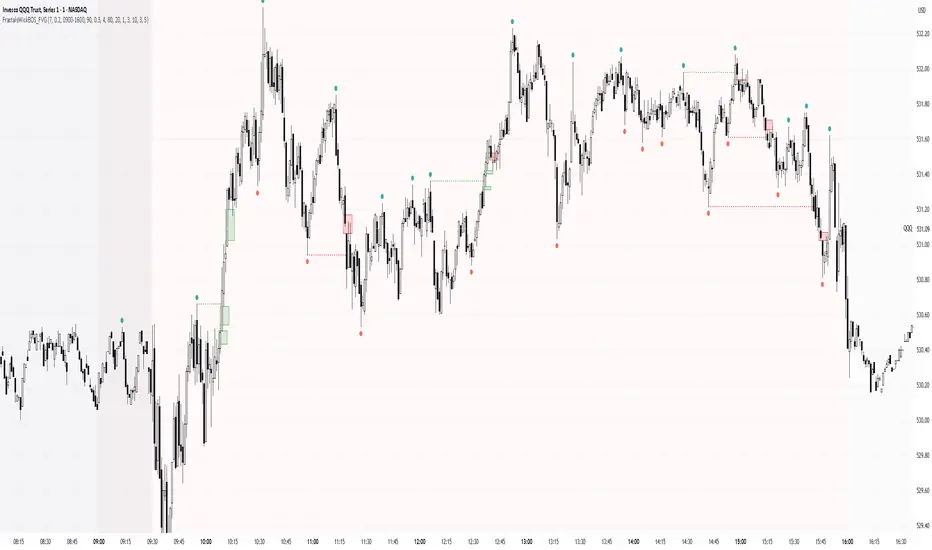
Simple Fractals with Wick Filter & BOSThis advanced fractal indicator combines traditional Williams Fractal analysis with sophisticated wick filtering and Break of Structure (BOS) detection to identify high-probability reversal points and structural breaks in price action.
🔍 How It Works
Fractal Detection: Uses the classic Williams Fractal methodology to identify swing highs and lows. A fractal high occurs when a candle's high is greater than N periods before and after it. Similarly, a fractal low occurs when a candle's low is lower than N periods on both sides.
Wick Filtering: Only displays fractals where the rejection wick meets a minimum threshold, ensuring the fractal represents genuine price rejection rather than minor fluctuations.
Break of Structure (BOS): Monitors when strong candles close beyond previous fractal levels within a specified lookback period, indicating potential trend changes or continuation patterns.
⚙️ Parameter Guide
Periods (Default: 7) - Controls fractal sensitivity
Wick Threshold (Default: 0.4 / 40%) - Minimum wick size relative to total candle range
BOS Lookback Bars (Default: 90) - How far back to monitor fractal levels for potential breaks
Strong Candle Body % (Default: 0.5 / 50%) - Minimum body size required to trigger BOS, Higher values reduce false signals but may miss some valid breaks
📊 Visual Elements
Colored Dots: Small circles mark validated fractals
Top Wick Fractals: Customizable color (default red) above bars
Bottom Wick Fractals: Customizable color (default green) below bars
BOS Lines: Dotted horizontal lines connecting fractal origin to break point
Green Lines: Bullish BOS (price closes above fractal high)
Red Lines: Bearish BOS (price closes below fractal low)
Faded Fractals (Optional): Shows all fractals that didn't meet wick requirements for comparison
🔔 Alerts
The indicator includes built-in alerts for:
High fractal formation with sufficient wick
Low fractal formation with sufficient wick
Market Structure Inducements ICT [TradinFinder] CHoch BOS Sweeps🔵 Introduction
Market Structure is the foundation for identifying trends in the market, crucial in technical analysis and strategies like ICT and SMC. Understanding key concepts such as Break of Structure (BOS) and Change of Character (CHOCH) helps traders recognize critical shifts in the market. BOS, referring to a Market Structure Change (BMS), and CHOCH or Market Structure Shift (MSS) signal trend reversals in the market.
Additionally, the concept of Inducement, a vital tool in Smart Money strategies, allows traders to avoid price traps. Identifying valid pullback, valid inducement, POI, and Liquidity Grab helps traders find optimal entry and exit points and leverage Smart Money movements effectively.
Bullish Market Structure :
Bearish Market Structure :
🔵 How to Use
The Market Structure indicator is designed to help traders better understand market structure and detect price traps. By using this indicator, you can identify the right entry and exit points based on structural changes in the market and avoid unprofitable trades. Below, we explain the key concepts and how to apply them in trading.
🟣 Market Structure
Market Structure refers to the overall pattern of price movement in the market. Using this indicator, traders can identify uptrends and downtrends and make better trading decisions based on changes in market structure. The two key concepts here are Break of Structure (BOS) and Change of Character (CHOCH).
Change of Character (CHOCH) : CHOCH occurs when the market shifts from an uptrend to a downtrend or vice versa. These changes typically indicate a broader trend reversal, and the indicator assists you in identifying them accurately.
Break of Structure (BOS) : When the market breaks a key support or resistance level, it signals a change in market structure. This indicator helps you identify these breakouts in time and take advantage of trading opportunities.
🟣 Inducement
Inducement refers to price traps set by Smart Money to trick retail traders into making the wrong trades. This indicator helps you recognize these traps and avoid unprofitable trades.
Valid Inducement : Valid Inducement refers to deliberately created price traps by major market players to gather liquidity from retail traders. Once the market has collected sufficient liquidity, it makes the real move, and professional traders use this moment to enter.
🟣 Valid Pullback
A Valid Pullback refers to a temporary market retracement, indicating a price correction within the main trend. This concept is crucial in technical analysis as it helps traders enter trades at the right time and profit from the continuation of the trend. The Market Structure indicator can identify these valid retracements, allowing traders to enter trades with greater confidence.
🟣 Point of Interest (POI)
Another important concept in market analysis is the Point of Interest (POI), referring to key price areas on the chart. POI includes zones where significant price movements are likely to occur. The Market Structure indicator helps you locate these key points and use them as entry signals for trades.
🟣 Liquidity Grab
Liquidity Grab refers to a scenario where the market intentionally moves to areas where retail traders' stop losses are placed. The goal is to gather liquidity, allowing major players to execute trades at better prices. By using this indicator, you can spot these liquidity grabs and avoid falling into price traps.
🔵 Setting
ChoCh Detector Period : The period of identifying the major market levels that occur when they break ChoCh.
BoS & Liquidity Detector Period : The period of identifying minor levels, which are used to identify BoS and Liquidity levels.
Inducement Detector Period : The period of identification of Inducement levels.
Fast Trend Detector : This feature will help you update the major market structure levels sooner.
Inducement Type Detector : Two modes "Sweeps" and "Total" can be used to identify the levels of Inducement. In "Sweeps" mode only Levels detected by touch shadow. In "Total" mode, all Levels are detected.
🔵 Conclusion
In financial market analysis and forex trading, identifying Market Structure and Inducement is crucial. Market Structure helps you detect uptrends and downtrends, and understand Break of Structure (BOS) and Change of Character (CHOCH). The concept of Inducement also enables traders to spot Smart Money price traps and avoid unprofitable trades.
The Market Structure indicator is a powerful tool that, by analyzing the market structure and concepts like valid pullback and valid inducement, helps you make more precise trade entries. Additionally, by identifying POI and Liquidity Grab, the indicator gives you the ability to spot key market zones and use them to your advantage in trading.

Hassi XAUUSD Advanced FVG EMA/BOS/RSI/Volume + Session FilterWhat it does :
This strategy automates a popular ICT-style idea on XAUUSD (Gold): trade only when price taps back into a Fair Value Gap (FVG), but filter entries with trend, structure, momentum, volume, and session rules. It manages risk with fixed TP/SL (points) and shows a compact backtest panel on chart.
Core Logic
1) Market Structure (BOS)
Detects recent swing highs/lows and flags a Break of Structure:
BOS Up when price breaks the latest swing high.
BOS Down when price breaks the latest swing low.
2) FVG Detection (3-candle)
Bullish FVG when low > high and low > high .
Bearish FVG when high < low and high < low .
The most recent qualifying gap is drawn as a shaded box (optional).
3) Bias & Filters
Trend Bias: price vs EMA (default 200). Longs only above EMA; shorts only below.
Momentum: optional RSI filter (default 14); avoid longs in OB & shorts in OS.
Volume: optional filter requiring current volume > SMA(20) × multiplier.
Sessions: optional London / New York (PKT) time windows.
Entries & Exits
Long Entry (all must be true)
Above EMA, RSI bullish, volume ok, session ok, BOS Up.
A recent Bullish FVG exists (within N bars).
Price taps back into the FVG (low ≤ top & close > bottom) with a bullish candle.
Short Entry (mirror)
Below EMA, RSI bearish, volume ok, session ok, BOS Down.
A recent Bearish FVG exists (within N bars).
Price taps (high ≥ bottom & close < top) with a bearish candle.
Risk / R:R
Exits use fixed points on XAUUSD (default TP 100, SL 50).
On many gold feeds 1.0 = 10 points; inputs convert to price automatically.
“One-trade-at-a-time”: a new signal won’t fire until the previous position is flat.
Chart Labels
On entry, the script plots BUY/SELL plus fixed TP/SL lines & labels anchored to the entry bar (they don’t drift with price).
Visuals & Tools
EMA line (green/red by bias).
Swing points (tiny triangles) to see structure.
FVG boxes (green/red, optional).
Session shading (subtle blue overlay).
Stats Panel (top-right):
Total Trades, TP Hits, SL Hits, Win Rate, Profit Factor, Net P&L.
Inputs (quick guide)
EMA Length (default 200)
Swing Lookback for BOS (default 5)
FVG Box Length (how far the zone extends to the right)
TP / SL (points) for XAUUSD + display Risk:Reward
Sessions (PKT): London & New York windows + toggle
Filters: Volume (multiplier), RSI (length, OB/OS)
Visibility: show/hide FVG boxes & TP/SL drawings
Alerts
Buy Signal / Sell Signal on valid entries
Position Opened / Position Closed notifications
Best Practices & Notes
Designed for XAUUSD 15-minute. You can test other timeframes, but retune TP/SL points and filters accordingly.
Broker ticks differ: if your symbol steps are not 0.1, adjust TP/SL points.
Use with a HTF confluence (e.g., D1/4H bias, key S/R, news awareness).
Backtests are approximations; real results vary with spreads, slippage, and execution.
Disclaimer: This tool is for educational purposes. It is not financial advice. Always test before using on live capital.

Market Structures + ZigZag [TradingFinder] CHoCH/BOS - MSS/MSB🟣 Introduction
🔵 Market Structure
Grasping market structure entails examining market behavior. Essentially, market structure refers to the formation and progression of the market within its trends.
Market structures are generally fractal and nested, leading us to classify them into internal (minor) and external (major) structures. There are several definitions of market structure, with differing perspectives such as Smart Money and ICT offering their own interpretations.
🔵 Zig Zag
The Zigzag indicator is a lagging tool that identifies points on a price chart where significant changes occur compared to the previous wave. By connecting these points, it helps traders detect trends.
This indicator minimizes random price fluctuations, aiming to clarify the primary price trend.
Pivots are points on a price chart where the direction changes. Also known as reversal points, pivots form when supply and demand forces overpower one another.
There are various types of technical analysis pivots, which can be divided into two categories: minor pivots and major pivots, each with distinct significance in analysis.
Major Pivot : These pivots signify substantial changes in the chart's direction and occur at the end of trends. Analysts focusing on primary analysis prioritize major pivot points. In fact, most technical analysis tools are evaluated and based on major pivots.
Minor Pivot : These pivots highlight smaller, subsidiary points and directions, appearing at the end of corrections. Analysts who focus on minor pivots represent small trends. It's important to note that minor pivots are not suitable for use in primary technical tools.
Identifying Minor and Major Pivots :
Minor pivots are formed between two major pivots and do not break the opposing major pivot. (Internal Pivot)
Major pivots are those that either successfully break the opposing pivot or move beyond the previous pivot of the same type. (External Pivot)
🟣 How to Use
🔵 Identifying Break of Structure (BOS)
In a given trend, such as a downtrend, a Break of Structure occurs when the price drops below the previous low and forms a new low (LL). In an uptrend, a BOS (MSB) happens when the price rises and exceeds the last high.
To confirm a trend, at least one BOS is required. The break above or below the previous high or low must be validated by the closing of at least one candle beyond that level.
🔵 Identifying Change of Character (CHOCH)
Change of Character (CHOCH) is an essential concept in market structure analysis, indicating a trend change. In other words, a trend concludes with a CHOCH (MSS). For example, in a downtrend, the price declines with BOS.
While BOS highlights the trend's strength, a CHOCH occurs when the price rises and surpasses the last high, signaling a transition from a downtrend to an uptrend.
This does not imply immediately entering a buy trade; instead, it is prudent to wait for a BOS in the upward direction to confirm the uptrend.
Unlike BOS, confirming a CHOCH does not require a candle to close; simply breaking above or below the previous high or low with the candle's wick is sufficient. The following examples illustrate bearish and bullish CHOCH.
Terms :
Market Structure Shift = MSS
Market Structure Break = MSB
🔵 Zig Zag
Based on identifying pivots and drawing zigzag lines, you can have different uses of this indicator.
Including :
Identifying pivot types along with major and minor recognition.
Identifying internal and external breakouts.
Identifying support and resistance levels.
Identifying Elliott Waves.
Identifying classic patterns.
Identifying pivots with higher validity.
Identifying trends and range areas.
🟣 Settings
Pivot Period Market Structure and ZigZag Line: Using this input, you can determine the pivot period for identifying swings.
Through the settings, you can customize the display, visibility, and color of each line as desired.

Market Structures SMC [TradingFinder] BOS/CHoCH Major & Minor🟣Introduction
Understanding market structure involves analyzing market behavior. In other words, market structure encompasses how the market forms and evolves within trends.
Market structures are typically fractal and nested, so we categorize them into internal (minor) and external (major) structures. There are various definitions of market structure, with different approaches such as Smart Money and ICT providing their own interpretations.
🟣How to Use
The first step in identifying market structure is to analyze key highs and lows. An uptrend is formed when highs and lows are successively higher than previous ones. Similarly, in a downtrend, lows and highs are successively lower than previous ones.
Market trends consist of two types of movements :
•Impulsive movements
•Corrective movements
Impulsive movements align with the main trend and possess high strength and momentum. Conversely, corrective movements go against the main trend and have lower strength and momentum. The following example illustrates these concepts.
🔵 Identifying Break of Structure (BOS)
In a specific trend, for example in a downtrend, when the price breaks below the previous low and forms a new low (LL), a Break of Structure occurs. In an uptrend, a BOS (Market Structure Break or MSB) happens when the price rises and surpasses the last high.
We need at least one BOS to confirm a trend. Breaking above or below the previous high or low must be confirmed by closing at least one candle after that level.
🔵 Identifying Change of Character (CHOCH)
Change of Character (CHOCH) is a key concept in market structure analysis. A change in structure signals a trend change. In other words, a trend ends with a CHOCH (Market Structure Shift or MSS). For instance, in a downtrend, the price declines with BOS.
BOS indicates the strength of the trend, but when the price increases and surpasses the last high, a CHOCH occurs, signaling a shift from a downtrend to an uptrend.
This does not mean entering a buy trade; instead, we should wait for a BOS in the upward direction to confirm the uptrend. Unlike BOS, confirming a CHOCH does not require a candle to close; simply breaking above or below the previous high or low with the candle's wick is sufficient. The following examples show bearish and bullish CHOCH.
🔵 Range Market Structure
Besides uptrends and downtrends, a third structure often found in the market is the range or sideways structure. In this state, the power of buyers and sellers is almost equal, and the market lacks a clear trend.
Many traders believe that the Forex market ranges 80% of the time. Therefore, it requires a lot of patience to wait for a new trend to start.
🟣 Settings
Through the settings, you can customize the display, visibility, and color of each line as desired.

Market Structure MA Based BOS [liwei666]
🎲 Overview
🎯 This BOS(Break Of Structure) indicator build based on different MA such as EMA/RMA/HMA, it's usually earlier than pivothigh() method
when trend beginning, customer your BOS with 2 parameters now.
🎲 Indicator design logic
🎯 The logic is simple and code looks complex, I‘ll explain core logic but not code details.
1. use close-in EMA's highest/lowest value mark as SWING High/Low when EMA crossover/under,
not use func ta.pivothigh()/ta.pivotlow()
2. once price reaching EMA’s SWING High/Low, draw a line link High/Low to current bar, labled as BOS
3. find regular pattern benefit your trading.
🎲 Settings
🎯 there are 4 input properties in script, 2 properties are meaningful in 'GRP1' another 2 are display config in 'GRP2'.
GRP1
MA_Type: MA type you can choose(EMA/RMA/SMA/HMA), default is 'HMA'.
short_ma_len: MA length of your current timeframe on chart
GRP2
show_short_zz: Show short_ma Zigzag
show_ma_cross_signal: Show ma_cross_signal
🎲 Usage
🎯 BOS signal usually worked fine in high volatility market, low volatility is meaningless.
🎯 We can see that it performs well in trending market of different symbols, and BOS is an opportunity to add positions
BINANCE:BTCUSDTPERP
BINANCE:ETHUSDTPERP
🎯 MA Based signal is earlier than pivothigh()/pivotlow() method when trend beginning. it means higher profit-loss rate.
🎯 any questions or suggestion please comment below.
Additionally, I plan to publish 20 profitable strategies in 2023; indicatior not one of them,
let‘s witness it together!
Hope this indicator will be useful for you :)
enjoy! 🚀🚀🚀

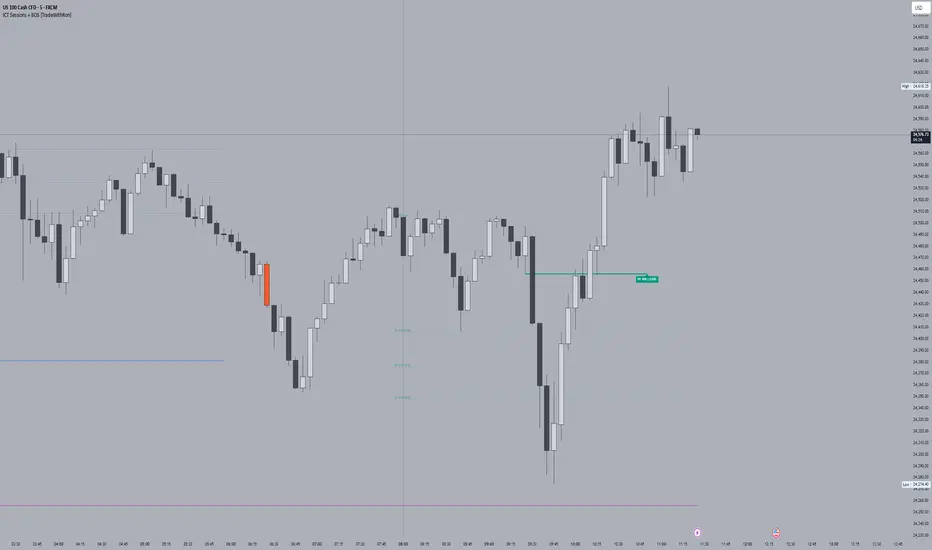
ICT Sessions With BOS [TradeWithRon]
WITH BOS
This version includes BOS with filter for each session.
NONE,FVG,CISD Filter preset
you can choose how many BOS per session, style etc.
ICT Sessions and killzones maps three intraday sessions on your chart (Asia, London, NY), tracks each session’s live high/low, draws optional session range boxes, and projects ICT OTE zones in real time—with granular styling, touch/mitigation logic, and alerting.
What it does
*Live Session high/low tracking.
Historical session lines:
When a session ends, its final High/Low are preserved as tracked lines (with optional labels) for a configurable number of recent sessions.
Session boxes (ranges):
Draws a shaded box from session start to end that expands with new highs/lows. Limit how many recent boxes remain on chart.
ICT OTE zones (live):
For the currently active session, projects user-defined Fibonacci OTE levels (e.g., 61.8%, 70.5%, 78.6) between the session’s running high and low. Zones update tick-by-tick and can show labels. You can retain a history of recent sessions’ OTE levels.
snapshot
Break visualization (mitigation):
Optionally color the bar when price breaks a stored session High/Low. You can:
Require a body close through the level (vs. any touch)
Auto-remove the line and/or label on touch/close
Use custom break colors per session and side (high/low)
Timestamps:
Add up to two recurring vertical timestamp markers (e.g., 08:00, 09:30), plus an opening horizontal marker (e.g., 09:30) with label that extends until the next occurrence.
Alerts:
Built-in alerts for:
Touch of Session 1/2/3 High/Low (Asia/London/NY)
Touch of OTE levels (per session)
Key inputs:
Time & Limits
Timezone (e.g., GMT-4)
Timeframe limit: hide all drawings on and above a specified TF
Sessions
Session windows (default):
Session 1 (Asia): 18:00–00:00
Session 2 (London): 00:00–06:00
Session 3 (NY): 08:00–12:00
How many to keep (lines/boxes)
Line width, colors, and label suffixes (“High”/“Low”)
Labels: toggle, text (“Asia”, “London”, “NY”), size, and colors
Boxes: toggle per session and background colors
ICT OTE Zones
Toggle per session (Asia/London/NY)
Levels (comma-separated %s, e.g., 61.8,70.5,78.6)
History: number of past sessions to retain
Opacity, line width/style, and label size
Custom label text per session (e.g., “Asia OTE”)
Break/Mitigation Behavior:
Enable Mitigated Candles (bar color on break)
Remove line on touch and/or remove label on touch
Require body close (vs. wick touch)
Custom break colors by session and side
Timestamps
Opening horizontal line (time, style, width, color, label text/size, drawing limit)
Two vertical timestamps (times, style, width, color, drawing limit)
Alerts
Master Enable Alerts
Per-session toggles for High/Low touches
OTE touch alerts
How it works (under the hood)
Detects session state via input.session() windows in the chosen timezone.
Live session High/Low lines and labels update in real time; on session end, final levels are stored with optional labels and tracked length.
OTE zones are live-computed from current session High↔Low and refreshed every bar; a compact rolling history is enforced.
Bar coloring reacts to break events (touch or body-close, per your setting) and uses session-specific colors when enabled.
Timestamp lines/labels are created on each occurrence and trimmed to a drawing limit for performance.
Tips:
To hide session lines but keep boxes, set line color opacity to 0.
Use Timeframe Limit to keep higher-TF charts clean.
Fine-tune OTE Levels and History to balance clarity and performance.
For stricter break logic, enable Require Body Close.
Note: The script reserves high limits for lines/labels/boxes to keep recent context visible while managing cleanup automatically. Adjust “Session Number” and “Number Of Boxes” to suit your workflow.
— © TradeWithRon
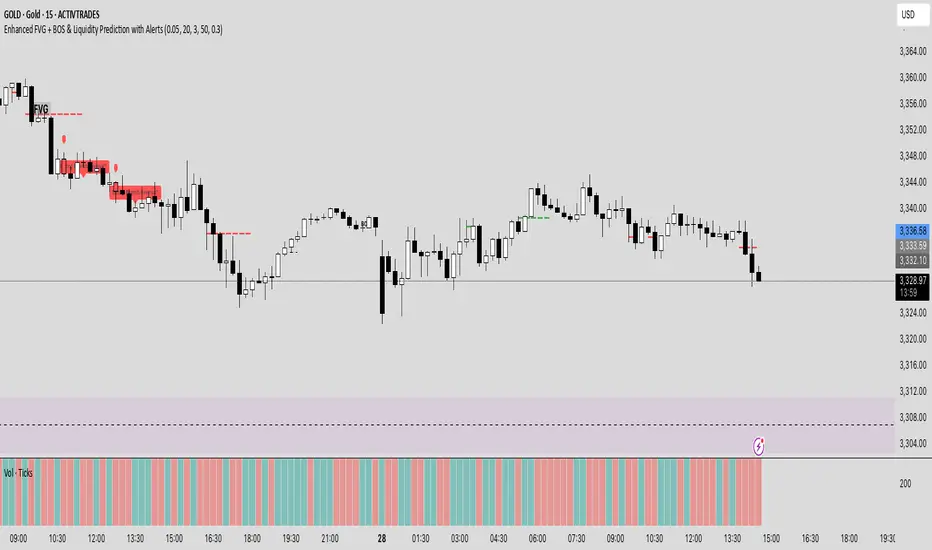
Enhanced FVG + BOS & Liquidity Prediction with Alerts### How to use:
1. Add this script to TradingView.
2. Go to the **Alerts** tab.
3. Create new alerts:
- Choose **"Enhanced FVG + BOS & Liquidity Prediction with Alerts"**.
- Select **"Bullish Reversal Alert"** or **"Bearish Reversal Alert"**.
- Set the trigger to **"Once"** or **"Every time"** based on your preference.
### Summary:
- The alerts fire when the combined signals (BOS, Liquidity Sweep, trend, candlestick pattern) strongly suggest a reversal.
- The **labels** and **shapes** give visual confirmation on your chart.
ICT Breakers (BOS / MSS - Market Structure) [ICTProTools]The Breakers (Market Structure) indicator is designed to help traders identify true breaker structures , a key concept in Inner Circle Trader (ICT) methodology. In market structure, Breakers represent powerful shifts where a key high or low is broken, leading to a reversal in market direction. Most tools misinterpret structure shifts, using internal structure , leading to fake breakouts. This tool solves that problem by filtering out false signals , providing clear & structured insights , all with multi-timeframe compatibility.
💎 Key Features
⚡️ Breakers in action
The indicator shows the structure following ICT instructions. A breaker is defined by two lines:
The first line confirms the previous trend (it could be interpreted as a BOS).
The second line highlights the moment price breaks structure (with candle body or wick based on your chosen settings), signaling a shift in trend direction (like an MSS).
Furthermore, it’s important to note that a breaker not only shows the structure, but also defines a potential Point of Interest (POI), an area where price may retrace before continuing its trend.
Here, we can observe two clear structure shifts.
On the far left, the market was in a bearish trend, illustrated by the first visible (dotted and red) line. Shortly after, the second (solid and green) line appears, showing a break that initiates a new bullish trend.
This upward movement continues, with the last confirmation marked by a top structure line. And finally, the structure is broken once again indicating a transition back into a bearish trend.
💪 Real Structure with True Highs / Lows
Unlike many indicators that detect internal breakouts , this tool follows ICT’s true market structure rules .
In a bearish trend , a bullish breaker is only confirmed when the high that created the low is broken , and conversely for a bullish scenario.
Fake breakouts are ignored, preventing misleading signals.
In the image above, the white breakout is correctly ignored by the indicator, as it doesn't align with ICT’s structural rules. That white high is simply part of the internal structure, not the true swing point. Instead, the green line highlights the key level that truly matters, the one whose rupture would have confirmed a real change in market structure.
🔔 Smart Alerts for Structure Updates
Stay one step ahead with customizable alerts designed to notify you instantly when market structure changes occur.
Get notified for BOS (Continuation) and / or MSS (Breaker) events.
Set alerts for bullish , bearish , or both directions.
Choose between once or repeated alerts , based on your strategy.
This feature allows traders to remain focused and reactive , even when monitoring multiple markets.
In the alert settings, select which structure shifts you want to be notified of. Whether you're a scalper or a swing trader, the alerts keep you connected to key moments without needing to constantly monitor the chart.
⏳ Multi-Timeframe Structure
All features of the indicator are fully compatible with higher timeframes .
Get a broader view of market structure without switching timeframes.
Monitor higher timeframe structures and receive alerts, all without leaving your analysis chart .
In this example, the market structure of the 30m timeframe is displayed while on a 5m chart, providing a clearer perspective.
✨ Customization & User Control
Make it yours! The indicator allows full customization:
Swing bars (to confirm high / low)
Select your mode for Breakers (MSS) , using the candle body only or body / wick
Line style (type, width, color)
Choice of displayed timeframe
Activate any alert , with the frequency you want
🎯 Conclusion
✅ Avoid false signals by focusing on true ICT Breakers
✅ Smart alerts to never miss a structural shift
✅ Multi-timeframe support for enhanced analysis
✅ Clean & professional design for an optimal trading experience

Market Structure CHoCH/BOS (Fractal) [LuxAlgo]The Market Structure CHoCH/BOS (Fractal) indicator is an experimental take on classical market structure, whereas fractal patterns are used for their construction instead of swing points.
Compared to utilizing swing points for highlighting market structure like our Smart Money Concepts indicator , fractal-based market structure can appear as more adaptive, however, it can also be more restrictive when it comes to returning swing points which can cause the indicator to miss reversals in some cases.
If enabled from within the settings, users can see support and resistance levels returned from the detected market structure with breakouts highlighted on the chart. Alongside this feature, an additional dashboard showing the structure to fractal structure percentage is also provided.
🔶 SETTINGS
Length: Length of the fractal patterns to detect.
🔹 Style
Bullish Structures: Show bullish structures.
Bearish Structures: Show bullish structures.
Support: Show support levels.
Resistance: Show resistance levels.
🔹 Dashboard
Show Dashboard: Show structure to fractal percentage dashboard on the chart.
Location: Location of the dashboard on the chart.
Size: Dashboard size.
🔶 USAGE
Market structure is commonly used to determine trend direction by using price positions relative to prior swing points. Using fractal patterns to determine market structure can allow users to obtain shorter, more frequent structure labels.
Market structure is commonly classified as follows:
Change of Character (CHoCH), also referred to as Market Structure Shift (MSS)
Break of Structure (BOS), also referred to as Market Structure Break (MSB)
Change of Characters indicate a shift in the market trend, confirming trend reversals. Break of Structures on the other hand occur once a trend is already determined, confirming new higher highs/lower lows.
Using higher length values allow users to detect longer-term fractals, thus highlighting longer-term market structures. The image above detects fractal patterns made of 7 candles, even if the increment is only of 2 bars this significantly reduces the amount of detected market structure labels.
The result obtained by utilizing fractals and higher settings can be a more dynamic view of market structure, however, as seen in the image above this can introduce very significant delay compared to utilizing pure swing points.
🔹 Support/Resistance
The indicator also returns support/resistance levels constructed from the market structure, these levels are obtained similarly to order blocks, finding the minimum on the interval of a bullish market structure and the maximum of a bearish market structure.
Price reaching a support/resistance level can be expected to bounce from it. Once a level is broken, the support/resistance level will no longer extend, and a circle will be displayed highlighting the break.
While utilizing this script for fractal-based market structure, these levels can be useful to ensure all swing points are still considered by the user with the possibility of the indicator missing reversals due to its calculation not being based on swing points themselves.
🔹 Dashboard
The dashboard reports the structure to fractal percentage, that is the amount of bullish/bearish market structures relative to the total amount of detected bullish/bearish fractal patterns.
This allows us to see how often a detected fractal pattern is used to display a market structure.
🔶 DETAILS
🔹 Fractals
In the context of technical analysis, Fractals refer to specific patterns that exhibit self-similarity at different scales or timeframes.
The most commonly known fractal pattern consists of a consecutive sequence of candles (more commonly 5), with the central candle being the lowest (in case of a bullish fractal) or highest (in case of a bearish fractal).
A bullish fractal has candles on the right side of the central candle with increasing lows, while candles on the left side have decreasing lows.
A bearish fractal has candles on the right side of the central candle with decreasing highs, while candles on the left side have increasing highs.
🔶 RELATED SCRIPTS
🔹 Smart Money Concepts
🔹 Market Structure Trailing Stop
🔹 ICT Concepts

BOS PullbackBOS Pullback
Trend-following indicator that detects pullbacks for entries in a continuation phase.
A green diamond above a bearish candle signals a buy opportunity in an uptrend.
A red diamond below a bullish candle signals a sell opportunity in a downtrend.
Based on a configurable moving average (EMA, SMA, WMA). Ideal for Break of Structure (BOS) or pullback trading strategies.

Rapeez's BOS IndicatorIt will highlight all the BOS (Break of Structure) points on the chart with blue and red lines, making it easier to spot them without having to analyze the chart deeply. This tool is also great for identifying the overall market trend and works across all timeframes. Updates will be provided every month.
Happy charting—hope you find it helpful!

BOS ValuationBOS Valuation Indicators
There are 8 methods of valuation:
1. Asset Stock => BVPS x Asset_MOS
Asset_MOS: Multiple (default 0.8)
Asset_MOS_BRKB: Multiple specific to BRK.B (default 1.5)
2. Dividend Stock => Dividend / Target Dividend Yield
Target Dividend Yield (%): Desired dividend yield percentage (default 4)
3. Growth Stock => EPS x Short/Mid/Long-term Minimum EPS Growth Rate G (< 30%)
Short EPS Growth years: Number of years for short-term growth reference (default 3)
Median EPS Growth years: Number of years for mid-term growth reference (default 5)
Long EPS Growth years: Number of years for long-term growth reference (default 10)
Option: EPS G (%) (< 30%): EPS Growth Rate
If -1, follow the above rules; if not, use this growth rate (default -1)
4. FCF Yield => FCF / Target FCF Yield
Target FCF Yield (%): Desired free cash flow yield percentage (default 5)
5. Relative PB => Stock Price x Average PB of Past n Years / Current PB
PB years: Number of reference years (default 5)
6. Relative PE => Stock Price x Average PE of Past n Years / Current PE
PE years: Number of reference years (default 5)
7. DCF => Calculation method referenced from Gurufocus
DCF discount rate (%) (6%~20%): Discount rate (can be WACC) (default 11)
DCF terminal FCF G (%) (< discount rate): Estimated FCF growth rate for 11~20 years (default 4)
Option: FCF G (%) (5%~20%): Estimated FCF growth rate for 1~20 years
If -1, use 10-year FCF growth rate (5%~20%); if not, use this estimated growth rate (default -1)
8. DDM => Dividend / (R - n-year Dividend Growth Rate G)
DDM R (%) (8%~12%): Discount rate (can be WACC) (default 12)
Dividend Growth years: Number of reference growth years (default 5)
Option: Dividend G (%) (5%~8%) (< R):
If -1, use the dividend growth rate of the reference growth years (5%~8%); if not, use this dividend growth rate (default -1)
BOS 估價指標
一共包含8種估價方式:
1. 資產股 => BVPS x Asset_MOS
Asset_MOS: 倍數(預設 0.8)
Asset_MOS_BRKB: 專屬於BRK.B的倍數(預設 1.5)
2. 股息股 => 股息 / Target Dividend Yield
Target Dividend Yield (%): 目標股息殖利率幾%(預設 4)
3. 成長股 => EPS x 短中長期最小EPS成長率G( < 30% )
Short EPS Growth years: 短期參考成長年數(預設 3)
Median EPS Growth years: 中期參考成長年數(預設 5)
Long EPS Growth years: 長期參考成長年數(預設 10)
Option: EPS G (%) (< 30%): EPS成長率
若為-1則使用上面的規則,若不為-1,則使用這個成長率。(預設 -1)
4. FCF殖利率 => FCF / Target FCF Yield
Target FCF Yield (%): 目標自由現金流殖利率幾%(預設 5)
5. 相對PB => 股價 x 過去n年平均PB / 現在的PB
PB years: 參考年數(預設 5)
6. 相對PE => 股價 x 過去n年平均PE / 現在的PE
PE years: 參考年數(預設 5)
7. DCF => 計算方式參考Gurufocus
DCF discount rate (%) (6%~20%): 折現率(可填WACC)(預設 11)
DCF terminal FCF G (%) (< discount rate): 11~20年預估FCF成長率(預設 4)
Option: FCF G (%) (5%~20%): 1~20年預估FCF成長率
若為-1則使用10年FCF成長率 (5%~20%),若不為-1,則使用這個預估成長率。(預設 -1)
8. DDM => 股息 / (R - n年股息成長率G)
DDM R (%) (8%~12%): 折現率(可填WACC)(預設 12)
Dividend Growth years: 參考成長年數(預設 5)
Option: Dividend G (%) (5%~8%) (< R):
若為-1則使用參考成長年數的股息成長率 (5%~8%),若不為-1,則使用這個股息成長率。(預設 -1)

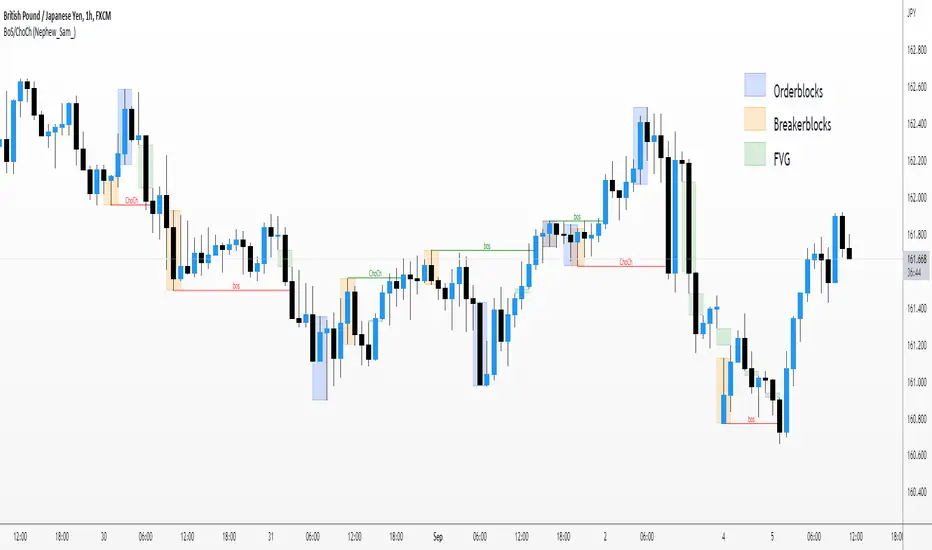
Market Structure BOS/CHOCH/MSB/FVG/OB/BB (Nephew_Sam_)This market structure indictor uses pivot points to find break of structure and change of character.
You can enable the options to find Fair Value Gaps, Breaker Blocks and Orderblocks too. The way this works is, once a bos/choch is found, it will loop back and find all fvg/ob/bb from that point until the previous pivot point.
Settings
Pivot strength - How many candles to the left/right requried to determine a swing high
Breakout Confitmation - The breakout candle should close under the previous pivot or the wick H/L should be under
Show xyz - show HH/LL, Break of structure and change of character
FVG/OB/BB - Show, bull/bear colors, extend boxes to the right, delete boxes once filled, fill type close or H/L
Super OrderBlock / FVG / BoS Tools by makuchaku & eFeThis super indicator is a Swiss army knife for Smart Money traders for OrderBlocks / FVG / BoS
It provides many options for drawing (non-repainting) boxes for OrderBlocks, Fair Value Gaps (FVG) and Break of Structures. The boxes are extended into the future, until the first retest/mitigation.
Some of the additional options (not explained in the diagrams above)
PPDD OB : An order block which is formed after interacting with Liquidity (old low/high, fractal low/high, etc). Since these OB's are in the most premium or most discount, they are Premium Premium Discount Discount OB's (PPDD OB)
HVB Bars : When the volume of any bar is higher than the average volume of last N bars, it could mean something important (in the right context). Hence, the indicator allows for coloring them differently.
This indicator was built as a collaboration between @makuchaku & eFe
Pro tip : This indicator is a simply a tool to visualize trading concepts on the candle stick chart. It is the job of the trader to sequence these effectively into a profitable trade.
If you come across any bug or have a question on how to effectively use the indicator, please don't hesitate to ask questions.
Good luck & good trading!

BO - CCI Arrow with AlertBO - CCI Arrow with Alert base on CCI indicator to get signal for trade Binary Option.
Rules of BO - CCI Arrow with Alert below:
A. Setup Menu
1. cciLength:
* Default CCI lenght = 14
2. Linear Regression Length:
* Periods to calculate Linear Regression of CCI,
* Default value = 5
3. Extreme Level:
* Default top extreme level = 100
* Default bottom extreme level = -100
4. Filter Length:
* Periods to define highest or lowest Linear Regression
* Default value = 6
B. Rule Of Alert Bar
1. Put Alert Bar
* Current Linear Regression Line created temporrary peak
* Peak of Linear Regression Line greater than Top Extreme Level (100)
* Previous Linear Regression is highest of Filter Length (6)
* Previous Linear Regression is greater than previous peak of Linear Regression Line
* Current price greater than previous low
* CCI(14) less than Linear Regression Line
2. Call Alert Bar
* Current Linear Regression Line created temporrary bottom
* Bottom of Linear Regression Line less than Bottom Extreme Level (-100)
* Previous Linear Regression is lowest of Filter Length (6)
* Previous Linear Regression is less than previous bottom of Linear Regression Line
* Current price less than previous lhigh
* CCI(14) greater than Linear Regression Line
B. Rule Of Entry Bar and Epiry.
1. Put Entry with expiry 3 bars:
* After Put Alert Bar close with signal confirmed, put Arrow appear, and after 3 bars, result label will appear to show win trade, loss trade or draw trade
2. Call Entry with expiry 3 bars:
* After Call Alert Bar close with signal confirmed, call Arrow appear, and after 3 bars, result label will appear to show win trade, loss trade or draw trade.
3. While 1 trade is opening no more any signal
C. Popup Alert/Mobile Alert
1. Signal alert: Put Alert or Call Alert will send to mobile or show popup on chart
2. Put Alert: only Put Alert will send to mobile or show popup on chart
3. Call Alert: only Call Alert will send to mobile or show popup on chart

BO - RSI - M5 BacktestingBO - RSI - M5 Backtesting -Rule of Strategy
A. Data
1. Chart M5 IDC
2. Symbol: EURJPY
B. Indicator
1. RSI
2. Length: 12 (adjustable)
3. Extreme Top: 75 (adjustable)
4. Extreme Bottom: 25 (adjustable)
C. Rule of Signal
1. Put Signal
* Rsi create a temporary peak over Extreme Top
row61: peak_rsi= rsi >rsi and rsi >rsi and rsi rsi_top
2. Call Signal
* Rsi create a temporary bottom under Extreme Bottom
row62: bott_rsi= rsi rsi and rsi
