indicator StrategyBITMEX5 FOR LONG BUY2This indicator was developed for trading using RCI .
It performs well in day trading and swing trading.
* Signal conditions for long entry *
It is displayed when the short-term RCI crossovers the lowerband.
* Take profit condition *
It is displayed when the short-term RCI crossunders the lowerband.
* Optimized the entry conditions using CM_Williams_Vix_Fix created by ChrisMoody.
************************
Hello everyone!
I am very pleased with your evaluation.
This script is a masterpiece of the current stage of successful development of a technical analysis of cryptocurrencies over two years.
This has been published for cryptocurrency fans like you, but it may be closed in the near future.
If you like this indicator, please support money for my activities.
We would like to use that money as an activity cost for further indicator updates and better strategy development.
This development work is very hard and requires careful attention, but I am passionate about making them successful.
The amount of money does not matter.
The value you felt was that amount.
BTC
39LbiVReUjxX7k2gqWxQeDAVJtYfTCREzB
LTC
MVAJG4ubzugi2jxZ6P6wqXJXA3RqzmNqYK
ETH
0x7c5715b87a268993c4d78086016015b39985c835
USDC
0x7c5715b87a268993c4d78086016015b39985c835
Thank you.
"BTC"に関するスクリプトを検索

Bitmex Dollar Value CalculatorWith this indicator you can easily calculate either the bitcoin value of a certain amount of dollars or the dollar value of your bitcoin (particularly helpful when trading on bitmex)
Tipjar : 38uGQJDDZDL6wX48x4gYTccPeQ3ZHVYmY4 (btc)

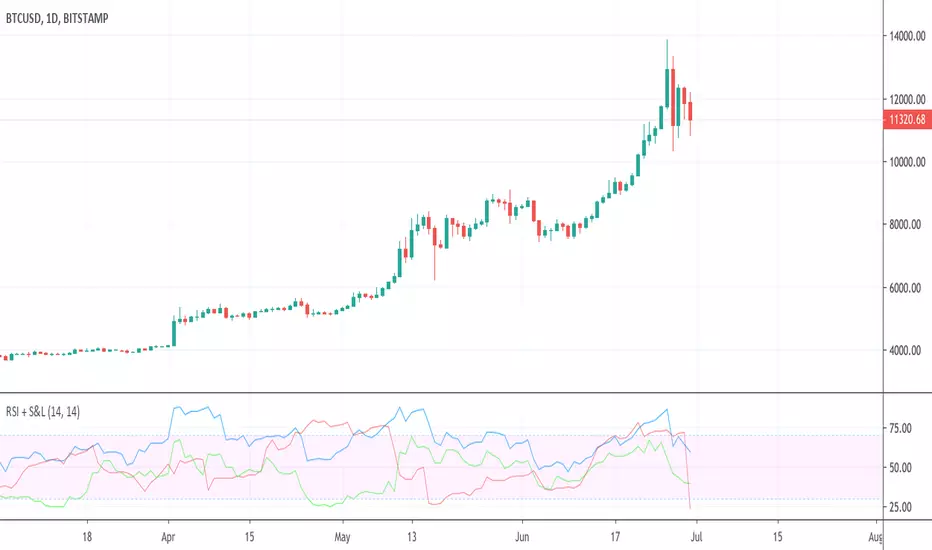
RSI + BTC Short & Long RSIsPlots the RSI for the current chart (same as the built-in RSI indicator) and adds the RSI values for the Shorts and Longs (S&L) from Bitmex. The main reason I've used the RSI value is to have it on the same scale as the price chart's RSI. The general trend of the S&L is preserved.

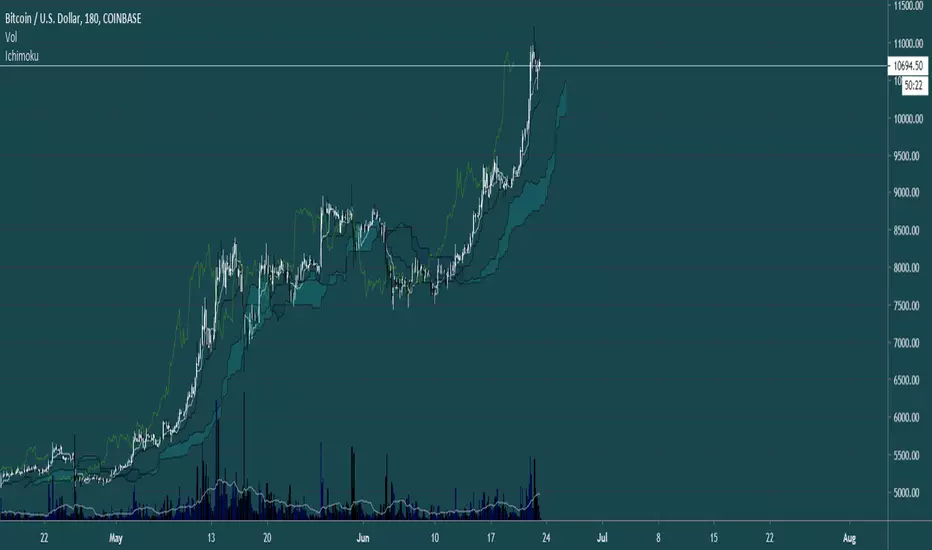
HTF IchimokuThis Indicator makes trading with ichimoku on different timeframes alot easier and more intuitive. It colors bars according to ichimoku trend and plots Kumo Breakouts and tk crosses.
tips are always welcome at: 38uGQJDDZDL6wX48x4gYTccPeQ3ZHVYmY4 ( btc )
Happy tradings :)
HTF Heikin AshiThis script colors standard candles or bars according to the Heikin Ashi trend at that time. (Timeframe is adjustable)
tips are always welcome at: 38uGQJDDZDL6wX48x4gYTccPeQ3ZHVYmY4 (btc)
I hope you enjoy the script :)

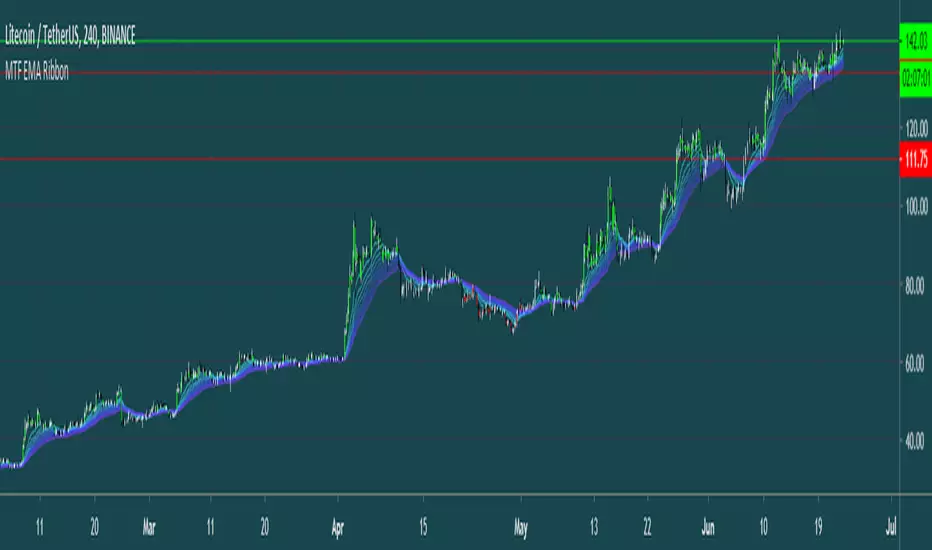
MTF EMA RibbonThis Script analyses trends using an EMA Ribbon (Can be adjusted to any timeframe).
tips are always welcome at: 38uGQJDDZDL6wX48x4gYTccPeQ3ZHVYmY4 (btc)
I hope you enjoy the script :)
Ultra CMF + Stoch. and Choppiness IndexThis is a fairly complex, but powerful indicator that combines 3 different indicators.
1. Chaikin Money Flow (CMF)-
Oscillator that uses the sum of Money Flow Volume (MFV) values over n periods to determine and compare the amount of
buying/selling pressure. We modified the CMF's scale so that values fluctuate between {-100, 100} for easier visualization.
If (CMF > 0)
then (buying pressure > selling pressure)
If (CMF < 0)
then (buying pressure < selling pressure)
Thus, CMF can be a valuable tool for confirming both uptrends and downtrends, as well as identifying divergences as a negative CMF
value in the midst of an uptrend indicates lack of strength.
In addition, we set bounds for the CMF values to prevent whipsaws during periods of horizontal price movement.
The CMF is shown on the bottom of the chart as the teal and fuchsia histogram.
Teal bars means (CMF < 0) and fuchsia bars means (CMF > 0).
2. Choppiness Index -
The Choppiness Index is another oscillator that works synergistically with the Chaikin Money Flow to prevent entries during choppy
conditions (when there is no clear trend direction and movement is horizontal). Although it is blind to the actual direction of the
price movement, we use it to distinguish periods of consolidation from "trendy" markets. Values fluctuate between {0, 100}, with 50
acting as the center-point. We've also set thresholds for chop values that are utlized to optimize entry and exit timing.
The Choppiness Index is plotted as the green and pink circle line at the top of the chart. If movement is choppy(choppy > 50), then
circles are pink. If choppiness is low(chop < 50), then the circles are green.
3. Fast and Slow Stochastics -
Lastly, we use a fast and a slow stochastic momentum oscillator. This is a fairly common approach, as it allows us to detect signals
on a wider range of sensitivity.The slow stochastic confirms the high quantity of signals generated by the more hyper-sensitive
fast stochastic.
The fast and slow K and D values are not plotted on the graph by default, but users can change that in the inputs to choose which
ones to show on the graph(as shown in the bottom pane). The upper and lower bounds can also be chosen to increase/decrease
signal sensitivity.
All values such as lengths, bounds, etc. can be changed by users through the input options.
The Graph:
Chaikin Money Flow - Shown as the teal and pink zero-centered oscillator at the bottom of the chart. Bars are teal when CMF is less than
zero and fuchsia when CMF value is greater than 0. Users can choose whether the CMF is plotted by changing the 'plotCMF' input.
-The CMF histogram is shown in the second and third panes.
Choppiness Index - Plotted as the pink and teal line of circles at the top of the chart. Circles are pink if they are above 50 (high chop) and
teal when they are below 50 (low chop). Users can choose whether it is plotted through the 'plotChop' input.
-The Choppiness Index is shown in the second and third panes.
Stochastics - Not plotted by default, but users can choose to have them shown by adjusting the values in the input options menu. If you want,
there is an option to plot both fast and slow K and D values (4 total lines) and the upper and lower bounds that are used to determine entries
and exits.
NOTE: I tried to show all the ways that you can choose to display all the different indicators in the different panes, but there are a million
different ways you can choose to have the chart laid out through changing the inputs. You could have it be as simple as plotting just the 'B'
and 'S' for entries and exits or a complex graph with the CMF, Chop, and stochastics all plotted together.
HOW TO USE:
There is a set of conditionals for each of the three indicators to determine both entry and exit points. To simplify this, we decided to divide them
into red circles for exit conditions and green squares for entry conditions.
LONG ENTRIES:
1. If the conditions for the stochastics are met, a green square is plotted at the top of the chart.
2. If the conditions for the CMF are met, a green square is plotted at the center of the chart.
3. If the conditions for Choppiness Index are met, a blue circle is plotted at the bottom.
TRADE WHEN: There is a green square at the top, green square in the middle, and a blue circle at the bottom.
A GREEN 'B' IS PLOTTED IN THE CENTER OF THE GRAPH WHEN THE ABOVE REQUIREMENTS ARE TRUE...Enter position at that point.
LONG EXIT:
1. If the conditions for the stochastics are met, a red circle is plotted at the top of the chart.
2. If the conditions for CMF are met, a red circle is plotted at the center of the chart.
3. If the conditions for Choppiness Index are met, a blue circle is plotted the bottom.
TRADE WHEN: There is a red circle at the top, red circle in the middle, and blue circle at the bottom.
A RED 'S' IS PLOTTED AT THE CENTER OF THE GRAPH WHEN THE ABOVE REQUIREMENTS ARE TRUE....Exit Position at that point.
ALERTS:
An alert is sent when all buy conditions are met, informing the trader to enter a long position.
The same is done for sell conditions.
Like I said earlier, there are tons of input options to change this indicator to fit your specific use, as well as display options. I've tailored the settings
for trading BTC/USD, but it is a very versatile indicator and can be adapted for whatever you're trading.

SwenLink BTC Position Trading Strategy [Alerts Only]Alerts for the BTC Position Trading Strategy.
Learn more about the strategy here .


SMA X RSI - by @CryptoMrDavis -Another script that might be useful for your trading setup.
It use RSI and two SMA's.
Happy trading
+++ use this tool on your own risk. i'm not responsible for your loses +++
Show some ❤
____________________________________________________________________________
BTC: 1GVRDK3HHr9CKM5SF2CGpCNXFuavB3L4j9
ETH: 0x7b825fa752b9926D3E8397cDb1d9E5473D074646
XMR: 41zL2SQS7zyZmwXKng2TeUWsMi5vMmkgSdDCjULUTvM6ichwm1E2ZDEYGt56zk9ghoM9bekhjycSwa8amtTcB2JiUet5jtg
NEO: AXja5xPDhczfm2ujHyBfpkQAAnMsXsazmb
ZEC: zcZzFkRx95cp7MtuW8wLhC5zz5RYF9QkT2uPPmhZZHc6ppXepHGgCSeAS1rtD6WFdqsM5p1gZm2gfirnrnviucsdP4aCpqU
XLM: GAXUQJSW55C7MAC4GI26NZUGIKSHFDVFRFKZCXPLMPY4HCADSDT55XK6
WAVES: 3PCMkNpMHxSraTCkwV1ENcBKa9sXbVCGjQX
BCH: qz57n04ud6mn42u00aymqkku8tfh0lk4jv9c28mjvv
____________________________________________________________________________
++++ cryptotradingresource.com ++++
____________________________________________________________________________

Helios - by @cryptomrdavis -
Helios is a simple to use oscillator.
It represent the state of different indicators at the moment. If you see a small green column, that means that only one or few indicators are getting into the positiv area, wait for higher bars to get into a trade. Same thing on the red bars side.
Calculation is based on few indicators like RSI , MACD , EMA , SMA and some more.
Happy trading
+++ use this tool on your own risk. i'm not responsible for your loses +++
Show some ❤
____________________________________________________________________________
BTC: 1GVRDK3HHr9CKM5SF2CGpCNXFuavB3L4j9
ETH: 0x7b825fa752b9926D3E8397cDb1d9E5473D074646
XMR: 41zL2SQS7zyZmwXKng2TeUWsMi5vMmkgSdDCjULUTvM6ichwm1E2ZDEYGt56zk9ghoM9bekhjycSwa8amtTcB2JiUet5jtg
NEO: AXja5xPDhczfm2ujHyBfpkQAAnMsXsazmb
ZEC: zcZzFkRx95cp7MtuW8wLhC5zz5RYF9QkT2uPPmhZZHc6ppXepHGgCSeAS1rtD6WFdqsM5p1gZm2gfirnrnviucsdP4aCpqU
XLM: GAXUQJSW55C7MAC4GI26NZUGIKSHFDVFRFKZCXPLMPY4HCADSDT55XK6
WAVES: 3PCMkNpMHxSraTCkwV1ENcBKa9sXbVCGjQX
BCH: qz57n04ud6mn42u00aymqkku8tfh0lk4jv9c28mjvv
____________________________________________________________________________
++++ cryptotradingresource.com ++++
____________________________________________________________________________

bitFlyer DeviationbitFlyer price deviation percent between FXBTCJPY and BTCJPY.
bitFlyerのBTCFXとBTC現物の価格乖離(%)を表示します。

relative strength to BTCIt compares how much the asset has gone up or down in % more or less relative to BTC % increments.
It can also be converted into an oscillator

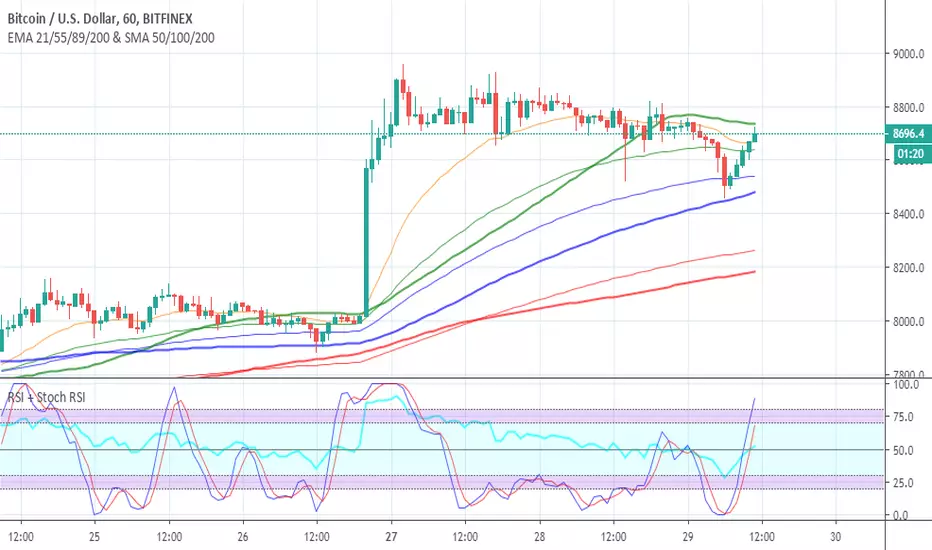
EMA 21/55/89/200 & SMA 50/100/200Free to use indicator combining all important time periods for two of the most valuable trading tools: EMAs and SMAs . As you can see on the chart and previous time periods, BTC often bounces off these, giving you an insight into possible future price movement. Add to your favourite scripts now at the bottom of this page and stay ahead of the game.
Switching off all except the most important periods in the indicator settings (21 & 55 EMA + 100 & 200 MA) can help keep a nice clean trading chart, if that is your preference.
SIMPLE MOVING AVERAGE
Smooths out the price across each period to reveal short, medium and long term trends and potential areas of support or resistance.
50, 100 and 200 are three of the most commonly used/respected moving averages.
The 200MA in particular provides very strong support/resistance on longer time frames.
EXPONENTIAL MOVING AVERAGE
A slightly more sophisticated version of the moving average, the EMA gives more weight to recent price action (i.e. a recent big move up/down will be reflection sooner... "the trend is your friend").
21, 55, 89 and 200 are four of the most commonly used/respected exponential moving averages.
The 21 and 55 EMA are undoubtedly the most powerful, and somewhat a self-fulfilling prophecy since so many people follow them.
Just so you know...
Green = 55/50, blue = 89/100, red = 200/200
EMAs are shown with thinner lines (as they change direction faster, think light and quick)
SMAs are shown with thicker lines (as they change direction slower, think heavier and more respected)
My free Combined RSI and Stochastic RSI Indicator , is also shown on the chart above and will save you valuable space on your trading screen, since you are strictly limited to the number of indicators you can use at one time. Give it a try and you'll wonder why you ever had separate indicators for RSI and Stoch RSI clogging up both your screen and indicator allowance.
These tools are for educational purposes only and not a recommendation to buy or sell. Always do your own research before trading.
Bitcoin On-Chain OBVThe Bitcoin On-Chain OBV is a port of the classical volume oscillator that reflects the accumulation registered through the On-Chain Transactions.
It also allows to source through the aggregated combined exchange volumes.
The indicator can show the value either in BTC or USD.

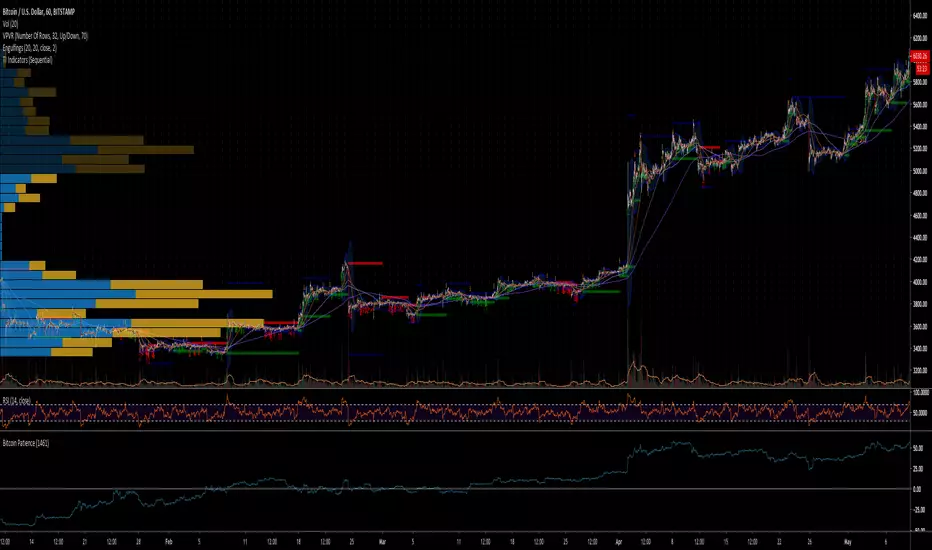
Bitcoin PatienceThis indicator shows how long every Bitcoin buyer ever had to wait to be in profit. Best to use this on the daily chart. At the time of publishing this indicator (May 2019), 1250 days of patience means gains for every BTC buyer ever. Can also be used for other assets of course.
Bitcoin On-Chain VolumeThe Bitcoin On-Chain Volume is a reflection of the transactional volume registered in the blockchain.
The indicator can show the value either in BTC or USD.

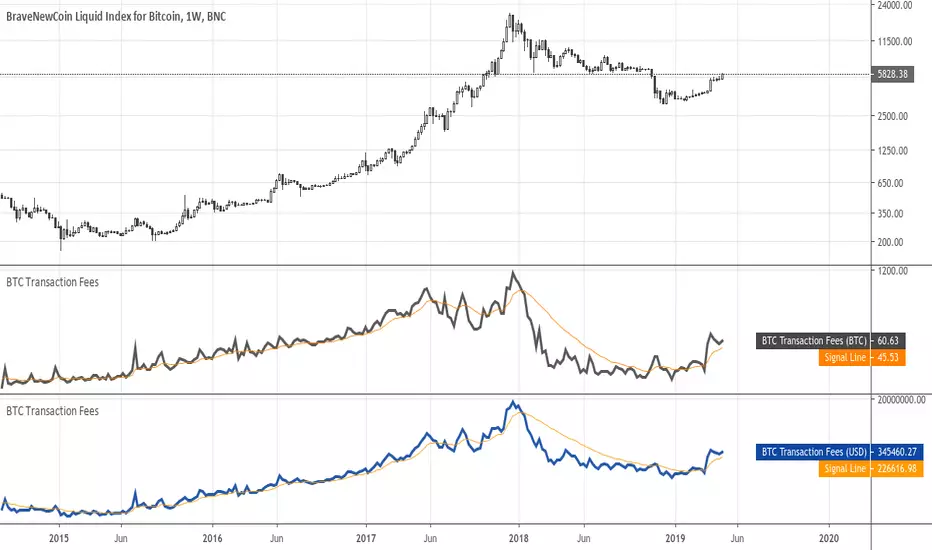
Bitcoin Transaction FeesThe Bitcoin Transaction Fees is the fee value that miners earn on a daily basis.
The indicator can show the value either in BTC or USD.
RatTrend Multiple RSI Divergence MA Cross OscillatorThis Indicator based on RSI Divergence with Overbought and oversold signals.
All tops and bottoms calculated with Moving Average Crosses and combines with RSI signals.
Best working Timeframe is H4 on current settings, you can modify values to find best for you.
Current settings best for BTC trading.
At the beginning it can confuse you to understand but you will understand signal patterns.
Have fun.

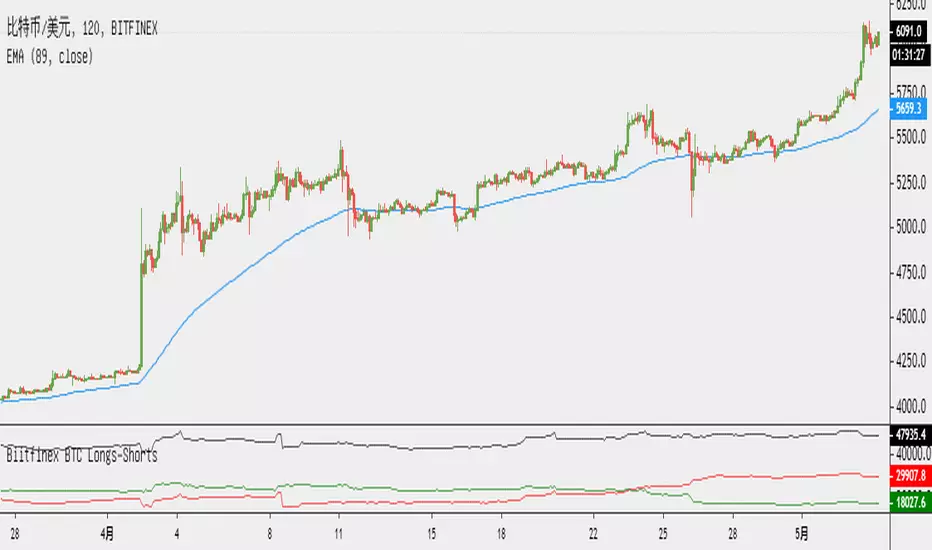
Biitfinex BTC Longs-Shorts// version 1.0 alerts of 4 types just testing things out
//@version=3
study("Biitfinex BTC Longs-Shorts")
shorts = pow(security("BITFINEX:BTCUSDSHORTS", period, close),1.0)
plot(shorts, title='Bitfinex Shorts', color=red)
longs = pow(security("BITFINEX:BTCUSDLONGS", period, close),1.0)
plot(longs, title='Bitfinex Longs', color=green)
dif=longs+shorts // calculate difference
plot(dif, color=black, title="Difference") // plot difference
Anytime Plot 100EMA/1h for Bitcoin [akubi] Ver.2 常時1時間足100EMAを表示常時1時間足100EMAを表示してくれるインジケーターです。
仮想通貨、特にBTCペアの通貨は1時間の100EMAがレジスタンス&サポートとして意識されています。
仮想通貨をされる方は常時出しておきたいインジケーターの一つだと思います。
===============
以前あったものの改良版です。
・名称の変更
・合成シンボルにも対応
ということで、新規で投稿します。
===============

Breton Composite BTC Real10 VolumeComposite for BTC vol from the following Exchanges:
Binance
Bitstamp
Bitfinex
Coinbase
Kraken
Bittrex
Poloniex
ItBit
Gemini
BitFlyer
