Currency Strength v3.0Currency Strength v3.0
Summary
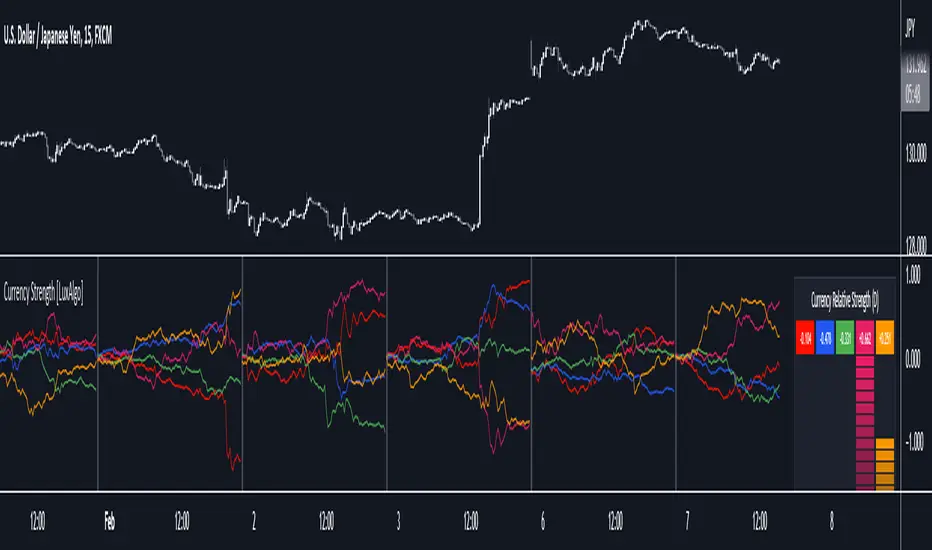
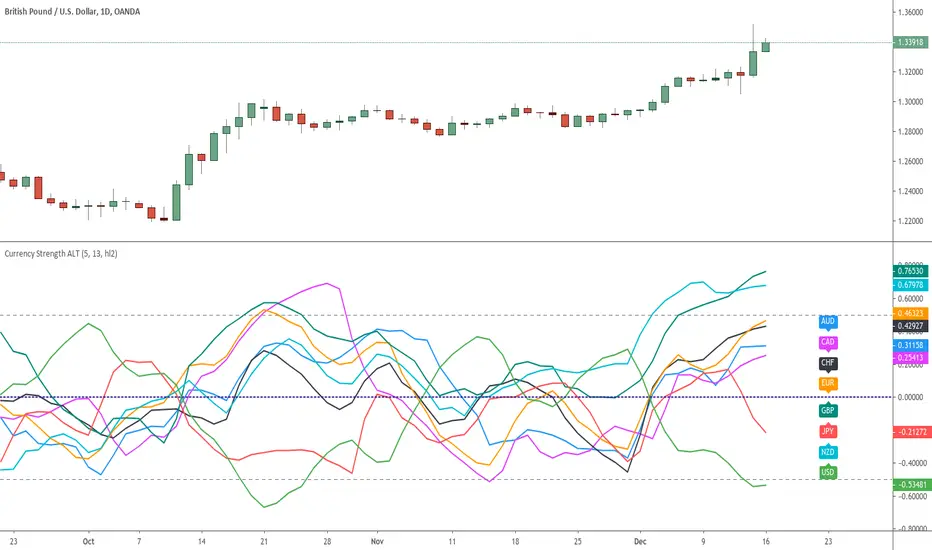
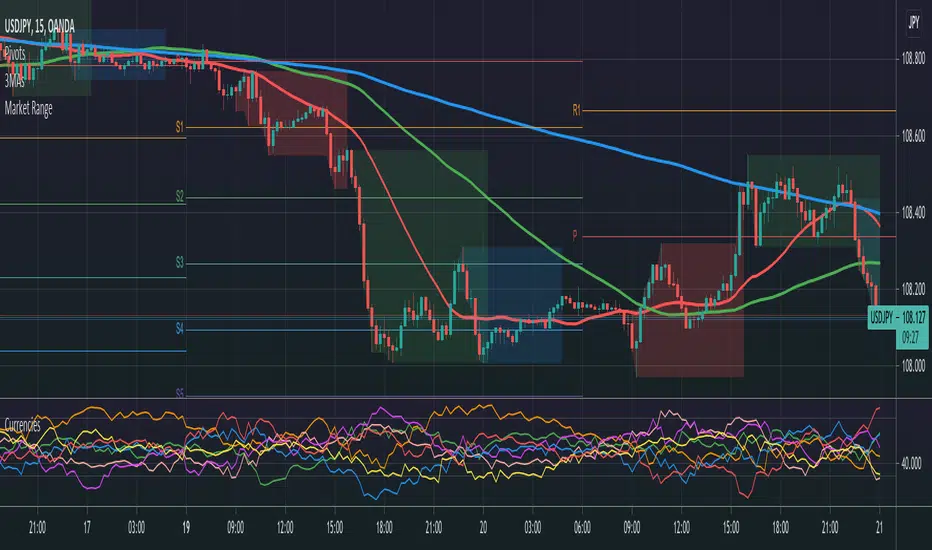
The Currency Strength indicator is a powerful tool designed to gauge the relative strength of major and emerging market currencies. By plotting the True Strength Index (TSI) of various currency indices, it provides a clear visual representation of which currencies are gaining momentum and which are losing it. This indicator automatically detects the currency pair on your chart and highlights the corresponding strength lines, simplifying analysis and helping you quickly identify potential trading opportunities based on currency dynamics.
Key Features
Comprehensive Currency Analysis: Tracks the strength of 19 currencies, including major pairs and several emerging market currencies.
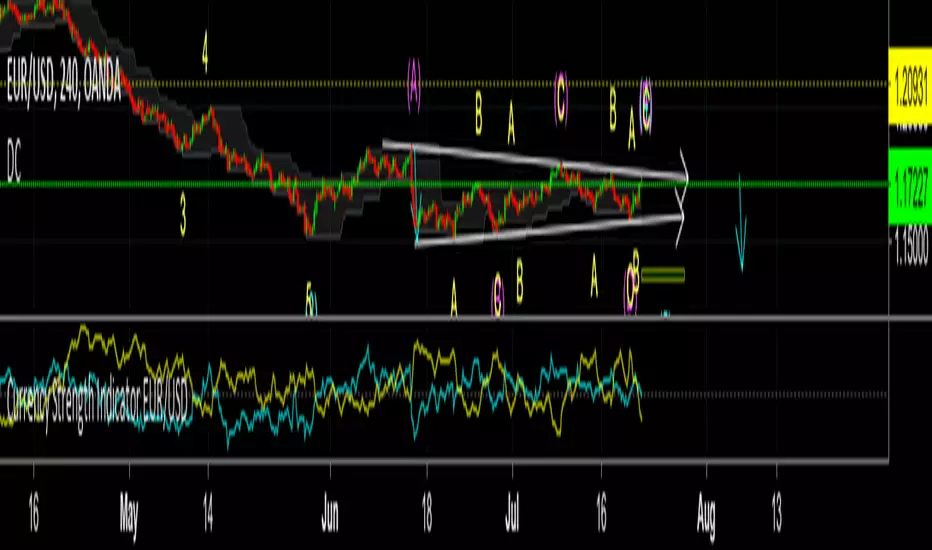
Automatic Pair Detection: Intelligently identifies the base and quote currency of the active chart, automatically highlighting the relevant strength lines.
Dynamic Coloring: The base currency is consistently colored blue, and the quote currency is colored gold, making it easy to distinguish between the two at a glance.
Non-Repainting TSI Calculation: Uses the True Strength Index (TSI) for smooth and reliable momentum readings that do not repaint.
Customizable Settings: Allows for adjustment of the fast and slow periods for the TSI calculation to fit your specific trading style.
Clean Interface: Features a minimalist legend table that only displays the currencies relevant to your current chart, keeping your workspace uncluttered.
How It Works
The indicator pulls data from major currency indices (like DXY for the US Dollar and EXY for the Euro). For currencies that don't have a dedicated index, it uses their USD pair (e.g., USDCNY) and inverts the calculation to derive the currency's strength relative to the dollar. It then applies the True Strength Index (TSI) to this data. The TSI is a momentum oscillator that is less volatile than other oscillators, providing a more reliable measure of strength. The resulting values are plotted on the chart, allowing you to see how different currencies are performing against each other in real-time.
How to Use
Trend Confirmation: When the base currency's line is rising and above the zero line, and the quote currency's line is falling, it can confirm a bullish trend for the pair. The opposite would suggest a bearish trend.
Identifying Divergences: Look for divergences between the currency strength lines and the price action of the pair. For example, if the price is making higher highs but the base currency's strength is making lower highs, it could signal a potential reversal.
Crossovers: A crossover of the base and quote currency lines can signal a shift in momentum. A bullish signal occurs when the base currency line crosses above the quote currency line. A bearish signal occurs when it crosses below.
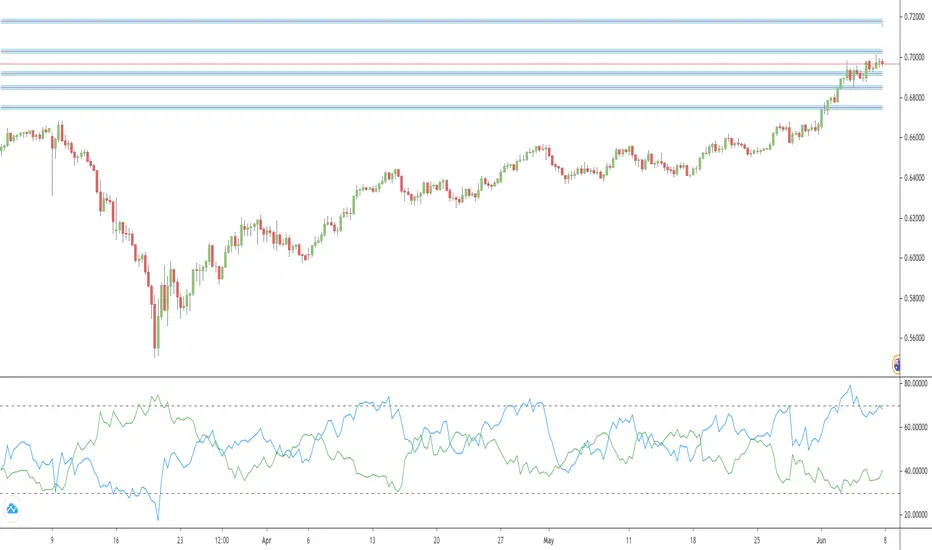
Overbought/Oversold Levels: The horizontal dashed lines at 0.5 and -0.5 can be used as general guides for overbought and oversold conditions, respectively. Strength moving beyond these levels may indicate an unsustainable move that is due for a correction.
Settings
Fast Period: The short-term period for the TSI calculation. Default is 7.
Slow Period: The long-term period for the TSI calculation. Default is 15.
Index Source: The price source used for the calculations (e.g., Close, Open). Default is Close.
Base Currency Color: The color for the base currency line. Default is Royal Blue.
Quote Currency Color: The color for the quote currency line. Default is Goldenrod.
Disclaimer
This indicator is intended for educational and analytical purposes only. It is not financial advice. Trading involves substantial risk, and past performance is not indicative of future results. Always conduct your own research and risk management before making any trading decisions.
"Currency Strength"に関するスクリプトを検索
Composite Any Currency Strength IndexThis is a flexible currency strength indicator and you can adjust it to any currency you wish 'to measure'. By default, it is set to measure USD major pairs. Indicator calculates every pair you list, and plots one composite chart in the form of Heikin Ashi candles. Basically, you will get USD index in this case. Similarly, you can get AUD, EUR, CAD, JPY, CHF, etc indexes by specifying corresponding symbols. Remember about base and quote currencies and location of each for correct calculations. Simple adjustments in the script needed if you want to value USD by using USD in both base and quote (counter) currencies.
For example, when calculating USD strength by looking into USDJPY (not into JPYUSD) symbols, you will need to add minus "-" before corresponding security in the script itself, not in the Settings Inputs.
Default study script (with JPYUSD):
// Inputs
...
string sec3 = input(defval="JPYUSD", type=input.symbol, title="Symbol")
...
h_sec3 = security(heikinashi(sec3), timeframe.period, high)
l_sec3 = security(heikinashi(sec3), timeframe.period, low)
o_sec3 = security(heikinashi(sec3), timeframe.period, open)
c_sec3 = security(heikinashi(sec3), timeframe.period, close)
Adjusted study script with USDJPY:
// Inputs
...
string sec3 = input(defval="USDJPY", type=input.symbol, title="Symbol")
...
h_sec3 = -security(heikinashi(sec3), timeframe.period, high)
l_sec3 = -security(heikinashi(sec3), timeframe.period, low)
o_sec3 = -security(heikinashi(sec3), timeframe.period, open)
c_sec3 = -security(heikinashi(sec3), timeframe.period, close)
Unfortunately, I am not a coder specialist and perhaps someone here could improve this indicator for easier and more friendly adjustments. But thanks to variety of symbols on TradingView , you can ignore any changes in the script, and just use symbols with corresponding counter currency offered by this great platform.
Bollinger Bands, 2 x RMA, 4 x SMA/EMA were added for deeper analysing of the index. Other indicators with ability to select data sources (like CCI, StochRSI, Momentum etc) can be separately added to a current chart, but use Composite Any Currency Strength Index data as the source for analysing displayed pair, i.e. by selecting source - Composite Any Currency Strength Index: SMA Close or EMA HLC.
Thank you and good luck everyone!
Currency Strength Index by zdmreCurrency strength expresses the value of currency. For economists, it is often calculated as purchasing power, while for financial traders, it can be described as an indicator, reflecting many factors related to the currency; for example, fundamental data, overall economic performance (stability) or interest rates.
The method used in this indicator is its strength against the US Dollar (xxxUSD)
Currencies:
EUR
GBP
AUD
NZD
JPY
CNY
CAD
Your Symbol (Optionally) defval: TRYUSD
You can also optionally add a symbol. However, this unit must be in the form of xxxUSD
Currency Strength [LuxAlgo]The Currency Strength indicator displays the historical relative strength of 5 user selected currencies over a user selected period of time. Users can also display relative strength of currencies as a scatter plot, further informing on the evolution of currency strength.
🔶 SETTINGS
Display: Determines the type of data displayed by the indicator. By default, the trailing relative strength of currencies is displayed, with the other option displaying the scatter plot.
Timeframe: Timeframe period used to calculate currency relative strength.
🔹 Meter
Show Strength Meter: Displays the currency strength meter on the indicator panel.
Strength Meter Resolution: Resolution of the currency strength meter, higher resolutions allow to observe smaller difference in strength.
Location: Location of the currency strength meter on the indicator pane.
Size: Size of the currency strength meter.
🔹 Relative Strength Scatter Graph
Scatter Graph Resolution: Horizontal and vertical width of the scatter plot (in bars). Higher values allow a more precise position on the X axis.
🔶 USAGE
Measuring the relative strength of a currency allows users to assess the relative performance of a currency against a basket of other currencies.
The term "strength" can convey various interpretations depending on the indicator. Here "strength" is interpreted as an indicator of performance, with stronger currencies having greater performances over the selected period (positive changes of higher magnitude).
The Currency Strength indicator allows users to analyze the relative strength of currencies over a user selected period - the returned results will reset periodically and will accumulate afterward.
The above chart shows the hourly relative strength of various currencies on the 1min TF.
🔹 Scatter Graph
The scatter graph displays the relative strength of a currency over its value during the previous period. This not only allows users to see if a currency is strong... but also if it's getting stronger compared to the previous period.
In order to quickly interpret results, the graph is divided into four areas. A currency (displayed as a point) being in a specific area returns the following information:
Strong(Green): Currency has a positive relative strength (bullish) and is greater than its value over the previous period.
Improving (Yellow): Currency has a negative relative strength (bearish) and is greater than its value over the previous period.
Weakening (Aqua): Currency has a positive relative strength (bullish) and is lower than its value over the previous period.
Weak (Red): Currency has a negative relative strength (bearish) and is lower than its value over the previous period.
🔶 DETAILS
There is a wide variety of methods for the calculation of a currency's relative strength. The primary focus of the indicator is on the meter as well as the relative strength scatter graph. The currency strength calculation can be considered more basic.
Given two currencies, B (base) and Q (quote), the proposed indicator calculation process is as follows:
Exchange rate BQ(t) over time t is obtained, a rising value of BQ(t) means that a unit of B is now worth a higher amount of Q , highlighting strength of B over Q on that precise variation.
The individual relative strength over time IRS(t) is obtained as the percentage relatively close to the open difference of BQ(t) , that is:
IRS(t) = / open(t) * 100
Normalizing the close to open difference allows for the various currencies' relative strengths to approximately share the same scale.
The above operation is performed n times over a space of n currencies O( n ) . The obtained individual relative strengths for one specific currency are then added together, forming the final composite relative strength ( CRS ) of that currency:
CRS (t) = IRS (t) + IRS (t) + ... + IRS (t)
The cumulative sum of CRS(t) over the user selected period is then obtained.
Currency StrengthRepublished: The original script violated house rules by including an external link to Backtest Rookies.
Background
The currency strength indicator takes up to 4 forex pairs and calculates the average strength across all pairs. The indicator uses the pair's daily percentage change to calculate the overall strength. For flexibility, it can accept any instrument as an input. This means you can use multiple instances to track various currency strengths. It was designed with the major pairs in mind but there is no reason why it cannot be used for other FX pairs.
Note: The indicator defaults to GBP. When setting it up for other currencies, be sure to flag whether the currency is a counter currency or not.
The code is provided free and open source. Please modify it as you see fit.
Screenshots
Defaults with Annotation
Yen strength beating pound strength
Opposing Trends
Currency StrengthThis innovative Currency Strength Indicator is a powerful tool for forex traders, offering a comprehensive and visually intuitive way to analyze the relative strength of multiple currencies simultaneously. Here's what makes this indicator stand out:
Extensive Currency Coverage
One of the most striking features of this indicator is its extensive coverage of currencies. While many similar tools focus on just the major currencies, this indicator includes:
Major currencies: USD, EUR, JPY, GBP, CHF, CAD, AUD, NZD
Additional currencies: CNY, HKD, KRW, MXN, INR, RUB, SGD, TRY, BRL, ZAR, THB
This wide range allows traders to gain insights into a broader spectrum of the forex market, including emerging markets and less commonly traded currencies.
Unique Visual Presentation
The indicator boasts a clear and user-friendly interface:
Each currency is represented by a distinct colored line for easy identification
A legend is prominently displayed at the top of the chart, using color-coded labels for quick reference
Users can customize which currencies to display, allowing for a tailored analysis
This clean, organized presentation enables traders to quickly grasp the relative strengths of different currencies at a glance.
Robust Measurement Methodology
The indicator employs the True Strength Index (TSI) to calculate currency strength, which provides several advantages:
TSI is a momentum oscillator that shows both trend direction and overbought/oversold conditions
It uses two smoothing periods (fast and slow), which helps filter out market noise and provides more reliable signals
The indicator calculates TSI for each currency index (e.g., DXY for USD, EXY for EUR), ensuring a comprehensive strength measurement
By using TSI, this indicator offers a more nuanced and accurate representation of currency strength compared to simpler moving average-based indicators.
Customization and Flexibility
Traders can fine-tune the indicator to suit their needs:
Adjustable TSI parameters (fast and slow periods)
Ability to show/hide specific currencies
Customizable color scheme for each currency line
Practical Applications
This Currency Strength Indicator can be used for various trading strategies:
Identifying potential trend reversals when a currency reaches extreme overbought or oversold levels
Spotting divergences between currency pairs
Confirming trends across multiple timeframes
Enhancing multi-pair trading strategies
By providing a clear, comprehensive, and customizable view of currency strength across a wide range of currencies, this indicator equips traders with valuable insights for making informed trading decisions in the complex world of forex.
MB - Currency Strength ROCCurrency Strength ROC Enhanced is a technical indicator designed to measure and visualize the relative strength of different currencies in the foreign exchange market. Using a Rate of Change (ROC) approach and moving averages, this indicator provides valuable insights into the dynamics of currency strengths.
Key Features:
Relative Strength Measurement:
Calculates the strength of each currency relative to others, allowing you to identify which currencies are appreciating or depreciating.
Strength Histogram:
Presents normalized strength in a histogram format, making it easy to quickly see areas of positive (green) and negative (red) strength
Moving Averages:
Includes moving averages of normalized strength and trend, providing a clear view of the overall direction of strength over time.
Overbought and Oversold Zones:
Highlights critical levels of strength through horizontal lines, allowing traders to identify potential trend reversals.
Currency Strength Gold MethodolgyThis script was written by, and used with the express permission of, Eduardo Andrade. The purpose of the script is easily determine respective currencies strength and weakness as utilized in The Gold Methodology - Ichimoku.
Tradingview members can use this script to see how each currency pair performed the day before as the reading is based is based upon the 11:00 p.m. GMT 60 minute candle (just before the Tokyo open).
Each currency is ranked in order of descending Strength and are designated by the following colors:
Orange = AUD
Green = CAD
Aqua = CHF
Purple = EUR
Red = GBP
Yellow = JPY
Black = NZD
Blue = USD
I hope you find he script beneficial and if you have any questions, please comment or send me a message.
have a great weekend!!
Allen
Currency Strength V2An update to my original Currency Strength script to include a 2nd timeframe for more market context.
Changed the formatting slightly for better aesthetics, as the extra column and colors became unsightly.
Also added a new setting for "Flat Color", which changes the value background to a simple green/red for above or below 50, rather than using the Color Scale that increases color intensity the further it gets from 50.
________________________________________________________________________________
This script measures the strength of the 6 major currencies USD, EUR, GBP, CAD, AUD and JPY.
Simply, it averages the RSI values of a currency vs the 5 other currencies in the basket, and displays each average RSI value in a table with color coding to quickly identify the strongest and weakest currencies over the past 14 bars (or user defined length).
The arrow in the current RSI column shows the difference in average RSI value between current and X bars back (user defined), telling you whether the combined RSI value has gone up or down in the last X bars.
Using the average RSI allows us to get a sense of the currency strength vs an equally weighted basket of the other majors, as opposed to using Indexes which are heavily weighted to 1 or 2 currencies.
The additional security calls for the extra timeframe make this slower to load than the original, but this was a user request so hopefully it will prove worthwhile for some people.
Those who find the loading too slow when switching between charts may be better off still using the original, which is why this is posted as a separate script and not an update to the original.
This is the table with Flat Color option enabled.
Currency StrengthThis script measures the strength of the 6 major currencies USD, EUR, GBP, CAD, AUD and JPY.
Simply, it averages the RSI values of a currency vs the 5 other currencies in the basket, and displays each average RSI value in a table with color coding to quickly identify the strongest and weakest currencies over the past 14 bars (or user defined length).
The Dir. value looks at the difference in average RSI value between current and X bars back (user defined), telling you whether the combined RSI value has gone up or down in the last X bars.
Using the average RSI allows us to get a sense of the currency strength vs an equally weighted basket of the other majors, as opposed to using Indexes which are heavily weighted to 1 or 2 currencies.
The table doesn't load super fast as we are making 15 Security requests to get the values for each pair (where possible we reverse the values of the pair to reduce Security requests, e.g. we don't need to request EURUSD and USDEUR, we reverse the value to calculate the USD RSI).
Currency Strength ALT v1.0Description:
This study is a version of Currency Strength Meter, that utilises TradingViews built-in 8 Currency indices (?XY), rather calculate them from currency pair values. It also utilises the built-in TSI function, the TSI uses moving averages of the underlying momentum of a financial instrument. The advantage of using the Currency Indices for strength is the fact that they are based on multiple Exchange sources and so hopefully making it more representative.
***WARNING*** The TradingView Currency Indices do tend to have gaps between candles especially on the low volume currencies like NZD and AUD, so strength chart can also jump around. I suggest using the indicator with higher TF (4H+) charts.
Currency Strength, displays lines for currency pair onlyThis currency strength indicator displays the strength for the displayed currency pair only.
The following currencies are supported: AUD, CAD, CHF, EUR, GBP, JPY, NZD, USD
Base currency is indicated by a blue line. Counter currency by a green line.
Double click on a line to open the settings window to change line colors or the possition of the dashed lines.
Currency Strength by Bollinger BandsOVERVIEW
This indicator is a currency strength by bollinger band.
CONCEPTS
- The currency strength of the passage is determined by each deviation of the Bollinger Bands.
- Wins if price is above MA, ±1σ, ±2σ. Mark is "○".
- Lose if price is below MA, ±1σ, ±2σ. Mark is "●".
- Display up to 9 currency combinations
- Support for bar indexes other than the latest
Relative Currency StrengthThis indicator shows the relative strength of the majors and crosses compared to each other. So, if you are taking a EURUSD long, are you taking it because the Euro is strong or the USD is weak or both? How do you know? This indicator will show you how strong a current is compared to the other majors and crosses. So in the EURUSD example, you will know how strong the EUR is compared to NZD, AUD, JPY, CHF, GBP, CAD and USD and how strong the USD is compared to the NZD, AUD, JPY, CHF, EUR, GBP and CAD. You can then make an informed choice as to whether the trade makes sense.
Notice in the examples below how the indicator clearly shows how CHF was weak all day and GBP was strong in the morning but then collapsed in the afternoon.
The indicator functions by taking a set point in the day and comparing how price compares to it for the rest of the day. I set it to Europe open and then take context of how a currency is comparing to that price (verses the other currencies) over the course of the day.
You can use the indicator in 2 ways - you set a currency as a baseline and see how other currencies fluctuate about it or you can see how all the currencies strengths compare to each other.
If you have the full tradingview membership you can have 8 screens and see how each currency compares. if you set the indicator to automatic it will automatically default to the base currency that you compare to OANDA gold.
The general strength is useful as a general overview as to where strength and weakness is in the charts. It works by using gold as the baseline which is a reliable way to compare strengths.
REMEMBER, THIS GIVES SUMMARY DATA. USE IT TO GET MARKET CONTEXT IN ORDER TO IDENTIFY WHERE STRENGTH AND WEAKNESS IS - YOU CANT JUST TRADE FROM IT. It's extremely useful in fast moving markets to easily stay aware of what is happening.
Advanced Currency Strength Meter# Advanced Currency Strength Meter (ACSM)
The Advanced Currency Strength Meter (ACSM) is a scientifically-based indicator that measures relative currency strength using established academic methodologies from international finance and behavioral economics. This indicator provides traders with a comprehensive view of currency market dynamics through multiple analytical frameworks.
### Theoretical Foundation
#### 1. Purchasing Power Parity (PPP) Theory
Based on Cassel's (1918) seminal work and refined by Froot & Rogoff (1995), PPP suggests that exchange rates should reflect relative price levels between countries. The ACSM momentum component captures deviations from long-term equilibrium relationships, providing insights into currency misalignments.
#### 2. Uncovered Interest Rate Parity (UIP) and Carry Trade Theory
Building on Fama (1984) and Lustig et al. (2007), the indicator incorporates volatility-adjusted momentum to capture carry trade flows and interest rate differentials that drive currency strength. This approach helps identify currencies benefiting from interest rate differentials.
#### 3. Behavioral Finance and Currency Momentum
Following Burnside et al. (2011) and Menkhoff et al. (2012), the model recognizes that currency markets exhibit persistent momentum effects due to behavioral biases and institutional flows. The indicator captures these momentum patterns for trading opportunities.
#### 4. Portfolio Balance Theory
Based on Branson & Henderson (1985), the relative strength matrix captures how portfolio rebalancing affects currency cross-rates and creates trading opportunities between different currency pairs.
### Technical Implementation
#### Core Methodologies:
- **Z-Score Normalization**: Following Sharpe (1994), provides statistical significance testing without arbitrary scaling
- **Momentum Analysis**: Uses return-based metrics (Jegadeesh & Titman, 1993) for trend identification
- **Volatility Adjustment**: Implements Average True Range methodology (Wilder, 1978) for risk-adjusted strength
- **Composite Scoring**: Equal-weight methodology to avoid overfitting and maintain robustness
- **Correlation Analysis**: Risk management framework based on Markowitz (1952) portfolio theory
#### Key Features:
- **Multi-Source Data Integration**: Supports OANDA, Futures, and CFD data sources
- **Scientific Methodology**: No arbitrary scaling or curve-fitting; all calculations based on established statistical methods
- **Comprehensive Dashboard**: Clean, professional table showing currency strengths and best trading pairs
- **Alert System**: Automated notifications for strong/weak currency conditions and extreme values
- **Best Pair Identification**: Algorithmic detection of highest-potential trading opportunities
### Practical Applications
#### For Swing Traders:
- Identify currencies in strong uptrends or downtrends
- Select optimal currency pairs based on relative strength divergence
- Time entries based on momentum convergence/divergence
#### For Day Traders:
- Use with real-time futures data for intraday opportunities
- Monitor currency correlations for risk management
- Detect early reversal signals through extreme value alerts
#### For Portfolio Managers:
- Multi-currency exposure analysis
- Risk management through correlation monitoring
- Strategic currency allocation decisions
### Visual Design
The indicator features a clean, professional dashboard that displays:
- **Currency Strength Values**: Each major currency (EUR, GBP, JPY, CHF, AUD, CAD, NZD, USD) with color-coded strength values
- **Best Trading Pairs**: Filtered list of highest-potential currency pairs with BUY/SELL signals
- **Market Analysis**: Real-time identification of strongest and weakest currencies
- **Potential Score**: Quantitative measure of trading opportunity strength
### Data Sources and Latency
The indicator supports multiple data sources to accommodate different trading needs:
- **OANDA (Delayed)**: Free data with 15-20 minute delay, suitable for swing trading
- **Futures (Real-time)**: CME currency futures for real-time analysis
- **CFDs**: Alternative real-time data source option
### Mathematical Framework
#### Strength Calculation:
Momentum = (Price - Price ) / Price * 100
Z-Score = (Price - Mean) / Standard Deviation
Volatility-Adjusted = Momentum / ATR-based Volatility
Composite = 0.5 * Momentum + 0.3 * Z-Score + 0.2 * Volatility-Adjusted
#### USD Strength Derivation:
USD strength is calculated as the weighted average of all USD-based pairs, providing a true baseline for relative strength comparison.
### Performance Considerations
The indicator is optimized for:
- **Computational Efficiency**: Uses Pine Script v6 best practices
- **Memory Management**: Appropriate lookback periods and array handling
- **Visual Clarity**: Clean table design optimized for both light and dark themes
- **Alert Reliability**: Robust signal generation with statistical significance testing
### Limitations and Risk Disclosure
- Model performance may vary during extreme market stress (Black Swan events)
- Requires stable data feeds for accurate calculations
- Not optimized for high-frequency scalping strategies
- Central bank interventions may temporarily distort signals
- Performance assumes normal market conditions with behavioral adjustments
### Academic References
- Branson, W. H., & Henderson, D. W. (1985). "The Specification and Influence of Asset Markets"
- Burnside, C., Eichenbaum, M., & Rebelo, S. (2011). "Carry Trade and Momentum in Currency Markets"
- Cassel, G. (1918). "Abnormal Deviations in International Exchanges"
- Fama, E. F. (1984). "Forward and Spot Exchange Rates"
- Froot, K. A., & Rogoff, K. (1995). "Perspectives on PPP and Long-Run Real Exchange Rates"
- Jegadeesh, N., & Titman, S. (1993). "Returns to Buying Winners and Selling Losers"
- Lustig, H., Roussanov, N., & Verdelhan, A. (2007). "Common Risk Factors in Currency Markets"
- Markowitz, H. (1952). "Portfolio Selection"
- Menkhoff, L., Sarno, L., Schmeling, M., & Schrimpf, A. (2012). "Carry Trades and Global FX Volatility"
- Sharpe, W. F. (1994). "The Sharpe Ratio"
- Wilder, J. W. (1978). "New Concepts in Technical Trading Systems"
### Usage Instructions
1. **Setup**: Add the indicator to your chart and select your preferred data source
2. **Currency Selection**: Choose which currencies to analyze (default: all major currencies)
3. **Methodology**: Select calculation method (Composite recommended for most users)
4. **Monitoring**: Watch the dashboard for strength changes and best pair opportunities
5. **Alerts**: Set up notifications for strong/weak currency conditions
Advanced Forex Currency Strength Meter
# Advanced Forex Currency Strength Meter
🚀 The Ultimate Currency Strength Analysis Tool for Forex Traders
This sophisticated indicator measures and compares the relative strength of major currencies (EUR, GBP, USD, JPY, CHF, CAD, AUD, NZD) to help you identify the strongest and weakest currencies in real-time, providing clear trading signals based on currency strength differentials.
## 📊 What This Indicator Does
The Advanced Forex Currency Strength Meter analyzes currency relationships across 28+ major forex pairs and 8 currency indices to determine which currencies are gaining or losing strength. Instead of relying on individual pair analysis, this tool gives you a bird's-eye view of the entire forex market, helping you:
Identify the strongest and weakest currencies at any given time
Find high-probability trading opportunities by pairing strong vs weak currencies
Avoid ranging markets by detecting when currencies have similar strength
Get clear LONG/SHORT/NEUTRAL signals for your current trading pair
Optimize your trading strategy based on your preferred timeframe and holding period
## ⚙️ How The Indicator Works
### Dual Calculation Method
The indicator uses a sophisticated dual approach for maximum accuracy:
Pairs-Based Analysis: Calculates currency strength from 28+ major forex pairs (EURUSD, GBPUSD, USDJPY, etc.)
Index-Based Analysis: Incorporates official currency indices (DXY, EXY, BXY, JXY, CXY, AXY, SXY, ZXY)
Weighted Combination: Blends both methods using smart weighting for enhanced accuracy
### Smart Auto-Optimization System
The indicator automatically adjusts its parameters based on your chart timeframe and intended holding period:
The system recognizes that scalping requires different sensitivity than swing trading, automatically optimizing lookback periods, analysis timeframes, signal thresholds, and index weights.
### Strength Calculation Process
Fetches price data from multiple timeframes using optimized tuple requests
Calculates percentage change over the specified lookback period
Optionally normalizes by ATR (Average True Range) to account for volatility differences
Combines pair-based and index-based calculations using dynamic weighting
Generates relative strength by comparing base currency vs quote currency
Produces clear trading signals when strength differential exceeds threshold
## 🎯 How To Use The Indicator
### Quick Start
Add the indicator to any forex pair chart
Enable 🧠 Smart Auto-Optimization (recommended for beginners)
Watch for LONG 🚀 signals when the relative strength line is green and above threshold
Watch for SHORT 🐻 signals when the relative strength line is red and below threshold
Avoid trading during NEUTRAL ⚪ periods when currencies have similar strength
Note: This is highly recommended to couple this indicator with fundamental analysis and use it as an extra signal.
### 📋 Parameters Reference
#### 🤖 Smart Settings
🧠 Smart Auto-Optimization: (Default: Enabled) Automatically optimizes all parameters based on chart timeframe and trading style
#### ⚙️ Manual Override
These settings are only active when Smart Auto-Optimization is disabled:
Manual Lookback Period: (Default: 14) Number of periods to analyze for strength calculation
Manual ATR Period: (Default: 14) Period for ATR normalization calculation
Manual Analysis Timeframe: (Default: 240) Higher timeframe for strength analysis
Manual Index Weight: (Default: 0.5) Weight given to currency indices vs pairs (0.0 = pairs only, 1.0 = indices only)
Manual Signal Threshold: (Default: 0.5) Minimum strength differential required for trading signals
#### 📊 Display
Show Signal Markers: (Default: Enabled) Display triangle markers when signals change
Show Info Label: (Default: Enabled) Show comprehensive information label with current analysis
#### 🔍 Analysis
Use ATR Normalization: (Default: Enabled) Normalize strength calculations by volatility for fairer comparison
#### 💰 Currency Indices
💰 Use Currency Indices: (Default: Enabled) Include all 8 currency indices in strength calculation for enhanced accuracy
#### 🎨 Colors
Strong Currency Color: (Default: Green) Color for positive/strong signals
Weak Currency Color: (Default: Red) Color for negative/weak signals
Neutral Color: (Default: Gray) Color for neutral conditions
Strong/Weak Backgrounds: Background colors for clear signal visualization
### 🧠 Smart Optimization Profiles
The indicator automatically selects optimal parameters based on your chart timeframe:
#### ⚡ Scalping Profile (1M-5M Charts)
For positions held for a few minutes:
Lookback: 5 periods (fast/sensitive)
Analysis Timeframe: 15 minutes
Index Weight: 20% (favor pairs for speed)
Signal Threshold: 0.3% (sensitive triggers)
#### 📈 Intraday Profile (10M-1H Charts)
For positions held for a few hours:
Lookback: 12 periods (balanced sensitivity)
Analysis Timeframe: 4 hours
Index Weight: 40% (balanced approach)
Signal Threshold: 0.4% (moderate sensitivity)
#### 📊 Swing Profile (4H-Daily Charts)
For positions held for a few days:
Lookback: 21 periods (stable analysis)
Analysis Timeframe: Daily
Index Weight: 60% (favor indices for stability)
Signal Threshold: 0.5% (conservative triggers)
#### 📆 Position Profile (Weekly+ Charts)
For positions held for a few weeks:
Lookback: 30 periods (long-term view)
Analysis Timeframe: Weekly
Index Weight: 70% (heavily favor indices)
Signal Threshold: 0.6% (very conservative)
### Entry Timing
Wait for clear LONG 🚀 or SHORT 🐻 signals
Avoid trading during NEUTRAL ⚪ periods
Look for signal confirmations on multiple timeframes
### Risk Management
Stronger signals (higher relative strength values) suggest higher probability trades
Use appropriate position sizing based on signal strength
Consider the trading style profile when setting stop losses and take profits
💡 Pro Tip: The indicator works best when combined with your existing technical analysis. Use currency strength to identify which pairs to trade, then use your favorite technical indicators to determine when to enter and exit.
## 🔧 Key Features
28+ Forex Pairs Analysis: Comprehensive coverage of major currency relationships
8 Currency Indices Integration: DXY, EXY, BXY, JXY, CXY, AXY, SXY, ZXY for enhanced accuracy
Smart Auto-Optimization: Automatically adapts to your trading style and timeframe
ATR Normalization: Fair comparison across different currency pairs and volatility levels
Real-Time Signals: Clear LONG/SHORT/NEUTRAL signals with visual markers
Performance Optimized: Efficient tuple-based data requests minimize external calls
User-Friendly Interface: Simplified settings with comprehensive tooltips
Multi-Timeframe Support: Works on any timeframe from 1-minute to monthly charts
Transform your forex trading with the power of currency strength analysis! 🚀
Dynamic Currency Strength IndexDescription:
This indicator calculates the relative strength of the base currency and quote currency of the currently selected forex pair. Instead of just using a single pair comparison (e.g., GBPUSD - AUDUSD), it determines currency strength using a basket of related pairs, making it more accurate and useful for trading decisions.
How It Works:
Extracts the base and quote currencies from the selected forex pair.
Calculates their individual strengths using multiple related forex pairs.
Displays the strength difference between the base and quote currencies.
How to Use:
✔️ If the strength difference is positive, the base currency is stronger → Bullish signal.
✔️ If the strength difference is negative, the quote currency is stronger → Bearish signal.
✔️ Use it to confirm trends, filter trades, and improve entry timing in forex trading.
💡 Ideal for traders using trend-based strategies (Dow Theory, HH-HL patterns, breakouts, etc.).
Forex Relative Strength MatrixTraders often feel uncertain about which Forex pair to open a position with. This indicator is designed to help in that regard.
This indicator was created as described in the book Swing Trading with Heiken Ashi and Stochastics. In the original, the author suggests using it for swing trading. The author recommends applying it to a monthly chart with an 8-period moving average to analyze the context.
The logic of the indicator is to measure the relative strength of each currency by checking if the price of each Forex pair is above or below a chosen moving average. If the price is above the moving average, the base currency is awarded 1 point, indicating strength. If below, it scores 0, indicating weakness. By accumulating points across multiple pairs, the indicator ranks currencies from strongest to weakest, helping traders identify potential pairs for trading.
Trend Identification:
After identifying relative strength, the trader should observe the general trend using a 100-period SMA on 4-hour charts. If the price is above the SMA, the trend is bullish; if below, it is bearish.
Buy Logic:
A buy is triggered when the base currency is strong (price is above the moving average) and the quote currency is weak (price is below the moving average). After identifying the trend direction, the entry is confirmed by a color change in Heiken Ashi candles (from red to green in an uptrend) and a stochastic crossover in the trend’s direction.
Sell Logic:
A sell is triggered when the base currency is weak (price is below the moving average) and the quote currency is strong (price is above the moving average). The sell entry is confirmed by a color change in Heiken Ashi candles (from green to red in a downtrend) and a stochastic crossover aligned with the trend.
Entry Chart:
The entry chart used is the 4-hour chart. The trader should look for entry signals following a pullback in the trend direction, using Heiken Ashi candles. Entry is made when the Heiken Ashi candles change color (from red to green in an uptrend) and there is a smooth crossover of the stochastic indicator in the trend’s direction.
It would also be possible to adapt the indicator for day trading strategies with targets of 1 to 2 days. Here is a recommended setup:
Relative Strength Identification (1-Hour Chart):
Instead of monthly charts, use a 1-hour chart to identify currency strength with a 20-period moving average.
The 20-period moving average on the 1-hour chart captures a balanced view of short- to medium-term direction, covering nearly a day’s worth of trading but with enough sensitivity for day trading.
General Trend (5-Minute Chart with 100 SMA):
On the 5-minute chart, observe the 100-period SMA to identify the general trend direction throughout the day.
Price above the 100 SMA indicates an uptrend, and below indicates a downtrend, confirming the movement in shorter timeframes.
Entry Chart and Signals (5-Minute Chart):
Use the 15-minute chart to look for entry opportunities, focusing on pullbacks in the main trend direction.
Entry Signals: Enter the position when Heiken Ashi candles change color in the trend direction (from red to green in an uptrend) and the stochastic indicator makes a smooth crossover in the trend’s direction.
Forex Strength IndicatorThis indicator will display the strength of 8 currencies, EUR, AUD, NZD, JPY, USD, GBP, CHF, and CAD. Each line will represent each currency. Alongside that, Fibonacci levels will be plotted based on a standard deviation from linear regression, with customizable lengths.
For more steady Fibonacci levels, use higher lengths for both Standard Deviations and Linear Regression. All currency lines come from moving averages with options like EMA, SMA, WMA, RMA, HMA, SWMA, and Linear Regression.
When lines of the active pair are far from each other, it means higher divergence in those currency strengths among the other pairs. The closer the lines are, the lower the divergence.
You can use the Fibonacci levels as points for the reversal or end of the current trend. When the lines cross can be used as a parameter for a more accurate signal of the next movement.
All 28 pairs are loaded from the same time frame and will use the same moving average for all of them
Alerts from the line crossing are available.
Major Currencies StrengthCompare some major currencies strength.
Supported currencies are:
USD
EUR
JPY
GBP
AUD
NZD
CAD
Best Currency Strength Indicator By Mahfuz AzimBest Currency Strength Indicator is a visual guide that demonstrates which currencies are currently strong, and which ones are weak.
FX Currency strength indicators include multiple calculation to choose from
1. Relative Strength Index ( RSI )
2. True Strength Index (TSI)
3. Absolute Strength Index (ASI)
4. Linear Regression Slope ( LRS )
5. Rate of Change ( ROC ) and
6. Z-Score