[STRATEGY] MA Cross ElevenThis script is a crossing of eleven different MA, with alerts and SL and TP.
The simplest is what works best...
SMA --> Simple
EMA --> Exponential
WMA --> Weighted
VWMA --> Volume Weighted
SMMA --> Smoothed
DEMA --> Double Exponential
TEMA --> Triple Exponential
HMA --> Hull
TMA --> Triangular
SSMA --> SuperSmoother filter
ZEMA --> Zero Lag Exponential
Using "once per bar close" repaint is 0%, but if you like risk can choose "once per bar", better profit.
Thanks to JustUncleL and his amazing sripts.
Enjoy!
www.tradingview.com
"Note: When using non-standard (Renko, Kagi, Line Break, Point and Figure, Heikin Ashi, Spread Charts) types of chart as a basis for strategy, you need to realize that the result will be different. The orders will be executed at the prices of this chart (e.g.for Heikin Ashi it’ll take Heikin Ashi prices (the average ones) not the real market prices). Therefore we highly recommend you to use standard chart type for strategies."
"Exponential"に関するスクリプトを検索

RSI + BB (EMA) + Dispersion (2.0)First version here
Initial data:
1) RSI
2) Bollinger Bands (Basis - EMA )
3) Dispersion (around basis)
Signal for purchase: RSI crosses the dispersion zone upwards
Signal for sale: RSI crosses the dispersion zone downwards
Buffer zone: white area, it is not recommended to make transactions.
--- Add ( 02.10.2018 )
1) RSI lines (overbought / oversold) = 70 / 30. Сan be changed in the settings.
2) Alerts:
• RSI line crossover Dispersion Zone (green)
• RSI line crossunder Dispersion Zone (red)

MA&EMA - 10 - LibertusHello all,
Did you ever wanted to have loads of MA's and EMA's on your screen? This is script for you.
It will help you track most important MA's and EMA's. You can hide ones you don't need or change them into MA/EMA you need but it's not here by default.
Good trading and best of luck!

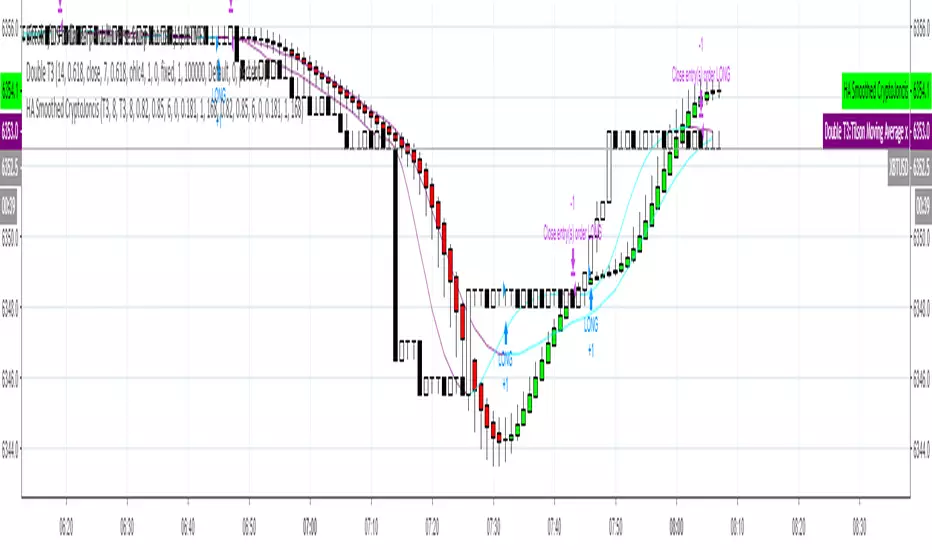
Heikin-Ashi Smoothed with option to change MA types CryptoJoncisPine Script version=3
Author CryptoJoncis
Heikin-Ashi Smoothed
The Heikin-Ashi Smoothed study is based upon the standard Heikin-Ashi study with additional moving average calculations. The following is the calculation formula for the bars:
1. The current bar Open, High, Low, Close values are smoothed individually by using the moving average type specified by the Moving Average Type 1 Input with a length/period specified by the Moving Average Period 1 Input.
2. The Heikin-Ashi bar Open, High, Low, Close values are set using the smoothed values from step 1. This is performed using the standard Heikin-Ashi formula.
3. The final Heikin-Ashi Open, High, Low, Close values are calculated by doing a second smoothing of the bar values from step 2 by using the moving average type specified by the Moving Average Type 2 Input with a length/period specified by the Moving Average Period 2 Input.
If you choose to tick the box where it offers to use only one smoothed HA then it skips the third/final step and you do not need to choose the second MA type for it to work.
Remember, using FRAMA, always make sure you use even number for length.
For simple Heikin-Ashi, please tick single smoothed and DEFAULT (Not smoothed as there are no MA used)
Heikin-Ashi bars are calculated:
1. Close = (Open + High + Low + Close) / 4
This is the average price of the current bar.
2. Open = (Open of Previous Bar + Close of Previous Bar) / 2
This is the midpoint of the previous bar.
3. High = Max of (High, Open, Close)
Highest value of the three.
4. Low = Min of (Low, Open, Close)
Lowest value of the three.
Any questions/suggestions/errors or spelling mistakes? Please leave a comment and let me know. I will try to fix it.
This took me few days to finish, so I hope you will find it useful.
Would you like to have more MA type choices? Please comment down with any other which aren't included in this indicator and I will research them and add.
MA included in this script:
Tillson Moving Average (T3)
Double Exponential Moving Average (DEMA)
Arnaud Legoux Moving Average (ALMA)
Least Squares Moving Average (LSMA)
Simple Moving Average (SMA)
Exponential Moving Average (EMA)
Weighted Moving Average (WMA)
Smoothed Moving Average (SMMA)
Triple Exponential Moving Average (TEMA)
Hull Moving Average (HMA)
Adaptive moving average (AMA)
Fractal Adaptive Moving Average (FAMA)
Variable Index Dynamic Average (VIDYA)
Triangular Moving Average (TRIMA)
You can use,publish,modify this code in any way as you wish, but only if you reference me after.
You are not allowed to sell it as it is.
If this code is useful to you, then consider to buy me a coffee (or better a pint of beer) by donating Bitcoin or Etherium to:
BTC: 3FiBnveHo3YW6DSiPEmoCFCyCnsrWS3JBR
ETH: 0xac290B4A721f5ef75b0971F1102e01E1942A4578
References:
www.sierrachart.com
www.investopedia.com
www.binarytribune.com
www.investopedia.com
www.stockfetcher.com
www.mql5.com
www.incrediblecharts.com
help.cqg.com
www.blastchart.com
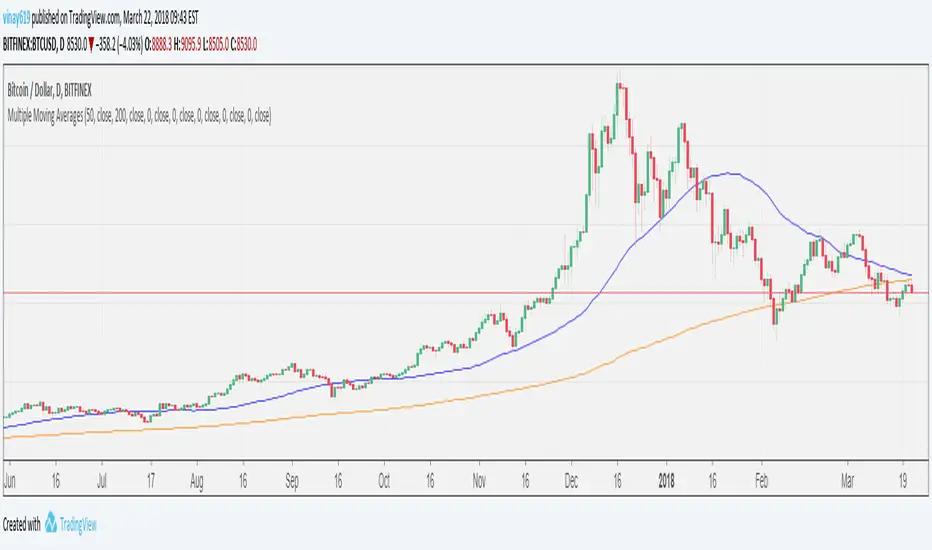
Multiple Moving AveragesFeatures
- 7 MAs in one indicator
- User changeable period for each MA
- SMA/EMA user selectable option for each MA
- Source (close,open,high,low etc) user selectable option for each MA
XPloRR MA-Trailing-Stop StrategyXPloRR MA-Trailing-Stop Strategy
Long term MA-Trailing-Stop strategy with Adjustable Signal Strength to beat Buy&Hold strategy
None of the strategies that I tested can beat the long term Buy&Hold strategy. That's the reason why I wrote this strategy.
Purpose: beat Buy&Hold strategy with around 10 trades. 100% capitalize sold trade into new trade.
My buy strategy is triggered by the fast buy EMA (blue) crossing over the slow buy SMA curve (orange) and the fast buy EMA has a certain up strength.
My sell strategy is triggered by either one of these conditions:
the EMA(6) of the close value is crossing under the trailing stop value (green) or
the fast sell EMA (navy) is crossing under the slow sell SMA curve (red) and the fast sell EMA has a certain down strength.
The trailing stop value (green) is set to a multiple of the ATR(15) value.
ATR(15) is the SMA(15) value of the difference between the high and low values.
The scripts shows a lot of graphical information:
The close value is shown in light-green. When the close value is lower then the buy value, the close value is shown in light-red. This way it is possible to evaluate the virtual losses during the trade.
the trailing stop value is shown in dark-green. When the sell value is lower then the buy value, the last color of the trade will be red (best viewed when zoomed)(in the example, there are 2 trades that end in gain and 2 in loss (red line at end))
the EMA and SMA values for both buy and sell signals are shown as a line
the buy and sell(close) signals are labeled in blue
How to use this strategy?
Every stock has it's own "DNA", so first thing to do is tune the right parameters to get the best strategy values voor EMA , SMA, Strength for both buy and sell and the Trailing Stop (#ATR).
Look in the strategy tester overview to optimize the values Percent Profitable and Net Profit (using the strategy settings icon, you can increase/decrease the parameters)
Then keep using these parameters for future buy/sell signals only for that particular stock.
Do the same for other stocks.
Important : optimizing these parameters is no guarantee for future winning trades!
Here are the parameters:
Fast EMA Buy: buy trigger when Fast EMA Buy crosses over the Slow SMA Buy value (use values between 10-20)
Slow SMA Buy: buy trigger when Fast EMA Buy crosses over the Slow SMA Buy value (use values between 30-100)
Minimum Buy Strength: minimum upward trend value of the Fast SMA Buy value (directional coefficient)(use values between 0-120)
Fast EMA Sell: sell trigger when Fast EMA Sell crosses under the Slow SMA Sell value (use values between 10-20)
Slow SMA Sell: sell trigger when Fast EMA Sell crosses under the Slow SMA Sell value (use values between 30-100)
Minimum Sell Strength: minimum downward trend value of the Fast SMA Sell value (directional coefficient)(use values between 0-120)
Trailing Stop (#ATR): the trailing stop value as a multiple of the ATR(15) value (use values between 2-20)
Example parameters for different stocks (Start capital: 1000, Order=100% of equity, Period 1/1/2005 to now) compared to the Buy&Hold Strategy(=do nothing):
BEKB(Bekaert): EMA-Buy=12, SMA-Buy=44, Strength-Buy=65, EMA-Sell=12, SMA-Sell=55, Strength-Sell=120, Stop#ATR=20
NetProfit: 996%, #Trades: 6, %Profitable: 83%, Buy&HoldProfit: 78%
BAR(Barco): EMA-Buy=16, SMA-Buy=80, Strength-Buy=44, EMA-Sell=12, SMA-Sell=45, Strength-Sell=82, Stop#ATR=9
NetProfit: 385%, #Trades: 7, %Profitable: 71%, Buy&HoldProfit: 55%
AAPL(Apple): EMA-Buy=12, SMA-Buy=45, Strength-Buy=40, EMA-Sell=19, SMA-Sell=45, Strength-Sell=106, Stop#ATR=8
NetProfit: 6900%, #Trades: 7, %Profitable: 71%, Buy&HoldProfit: 2938%
TNET(Telenet): EMA-Buy=12, SMA-Buy=45, Strength-Buy=27, EMA-Sell=19, SMA-Sell=45, Strength-Sell=70, Stop#ATR=14
NetProfit: 129%, #Trade

Triple Simple Moving AveragesBased on AdventTrading's TEMA script, but using simple moving averages instead of exponential. Also changed the colours to be nicer.

Log-Space EMA Ribbon [Krypt]Similar to basic EMA Ribbon indicator except uses log-space transformation. Should be better on very long timeframes and for determining beginning of a bull market. The tradeoff is that it is slower than regular EMA near peaks (regular EMA will outperform this indicator when determining when to sell).

EMA Ribbon [Krypt]A convenient way to add a ribbon indicator (one indicator instead of multiple EMAs)

ALTDEL S/E Awesome OscillatorA simple customization of the Awesome Oscillator: allows you to change the moving averages (integer) as well as make them exponential.

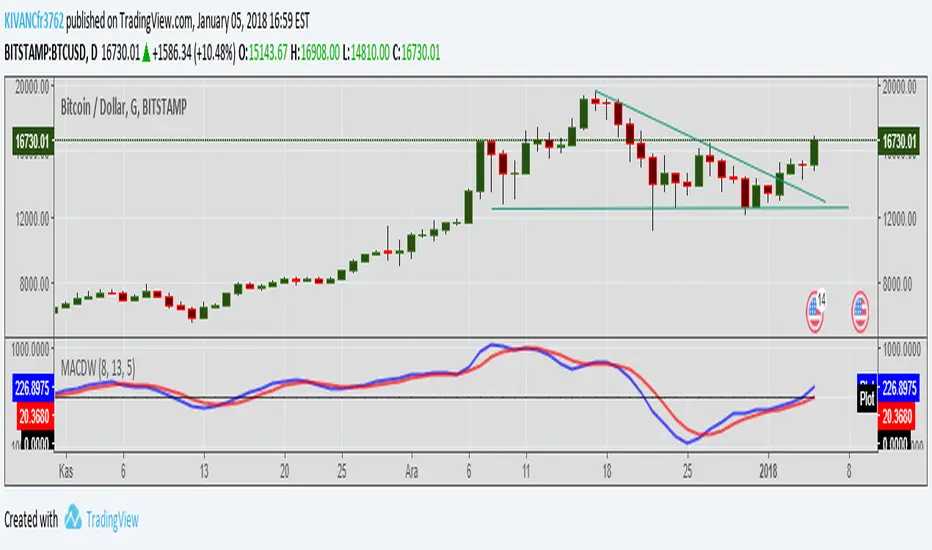
MACD WEIGHTEDA different style of MACD indicator with different period values of WEIGHTED MOVING AVERAGES INSTEAD OF EXPONENTIAL.
Default MOVING AVERAGES ARE
faster period: 8bars
slower period: 13 bars
signal period: 5 bars
TURKISH EXPLANATION:
MACD indikatörünün üssel yerine AĞIRLIKLI hareketli ortalamalar kullanılarak daha erken sinyaller alabilmek için daha kısa periyotlarla yorumlanması

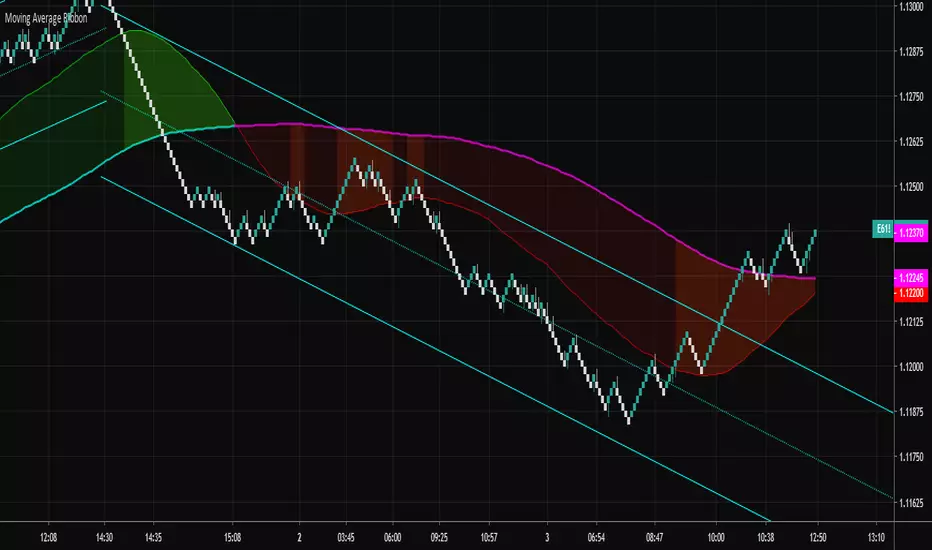
Moving Average RibbonA ribbon that uses a fast EMA, a slow EMA, and a signal EMA. By default the signal EMA is invisible.
When the fast EMA > slow EMA the default fill is green, and then red when the fast EMA < slow EMA. The signal EMA adds a 2nd flavor to the ribbon. When the fast EMA > slow EMA, if the signal is beneath the fast EMA, the ribbon fill changes its color to a brighter green. When the fast EMA < slow EMA, if the signal is above the fast EMA, the ribbon fill changes its color to a brighter red. Many times these little "fishhook" pullbacks are buying/shorting opportunities in the dominate trend.
Try settings of 8/21/8 Fast/Slow/Signal, with the "Zero-Lag Signal" check box checked. Zero-Lag is a simple algorithm that tries to remove as much lag as possible from an EMA. An 8 EMA will run "slower" than an 8 Zero-Lag EMA.
Additionally, 2 simple alerts are available for whenever the fast EMA crosses above the slow EMA, and the opposite.
Cheers.
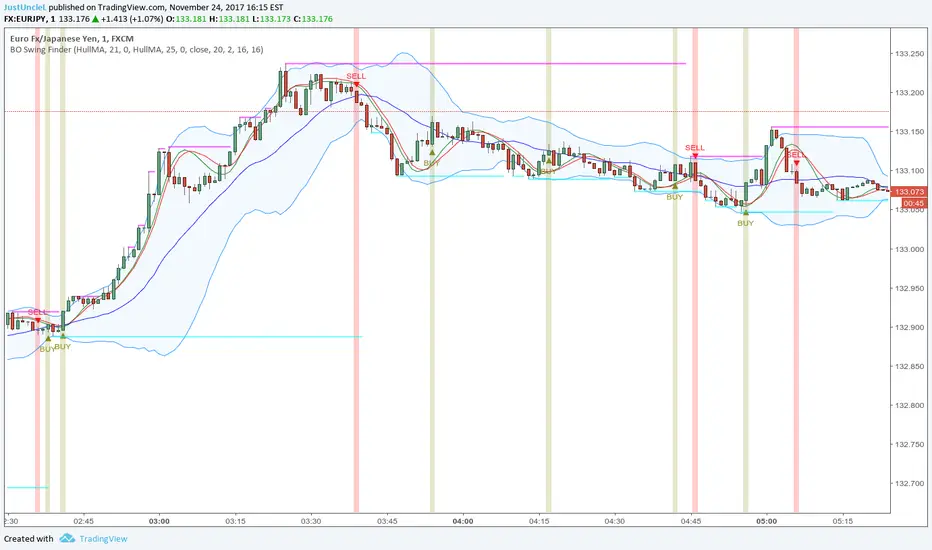
BO Swing Finder R0.6 by JustUncleLThis indicator alert study attempts to detect confirmed Swing points. It uses Bollinger Band centre line crosses as the main signal. The main detection occurs by looking for the first BB centre line cross that was initiated from outside the Bollinger Channel (alternatively KC channel can be used).
The optional HullMA (any any other MA pair) are used to confirm the swing direction. The indicator also plots the two KitKat Support and Resistance lines with optional High/Low labelling on KitKat1 lines.
This indicator tool is suitable for any time frame and can be traded with Binary Option (even 1min) orders (2-3 candle expiry) or as Forex trade orders. It is suitable for Currencies, Cryptocurrencies and Metals. May also be useful on other markets as well.
The MA filtering options, each MA line can be a different type, with an optional offset:
SMA = Simple Moving Average.
EMA = Exponential Moving Average.
WMA = Weighted Moving Average
VWMA = Volume Weighted Moving Average
SMMA = Smoothed Simple Moving Average.
DEMA = Double Exponential Moving Average
TEMA = Triple Exponential Moving Average.
HullMA = Hull Moving Average, fast moving MA.
SSMA = Ehlers Super Smoother Moving average, similar results to HullMA.
ZEMA = Near Zero Lag Exponential Moving Average.
TMA = Triangular (smoothed) Simple Moving Average.
NOTE: The signal calculations do occur on the current candle, so the state of the signal may re-build until the current candle is closed. I have designed the script to behave this way on purpose. This gives traders the option of
preparing their trade early or even taking the trade early if they want. Otherwise the trader can be more conservative and wait for signal candle to close, to give them a confirmed signal. (This is NOT re-painting as the historical signal states are fixed and will not change, unless you change some setup options.)
Hints:
1) As with all indicator and alerting tools, not all signals will yield a tradable successful swing. You need to apply you own analysis on each signal to determine the probability of success.
2) When using the MA to filter the signals you should use it for two types of filtering:
Supportive that confirm swing like fast moving MAs with fairly short lengths, eg HullMA(21,25).
Long Term Direction with smoother longer length MAs like SMMA(180,220) to show up swings back into direction of the longer term trends.
Inspiration: @Lyiness
References:
Momentum VMA KITKAT CROSS v2.1 by vdubus (- Vdubus_Channel www.vdubus.co.uk)
Moving Average RibbonRibbon of moving averages, select one of Hull, Weighted, Simple, or Exponential.

Trend Volume Accumulation R1 by JustUncleLThis simple indicator shows the Accumulated Volume within the current uptrend or downtrend. The uptrend/downtrend is detected by a change in direction of the candles which works very well with Heikin Ashi and Renko charts. Alternatively you can use a Moving average direction to indicate trend direction, which should work on any candle type.
You can select between 11 different types of moving average:
SMA = Simple Moving Average.
EMA = Exponential Moving Average.
WMA = Weighted Moving Average
VWMA = Volume Weighted Moving Average
SMMA = Smoothed Simple Moving Average.
DEMA = Double Exponential Moving Average
TEMA = Triple Exponential Moving Average.
HullMA = Hull Moving Average
SSMA = Ehlers Super Smoother Moving average
ZEMA = Near Zero Lag Exponential Moving Average.
TMA = Triangular (smoothed) Simple Moving Average.
Here is a sample chart using EMA length 6 for trend Direction:

Price Action Channel Master by JustUncleLThis indicator combines a number of PAC types into one indicator and will replace some of my previously PAC scripts (some were not published).
It draws a Moving Average (MA) channel based on various boundary criteria. Even though the MA choices are not limited to SMA and EMA, these would be the your first choices with most PAC requirements, feel free to experiment though.
Optional Bar colouring around that channel.
Options Available:
(1) Select between 11 different types of moving averages for the base (centre) MA line choices are :
SMA = Simple Moving Average (default)
EMA = Exponential Moving Average.
WMA = Weighted Moving Average
VWMA = Volume Weighted Moving Average
SMMA = Smoothed Simple Moving Average.
DEMA = Double Exponential Moving Average
TEMA = Triple Exponential Moving Average.
HullMA = Hull Moving Average
SSMA = Ehlers Super Smoother Moving average
ZEMA = Near Zero Lag Exponential Moving Average.
TMA = Triangular (smoothed) Simple Moving Average.
(2) Select Channel Boundary Criteria:
HILO = Channel boundaries based on High and Low MAs (default).
ATR = Channel boundaries are Multiplier * ATR distance from base line
PIP = Channel boundaries are Multiplier * PIPs distance from base line
STDEV = Channel boundaries are Multiplier * StdDev(price) distance from base line (this is the same as Bollinger bands if SMA is the base MA)
KC = Channel boundaries are Multiplier * StdDev(True Range) distance from base line (this is the same as Keltner channel if SMA is the base MA)
(3) Option to display coloured Candles around the Ribbon, the colouring uses the Default candle 3-tone colour scheme:
Lime = candle closed above Ribbon.
Red = candle closed below Ribbon.
Gray = Candle Closed inside Ribbon.
The Grab candles 6-tone colour scheme:
Lime = Bull candle closed above Ribbon.
Green = Bear candle closed above Ribbon.
Red = Bull candle closed below Ribbon.
DarkRed = Bear candle closed below Ribbon.
Aqua = Bull candle closed inside Ribbon.
Blue = Bear candle closed inside Ribbon.

Coloured MA R3-16 by JustUncleLThis indicator is an implementation of the coloured trend Moving Average, that includes some unique features. The Moving Average plot is coloured relative to it's direction and optionally display coloured Trend Bars using the standard 2-tone colours, or Grab candle style 4-tone colours.
Options:
1) Anchor Time Frame to a Highter Time frame, eg. set anchor to 1440 and length set to 8, the script will re-size the MA length needed to display on the current TF, say 60.
2) You can select between 11 different types of moving averages, each MA line can be a different type:
SMA = Simple Moving Average.
EMA = Exponential Moving Average.
WMA = Weighted Moving Average
VWMA = Volume Weighted Moving Average
SMMA = Smoothed Simple Moving Average.
DEMA = Double Exponential Moving Average
TEMA = Triple Exponential Moving Average.
HullMA = Hull Moving Average
SSMA = Ehlers Super Smoother Moving average
ZEMA = Near Zero Lag Exponential Moving Average.
TMA = Triangular (smoothed) Simple Moving Average.
3) Option to display coloured Candles around the Ribbon, the colouring -
Standard candle colours:
Lime = candle closed above Ribbon.
Red = candle closed below Ribbon.
The Grab candles scheme:
Lime = Bull candle closed above Ribbon.
Green = Bear candle closed above Ribbon.
Red = Bull candle closed below Ribbon.
DarkRed = Bear candle closed below Ribbon.

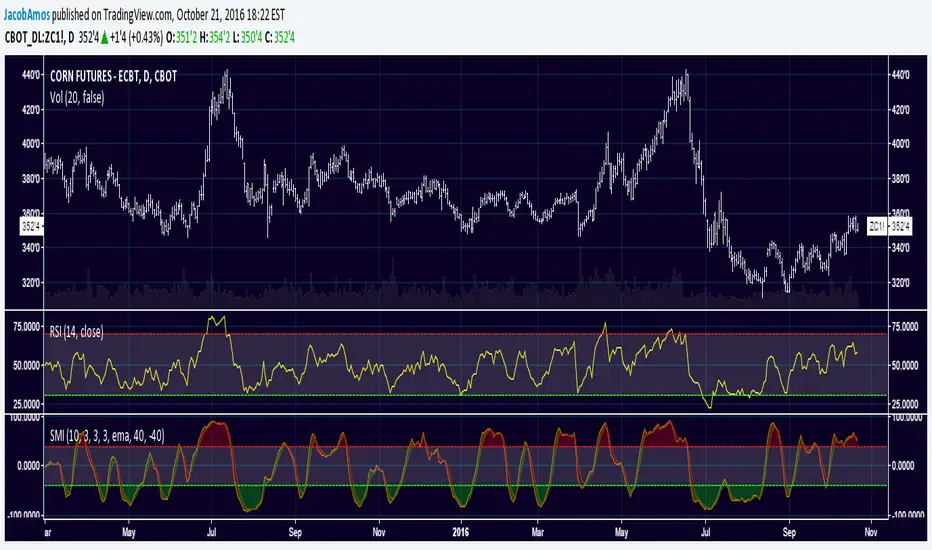
Stochastic Momentum IndexThis is an implementation of the Stochastic Momentum Index from William Blau's his article in Stocks & Commodities .
This also allows the use of various different kinds of moving averages for the signal line. Options for this argument are:
sma (simple moving average)
ema (exponential moving average)
wma (weighted moving average)
trima (triangular moving average)
zlema (zero-lag exponential moving average)
dema (double exponential moving average)
tema (triple exponential moving average)
hma (hull moving average)
Kalman Ema Crosses - [JTCAPITAL]Kalman EMA Crosses - is a modified way to use Kalman Filters applied on Exponential Moving Averages (EMA Crosses) for Trend-Following.
Credits for the kalman function itself goes to @BackQuant
The Kalman filter is a recursive smoothing algorithm that reduces noise from raw price or indicator data, and in this script it is applied both directly to price and on top of EMA calculations. The goal is to create cleaner, more reliable crossover signals between two EMAs that are less prone to false triggers caused by volatility or market noise.
The indicator works by calculating in the following steps:
Source Selection
The script starts by selecting the price input (default is Close, but can be adjusted). This chosen source is the foundation for all further smoothing and EMA calculations.
Kalman Filtering on Price
Depending on user settings, the selected source is passed through one of two independent Kalman filters. The filter takes into account process noise (representing expected market randomness) and measurement noise (representing uncertainty in the price data). The Kalman filter outputs a smoothed version of price that minimizes noise and preserves underlying trend structure.
EMA Calculation
Two exponential moving averages (EMA 1 and EMA 2) are then computed on the Kalman-smoothed price. The lengths of these EMAs are fully customizable (default 15 and 25).
Kalman Filtering on EMA Values
Instead of directly using raw EMA curves, the script applies a second layer of Kalman filtering to the EMA values themselves. This step significantly reduces whipsaw behavior, creating smoother crossovers that emphasize real momentum shifts rather than temporary volatility spikes.
Trend Detection via EMA Crossovers
-A bullish trend is detected when EMA 1 (fast) crosses above EMA 2 (slow).
-A bearish trend is detected when EMA 1 crosses below EMA 2.
The detected trend state is stored and used to dynamically color the plots.
Visual Representation
Both EMAs are plotted on the chart. Their colors shift to blue during bullish phases and purple during bearish phases. The area between the two EMAs is filled with a shaded region to clearly highlight trending conditions.
Buy and Sell Conditions:
-Buy Condition: When the Kalman-smoothed EMA 1 crosses above the Kalman-smoothed EMA 2, a bullish crossover is confirmed.
-Sell Condition: When EMA 1 crosses below EMA 2, a bearish crossover is confirmed.
Users may enhance the robustness of these signals by adjusting process noise, measurement noise, or EMA lengths. Lower measurement noise values make the filter react faster (but potentially noisier), while higher values make it smoother (but slower).
Features and Parameters:
-Source: Selectable price input (Close, Open, High, Low, etc.).
-EMA 1 Length: Defines the fast EMA period.
-EMA 2 Length: Defines the slow EMA period.
-Process Noise: Controls how much randomness the Kalman filter assumes in price dynamics.
-Measurement Noise: Controls how much uncertainty is assumed in raw input data.
-Kalman Usage: Option to apply Kalman filtering either before EMA calculation (on price) or after (on EMA values).
Specifications:
Kalman Filter
The Kalman filter is an optimal recursive algorithm that estimates the state of a system from noisy measurements. In trading, it is used to smooth prices or indicator values. By balancing process noise (expected volatility) with measurement noise (data uncertainty), it generates a smoothed signal that reacts adaptively to market conditions.
Exponential Moving Average (EMA)
An EMA is a weighted moving average that emphasizes recent data more heavily than older data. This makes it more responsive than a simple moving average (SMA). EMAs are widely used to identify trends and momentum shifts.
EMA Crossovers
The crossing of a fast EMA above a slow EMA suggests bullish momentum, while the opposite suggests bearish momentum. This is a cornerstone technique in trend-following systems.
Dual Kalman Filtering
Applying Kalman both to raw price and to the EMAs themselves reduces whipsaws further. It creates crossover signals that are not only smoothed but also validated across two levels of noise reduction. This significantly enhances signal reliability compared to traditional EMA crossovers.
Process Noise
Represents the filter’s assumption about how much the underlying market can randomly change between steps. Higher values make the filter adapt faster to sudden changes, while lower values make it more stable.
Measurement Noise
Represents uncertainty in price data. A higher measurement noise value means the filter trusts the model more than the observed data, leading to smoother results. A lower value makes the filter more reactive to observed price fluctuations.
Trend Coloring & Fill
The use of dynamic colors and filled regions provides immediate visual recognition of trend states, helping traders act faster and with greater clarity.
Enjoy!

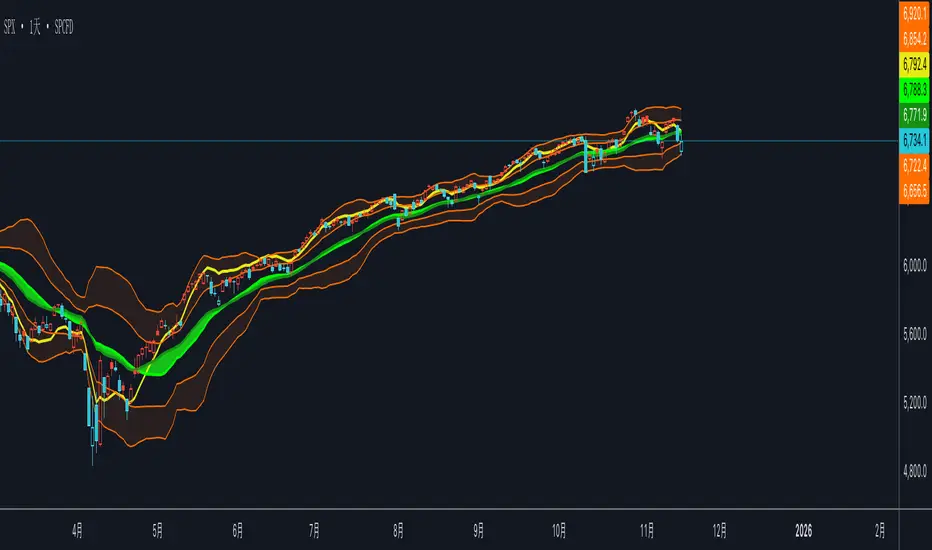
双布林Dual Bollinger Bands
This technical indicator combines dual Bollinger Bands with multiple moving average overlays to provide a comprehensive view of price trends, volatility, and potential support/resistance zones.
**Components:**
1. **TEMA21 (Triple Exponential Moving Average)**
- Yellow line representing the 21-period TEMA
- Provides smooth trend direction with reduced lag compared to traditional moving averages
- Calculated using three sequential EMAs to filter out market noise
2. **SMA21 & EMA21 Channel**
- Green filled area between the 21-period Simple Moving Average and Exponential Moving Average
- Visualizes the dynamic zone where these two averages interact
- Helps identify trend strength when price stays above/below this channel
3. **MA21 (Simple Moving Average)**
- Bright green line showing the 21-period SMA
- Classic trend-following indicator
4. **EMA21 (Exponential Moving Average)**
- Dark green line displaying the 21-period EMA
- More responsive to recent price changes than SMA
5. **Dual Bollinger Bands**
- **Outer Bands (2 Standard Deviations)**: Orange lines marking the traditional Bollinger Band boundaries
- **Inner Bands (1 Standard Deviation)**: Orange lines creating a tighter volatility zone
- **Orange Shaded Areas**: Highlight the zones between outer and inner bands
- All bands use a 21-period basis and are fully customizable
**Settings:**
- Length: 21 (adjustable)
- Source: Close price (adjustable)
- Outer Band StdDev: 2.0 (adjustable)
- Inner Band StdDev: 1.0 (adjustable)
- Offset: 0 (adjustable from -500 to +500)
**Usage:**
This indicator is ideal for identifying trend direction, volatility expansion/contraction, and potential reversal zones. The dual Bollinger Bands provide multiple levels for support/resistance analysis, while the moving averages confirm trend strength and direction.
CandelaCharts - Trend Oscillator 📝 Overview
Trend Oscillator is a simple yet effective trend identification tool that uses the relationship between two exponential moving averages (EMAs) to determine market direction. It calculates the spread between a fast and slow EMA, applies a bias multiplier, and smooths the result to produce a clean oscillator that oscillates above and below a zero line. When the oscillator is above zero, the trend is considered bullish (upward); when below zero, it's bearish (downward). The indicator provides clear visual feedback through color-coded plots and optional price bar coloring, making it easy to identify trend direction at a glance.
📦 Features
This section highlights the core capabilities you'll rely on most.
Dual EMA system — Uses a fast EMA (default 9) and slow EMA (default 21) to capture trend momentum and direction.
Bias multiplier — Applies a small multiplier (default 1.001) to the EMA spread, providing a slight bias that helps filter noise and confirm trend strength.
Smoothed output — Applies an additional EMA smoothing (default 5 periods) to the raw spread, creating a cleaner, less choppy oscillator line.
Zero-line reference — Plots a horizontal zero line that serves as the critical threshold between bullish and bearish conditions.
Color-coded visualization — Automatically colors the oscillator line green/lime when bullish (above zero) and red when bearish (below zero).
Price bar coloring — Optional feature to color price bars based on the current trend direction, providing immediate visual context on the main chart.
Customizable parameters — Adjust EMA lengths, bias multiplier, smoothing period, and colors to match your trading style and timeframe.
⚙️ Settings
Use these controls to fine-tune the oscillator's sensitivity, appearance, and behavior.
Fast EMA Length — Period for the fast exponential moving average (default: 9). Lower values make the indicator more responsive to price changes.
Slow EMA Length — Period for the slow exponential moving average (default: 21). Higher values create a smoother baseline for trend identification.
Bias Multiplier — Multiplier applied to the EMA spread (default: 1.001). Small adjustments can help filter minor whipsaws and confirm trend strength.
Smoothing Length — Period for smoothing the raw spread calculation (default: 5). Higher values create a smoother oscillator line but may lag price action.
Colors — Set the bullish (default: lime) and bearish (default: red) colors for the oscillator line.
Color Price Bars — Toggle to enable/disable coloring of price bars based on the current trend direction.
⚡️ Showcase
Oscillator Line
Bar Coloring
Divergences
📒 Usage
Follow these steps to effectively use Trend Oscillator for trend identification and trading decisions.
1) Select your timeframe — The indicator works across all timeframes, but higher timeframes (daily, weekly, monthly) typically provide more reliable trend signals with less noise. Lower timeframes (1m, 5m, 15m) may produce more frequent but potentially less reliable signals. Consider your trading style: swing traders benefit from daily/weekly charts, while day traders can use 15m/1h timeframes. Always align the indicator's sensitivity with your timeframe choice.
2) Adjust EMA lengths — The default 9/21 combination works well for most cases. For faster signals, try 5/13; for slower, more conservative signals, try 12/26 or 20/50. Match the lengths to your trading style and timeframe.
3) Interpret the zero line — When the oscillator is above zero (green/lime), the trend is bullish. When below zero (red), the trend is bearish. The further from zero, the stronger the trend.
4) Watch for crossovers — Trend changes occur when the oscillator crosses the zero line. A cross from below to above indicates a shift to bullish; from above to below indicates a shift to bearish.
5) Identify divergences — Divergences can signal potential trend reversals. Bullish divergence : price makes lower lows while the oscillator makes higher lows (suggests weakening bearish momentum). Bearish divergence : price makes higher highs while the oscillator makes lower highs (suggests weakening bullish momentum). Divergences are most reliable when they occur near extreme levels and should be confirmed with price action before taking trades.
6) Use smoothing wisely — The smoothing parameter helps reduce noise but adds lag. Lower smoothing (3-5) is more responsive; higher smoothing (7-10) is more stable but slower to react.
7) Combine with price action — Use the oscillator to confirm trend direction, then look for entry opportunities when price pulls back in the direction of the trend. The optional price bar coloring helps visualize trend alignment on the main chart.
8) Filter with bias multiplier — The bias multiplier can help reduce false signals. Experiment with values between 1.000 and 1.005 to find the sweet spot for your instrument and timeframe.
🚨 Alerts
There are no built-in alerts in this version.
⚠️ Disclaimer
Trading involves significant risk, and many participants may incur losses. The content on this site is not intended as financial advice and should not be interpreted as such. Decisions to buy, sell, hold, or trade securities, commodities, or other financial instruments carry inherent risks and are best made with guidance from qualified financial professionals. Past performance is not indicative of future results.

EMA Dynamic Crossover Detector with Real-Time Signal TableDescriptionWhat This Indicator Does:This indicator monitors all possible crossovers between four key exponential moving averages (20, 50, 100, and 200 periods) and displays them both visually on the chart and in an organized data table. Unlike standard EMA indicators that only plot the lines, this tool actively detects every crossover event, marks the exact crossover point with a circle, records the precise price level, and maintains a running log of all crossovers during the trading session. It's designed for traders who want comprehensive EMA crossover analysis without manually watching multiple moving average pairs.Key Features:
Four Essential EMAs: Plots 20, 50, 100, and 200-period exponential moving averages with color-coded thin lines for clean chart presentation
Complete Crossover Detection: Monitors all 6 possible EMA pair combinations (20×50, 20×100, 20×200, 50×100, 50×200, 100×200) in both directions
Precise Price Marking: Places colored circles at the exact average price where crossovers occur (not just at candle close)
Real-Time Signal Table: Displays up to 10 most recent crossovers with timestamp, direction, exact price, and signal type
Session Filtering: Only records crossovers during active trading hours (10:00-18:00 Istanbul time) to avoid noise from low-liquidity periods
Automatic Daily Reset: Clears the signal table at the start of each new trading day for fresh analysis
Built-In Alerts: Two alert conditions (bullish and bearish crossovers) that can be configured to send notifications
How It Works:The indicator calculates four exponential moving averages using the standard EMA formula, then continuously monitors for crossover events using Pine Script's ta.crossover() and ta.crossunder() functions:Bullish Crossovers (Green ▲):
When a faster EMA crosses above a slower EMA, indicating potential upward momentum:
20 crosses above 50, 100, or 200
50 crosses above 100 or 200
100 crosses above 200 (Golden Cross when it's the 50×200)
Bearish Crossovers (Red ▼):
When a faster EMA crosses below a slower EMA, indicating potential downward momentum:
20 crosses below 50, 100, or 200
50 crosses below 100 or 200
100 crosses below 200 (Death Cross when it's the 50×200)
Price Calculation:
Instead of marking crossovers at the candle's close price (which might not be where the actual cross occurred), the indicator calculates the average price between the two crossing EMAs, providing a more accurate representation of the crossover point.Signal Table Structure:The table in the top-right corner displays four columns:
Saat (Time): Exact time of crossover in HH:MM format
Yön (Direction): Arrow indicator (▲ green for bullish, ▼ red for bearish)
Fiyat (Price): Calculated average price at the crossover point
Durum (Status): Signal classification ("ALIŞ" for buy signals, "SATIŞ" for sell signals) with color-coded background
The table shows up to 10 most recent crossovers, automatically updating as new signals appear. If no crossovers have occurred during the session within the time filter, it displays "Henüz kesişim yok" (No crossovers yet).EMA Color Coding:
EMA 20 (Aqua/Turquoise): Fastest-reacting, most sensitive to recent price changes
EMA 50 (Green): Short-term trend indicator
EMA 100 (Yellow): Medium-term trend indicator
EMA 200 (Red): Long-term trend baseline, key support/resistance level
How to Use:For Day Traders:
Monitor 20×50 crossovers for quick entry/exit signals within the day
Use the time filter (10:00-18:00) to focus on high-volume trading hours
Check the signal table throughout the session to track momentum shifts
Look for confirmation: if 20 crosses above 50 and price is above EMA 200, bullish bias is stronger
For Swing Traders:
Focus on 50×200 crossovers (Golden Cross/Death Cross) for major trend changes
Use higher timeframes (4H, Daily) for more reliable signals
Wait for price to close above/below the crossover point before entering
Combine with support/resistance levels for better entry timing
For Position Traders:
Monitor 100×200 crossovers on daily/weekly charts for long-term trend changes
Use as confirmation of major market shifts
Don't react to every crossover—wait for sustained movement after the cross
Consider multiple timeframe analysis (if crossovers align on weekly and daily, signal is stronger)
Understanding EMA Hierarchies:The indicator becomes most powerful when you understand EMA relationships:Bullish Hierarchy (Strongest to Weakest):
All EMAs ascending (20 > 50 > 100 > 200): Strong uptrend
20 crosses above 50 while both are above 200: Pullback ending in uptrend
50 crosses above 200 while 20/50 below: Early trend reversal signal
Bearish Hierarchy (Strongest to Weakest):
All EMAs descending (20 < 50 < 100 < 200): Strong downtrend
20 crosses below 50 while both are below 200: Rally ending in downtrend
50 crosses below 200 while 20/50 above: Early trend reversal signal
Trading Strategy Examples:Pullback Entry Strategy:
Identify major trend using EMA 200 (price above = uptrend, below = downtrend)
Wait for pullback (20 crosses below 50 in uptrend, or above 50 in downtrend)
Enter when 20 re-crosses 50 in the trend direction
Place stop below/above the recent swing point
Exit when 20 crosses 50 against the trend again
Golden Cross/Death Cross Strategy:
Wait for 50×200 crossover (appears in the signal table)
Verify: Check if crossover occurs with increasing volume
Entry: Enter in the direction of the cross after a pullback
Stop: Place stop below/above the 200 EMA
Target: Swing high/low or when opposite crossover occurs
Multi-Crossover Confirmation:
Watch for multiple crossovers in the same direction within a short period
Example: 20×50 crossover followed by 20×100 = strengthening momentum
Enter after the second confirmation crossover
More crossovers = stronger signal but also means you're entering later
Time Filter Benefits:The 10:00-18:00 Istanbul time filter prevents recording crossovers during:
Pre-market volatility and gaps
Low-volume overnight sessions (for 24-hour markets)
After-hours erratic movements
