"Oil"に関するスクリプトを検索

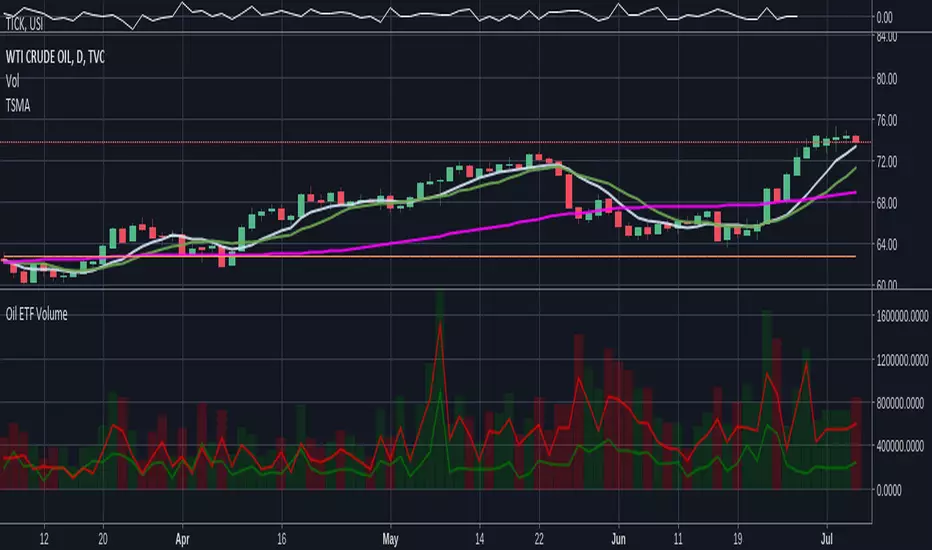
Oil ETF VolumeDirexxion Daily has both 'bear' and 'bull' oil ETFs. This tracks the volume in both combined. It also tracks them individually: the bear ETF is the red line, and bull the green.
NOTE: the color of the volume bars is determined by whatever ticker you're currently looking at, and whether current close is gt/lt previous close. It is intended to be used while looking at the USOIL chart. The colors will be inverted if you're looking at the 'bear' ETF! as the higher closes will actually mean price is going down :D
Gas/Oil SpreadGas/Oil Spread Analyzer with Static Overbought/Oversold Zones
This indicator measures the spread between the actual price of natural gas and its oil-based equivalent, derived from a defined oil/gas ratio. It helps traders identify potential mispricings and mean-reversion opportunities between the two energy commodities.
Key Features:
- Calculates spread: Gas Price – Oil-Based Equivalent Price
- Supports dynamic or static oil/gas ratio
- Plots a smoothed version of the spread (SMA)
- Displays static overbought and oversold zones to highlight extreme deviations
Use Cases:
- Detect overvalued or undervalued gas relative to oil
- Spot potential reversion setups in intermarket trading
- Evaluate energy market dislocations and hedging opportunities

Oil/gas ratio MAOil/Gas Ratio-Based Equivalent Price
This indicator calculates the gas-equivalent price based on the current oil price and a defined oil/gas ratio. It helps identify relative overvaluation or undervaluation of natural gas compared to oil.
Features:
- Choose between a static or dynamic (SMA-based) oil/gas ratio
- Displays the fair value of gas derived from oil prices
- Works with any oil ticker symbol (e.g. BRENT, USOIL, etc.)
Useful for traders analyzing intermarket relationships and looking for relative value signals between energy commodities.

Strategy Oil Z ScoreObjective is to find forward looking indicators to find good entries into major index's.
In similar vein to my Combo Z Score script I have implemented one looking at oil and oil volatility. Interestingly the script out performs WITHOUT applying the EMA in longer timeframes but under performs in shorter timeframes, for example 2007 vs 2019. Likely due to the bullish nature of the past decade (by and large). You have some options on the underlying included Oil vs OVX (Best), MOVE vs OVX and VIX vs OVX. Oil vs OVX out performs Combo Z Script. Favours Spy over QQQ or derivations (SPXL etc).

Crude Oil: Backwardation Vs ContangoCrude Oil, CL
Plots Futures Curve: Futures contract prices over the next 3.5 years; to easily visualize Backwardation Vs Contango(carrying charge) markets.
Carrying charge (contract prices increasing into the future) = normal, representing the costs of carrying/storage of a commodity. When this is flipped to Backwardation(As the above; contract prices decreasing into the future): it's a bullish sign: Buyers want this commodity, and they want it NOW.
Note: indicator does not map to time axis in the same way as price; it simply plots the progression of contract months out into the future; left to right; so timeframe DOESN'T MATTER for this plot
TO UPDATE (every year or so): in REQUEST CONTRACTS section, delete old contracts (top) and add new ones (bottom). Then in PLOTTING section, Delete old contract labels (bottom); add new contract labels (top); adjust the X in 'bar_index-(X+_historical)' numbers accordingly
This is one of several similar Futures Curve indicators: Meats | Metals | Grains | VIX | Crude Oil
If you want to build from this; to work on other commodities; be aware that Tradingview limits the number of contract calls to 40 (hence the multiple indicators)
Tips:
-Right click and reset chart if you can't see the plot; or if you have trouble with the scaling.
-Right click and add to new scale if you prefer this not to overlay directly on price. Or move to new pane below.
-If this takes too long to load (due to so many security calls); comment out the more distant future half of the contracts; and their respective labels. Or comment out every other contract and every other label if you prefer.
--Added historical input: input days back in time; to see the historical shape of the Futures curve via selecting 'days back' snapshot
updated 20th June 2022
© twingall

Oil Price Prediction (Highly Accurate)It's a little-known fact that gold prices move preceded oil prices by 20 months.
If you don't believe me here is a short video from Tom McClellan discussing this www.cnbc.com
This gives us one of the best and highly accurate indicators of what oil will do in the months to come.
HOW TO USE.
When adding the script to your charts it's important to make a couple of adjustments.
Click the triple dots (...), scroll down to pin to scale, and click pin to new scale.
Rght-click the new scale and click auto (fits data to screen)
Go into the indicator settings and turn off the red line.
What you'll be left with is a price projection on where oil prices will go. This becomes your 30,000-foot view. It is important for traders to know if they're coming into a bullish, bearish or consolidating market and this indicator does that.
Its important to mention this is for Monthly charts.
Happy Trading


EIA Crude Oil Stock StatisticsJapanese below / 日本語説明は下記
Dear Oil Traders/Investors,
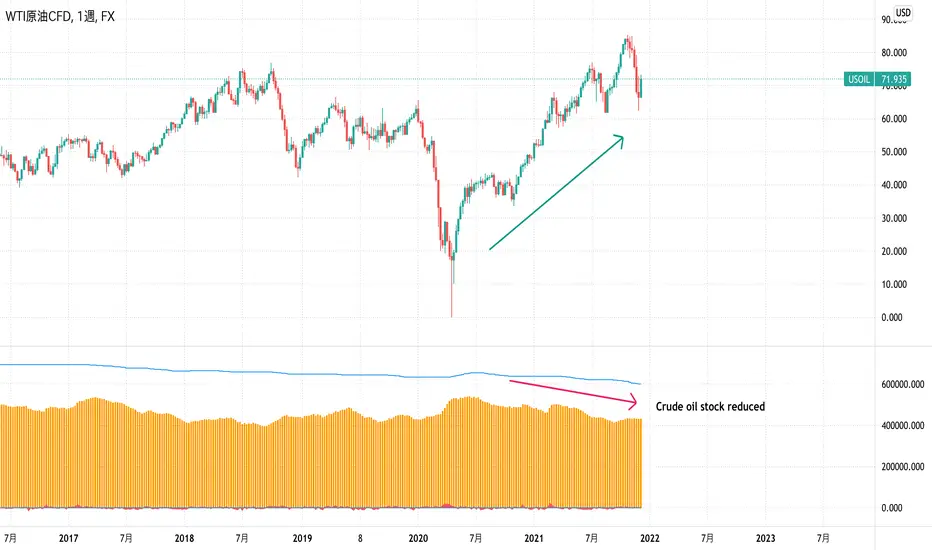
I have created this indicator which shows EIA crude oil stock statistics provided by EIA(U.S. Energy Information Administration).
Like other commodities, oil prices are highly affected by demand and supply and increase/decrease of crude oil stock cause crude oil price fluctuation.
This indicator is created to help oil traders/investors easily analyze crude oil statistics along with price movement.
It displays the following data as per data released by EIA on weekly basis. (Data source is quandle.com)
-Crude Oil Ending Stock
-Crude Oil SPR Ending Stock
-Stock changes from previous week(Calculated by the indicator)
-% changes(Calculated by the indicator)
Enjoy!
============================
原油トレーダー/投資家の皆さん
EIA(米エネルギー省エネルギー情報局)が公表している原油在庫統計をサブウィンドウに表示するインジケーターを開発しました。
他のコモディティと同様に、原油価格は需要と供給に大きく影響を受けます。
特に原油在庫の増減は原油価格を変動させる要因の一つです。
このインジケーターは原油トレーダー/投資家が原油在庫統計を価格の動きとともに容易に分析できることを目的としています。
EIAから週単位で公開されるデータのうち、以下のデータを表示します。(データソースはquandle.comです。)
-原油在庫
-SPR在庫
-原油在庫変動数(対前週比)
-原油在庫変動率(%)(対前週比)
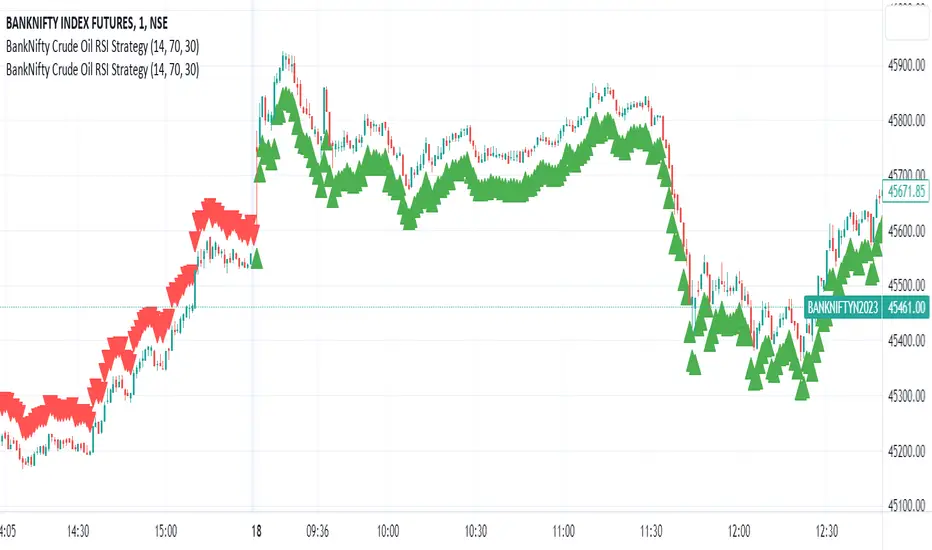
BankNifty Crude Oil RSI Strategy
The "BankNifty Crude Oil RSI Strategy" is a trading strategy that combines the BankNifty index with the WTI Crude Oil price index using the Relative Strength Index (RSI) as the primary indicator. The strategy aims to generate buy and sell signals based on the RSI of the Crude Oil price index, which might influence the BankNifty index.
Here's how the strategy works step by step:
Data Fetching:
The strategy fetches the daily closing prices of WTI Crude Oil from the provided TradingView link "TVC:USOIL" using the request.security function.
RSI Calculation:
The Relative Strength Index (RSI) is calculated using the closing prices of WTI Crude Oil. The RSI is a momentum oscillator that measures the speed and change of price movements. It oscillates between 0 and 100, indicating overbought conditions when above a specified threshold (overbought level) and oversold conditions when below a specified threshold (oversold level).
Buy and Sell Conditions:
The strategy defines two conditions based on the RSI values:
Buy Signal: When the Crude Oil RSI falls below a specified rsiOversold level (default is 30), the strategy generates a buy signal. This implies that the Crude Oil is in an oversold condition, and there might be a potential buying opportunity in the BankNifty index.
Sell Signal: When the Crude Oil RSI rises above a specified rsiOverbought level (default is 70), the strategy generates a sell signal. This implies that the Crude Oil is in an overbought condition, and there might be a potential selling opportunity in the BankNifty index.
Buy and Sell Signal Visualization:
The strategy uses the plotshape function to plot triangular shapes (upward for buy and downward for sell) below and above the price bars, respectively, to indicate the buy and sell signals on the chart visually.
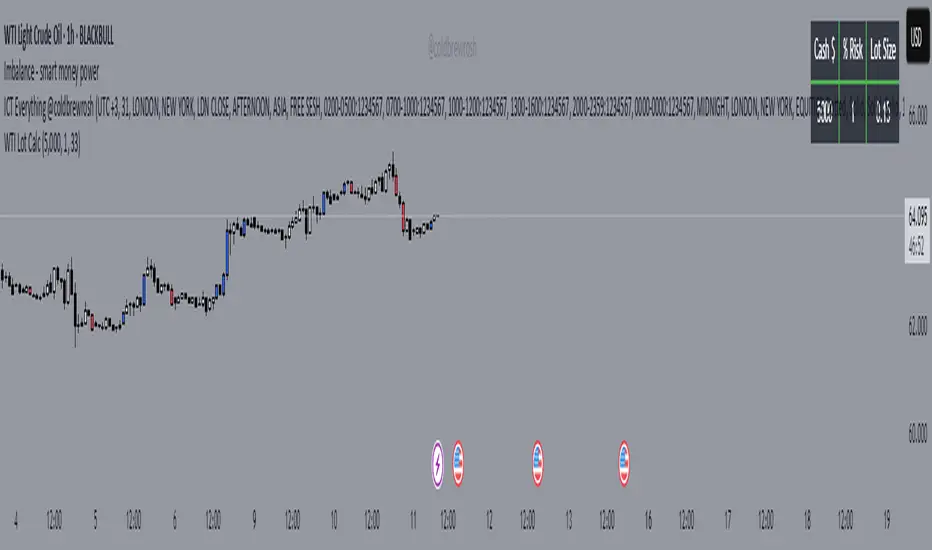
WTI Crude Oil Lot Size Calculator by AdrianFx94Indicator on Trading Chart: Once you add this script to your trading chart (specifically a WTI Crude Oil chart), it appears as an indicator. This means it runs alongside the price data and other technical analysis tools you might be using.
Input Your Trading Parameters:
Balance (USD): You need to enter your trading account balance in USD. This is the amount of money you have in your account.
Risk Percentage (%): This is where you define the percentage of your account balance that you're willing to risk in a single trade. For example, if your account balance is $5000 and you set the risk percentage to 1%, you're willing to risk $50 on a trade.
Stop Loss Pip Size (Pip): Here, you enter the size of your stop loss in pips. A pip is a small measure of change in a currency pair in the forex market. In the context of WTI Crude Oil trading, it represents a small change in the price.
Automated Lot Size Calculation: Based on the inputs you provide, the script automatically calculates the lot size you should use for your trade. The calculation takes into account the balance you're willing to risk, the percentage of risk, and the stop loss size. This helps in managing risk by suggesting the amount of WTI Crude Oil you should trade (in lots) that aligns with your risk tolerance.
Display Results in a Table: The script generates a table displayed on the top right corner of your chart. This table shows:
Your entered balance (in USD).
The risk percentage you've set.
The calculated lot size, which indicates how many lots of WTI Crude Oil you can trade based on your risk management parameters.
Real-Time Updates: As this script is part of an indicator on your chart, it updates in real time. This means if your account balance changes or if you decide to adjust your risk parameters, you can re-enter these values, and the script will update the lot size accordingly.
This tool is particularly useful for WTI Crude Oil traders who follow strict risk management rules. By automating the calculation of the lot size, it saves time and helps in making informed and disciplined trading decisions.
Crude Oil Top and Bottoms -by Trevor GeallDiscover the Crude Oil Tops and Bottoms Predictor Indicator: Your Key to Market Precision!
How to Use:
Ideal for the daily chart. Wait for the colored background to form.
Confirm signals by waiting for the first candle to close after the background disappears. That would be your sign to go long (if the line is crossing up) or short (if line is crossing dow).
Combine with other indicators for enhanced insights.
Unveil Market Secrets:
Identifies potential tops and bottoms in crude oil.
Empowers strategic trading decisions.
Advanced divergence detection and price channel analysis.
Note: While powerful, no indicator guarantees perfect predictions. Use it alongside comprehensive analysis and risk management. Elevate your crude oil trading now!
PS If I get enough positive feedback on my indicators ill release some of the better ones.

Intraday BUY/SELLBUY & SELL Scalp Signals for Crude Oil Future Contracts (Or it can be used with any scrip with good amount of Volume) based on Sma & RSI overbought/oversold alert (!) for possible reversal indication.
Take Buy position only if candle breaks the high of alert candle & for Sell positions, take position if candle breaks low of the alert candle.
Best to perform with 3 min timeframe on Crude Oil Futures

USDRUB Budget LineThis indicator plots an estimated level of USDRUB rate according to the oil price in rubles to balance the budget. The indicator works at arbitrary timescales. You can change the estimated oil price level in rubles (default value is 3150 rubles/bbl) and the ticker for the oil.

Market Health MonitorThe Market Health Monitor is a comprehensive tool designed to assess and visualize the economic health of a market, providing traders with vital insights into both current and future market conditions. This script integrates a range of critical economic indicators, including unemployment rates, inflation, Federal Reserve funds rates, consumer confidence, and housing market indices, to form a robust understanding of the overall economic landscape.
Drawing on a variety of data sources, the Market Health Monitor employs moving averages over periods of 3, 12, 36, and 120 months, corresponding to quarterly, annual, three-year, and ten-year economic cycles. This selection of timeframes is specifically chosen to capture the nuances of economic movements across different phases, providing a balanced view that is sensitive to both immediate changes and long-term trends.
Key Features:
Economic Indicators Integration: The script synthesizes crucial economic data such as unemployment rates, inflation levels, and housing market trends, offering a multi-dimensional perspective on market health.
Adaptability to Market Conditions: The inclusion of both short-term and long-term moving averages allows the Market Health Monitor to adapt to varying market conditions, making it a versatile tool for different trading strategies.
Oscillator Thresholds for Recession and Growth: The script sets specific thresholds that, when crossed, indicate either potential economic downturns (recessions) or periods of growth (expansions), allowing traders to anticipate and react to changing market conditions proactively.
Color-Coded Visualization: The Market Health Monitor employs a color-coding system for ease of interpretation:
-- A red background signals unhealthy economic conditions, cautioning traders about potential risks.
-- A bright red background indicates a confirmed recession, as declared by the NBER, signaling a critical time for traders to reassess risk exposure.
-- A green background suggests a healthy market with expected economic expansion, pointing towards growth-oriented opportunities.
Comprehensive Market Analysis: By combining various economic indicators, the script offers a holistic view of the market, enabling traders to make well-informed decisions based on a thorough understanding of the economic environment.
Key Criteria and Parameters:
Economic Indicators:
Labor Market: The unemployment rate is a critical indicator of economic health.
High or rising unemployment indicates reduced consumer spending and economic stress.
Inflation: Key for understanding monetary policy and consumer purchasing power.
Persistent high inflation can lead to economic instability, while deflation can signal weak
demand.
Monetary Policy: Reflected by the Federal Reserve funds rate.
Changes in the rate can influence economic activity, borrowing costs, and investor
sentiment.
Consumer Confidence: A predictor of consumer spending and economic activity.
Reflects the public’s perception of the economy
Housing Market: The housing market often leads the economy into recession and recovery.
Weakness here can signal broader economic problems.
Market Data:
Stock Market Indices: Reflect overall investor sentiment and economic
expectations. No gains in a stock market could potentially indicate that economy is
slowing down.
Credit Conditions: Indicated by the tightness of bank lending, signaling risk
perception.
Commodity Insight:
Crude Oil Prices: A proxy for global economic activity.
Indicator Timeframe:
A default monthly timeframe is chosen to align with the release frequency of many economic indicators, offering a balanced view between timely data and avoiding too much noise from short-term fluctuations. Surely, it can be chosen by trader / analyst.
The Market Health Monitor is more than just a trading tool—it's a comprehensive economic guide. It's designed for traders who value an in-depth understanding of the economic climate. By offering insights into both current conditions and future trends, it encourages traders to navigate the markets with confidence, whether through turbulent times or in periods of growth. This tool doesn't just help you follow the market—it helps you understand it.

Money Supply Index (MSI) by zdmreThe primary objective of the states monetary policy is to maintain price stability with sustainable maximum economic growth. In anticipation of higher inflation , the Central Banks raise short-term interest rate thereby to reduce money supply. Conversely, the Central Banks reduce short-term interest rate to inject additional money into the economy in apprehension of unleashing recessionary forces. The stock markets usually respond negatively to interest rate increases and positively to interest rate decreases. The linkages between money market and stock market a wealth effect due to a change in money supply disturbs the equilibrium in the portfolio of investors.
This index indicates the long-run and short-run dynamic effects of broad money supply (M2) on U.S. stock market (this symbol is optional (Bitcoin, Gold or Oil or other markets etc.)).
#DYOR

ANN MACD BRENT CRUDE OIL (UKOIL) This script trained with Brent Crude Oil data including 7 basic indicators and 12 Guppy Exponential Moving Averages .
Details :
Learning cycles: 1
Training error: 0.006591 ( Smaller than 0.01 ! )
AutoSave cycles: 100
Input columns: 19
Output columns: 1
Excluded columns: 0
Training example rows: 300
Validating example rows: 0
Querying example rows: 0
Excluded example rows: 0
Duplicated example rows: 0
Input nodes connected: 19
Hidden layer 1 nodes: 2
Hidden layer 2 nodes: 6
Hidden layer 3 nodes: 0
Output nodes: 1
Learning rate: 0.7000
Momentum: 0.8000
Target error: 0.0100
Note : Alerts added .
Special thanks to wroclai for his great effort.
Deep learning series will continue , stay tuned ! Regards.

Powerfull strategy MACD+RSI+STOCH ATR stop best on Crude OilMy strategy uses a combination of three indicators MACD Stochastic RSI .
The Idea is to buy when ( MACD > Signal and RSI > 50 and Stochastic > 50) occures at the same time the BUY STop we place on previous day HIGH
and sell (short) when the opposite condition occurs we place SELL STOP on previous day LOW
We exit on Take profit or Stop loss which is calculated by ATR (10) or on the opposite signal "Volatility breakout"
This strategy works well on stocks, commodities and cryptos especially during market breaking up after consolidation
The best results are on Daily charts , so its NOT a scalping strategy. But it can work also on 1H charts.
The strategy does not have any stops and profit targets, so we can take all the market can give us at the moment.
The exit point only when MACD goes under Signal
Its Preformance is significantly better with "buy stop on High.1 and sell stop on Low.1" idea and exit on "volatility price breakout"
So, use it, trade it.
If it will help you to imprive your trading results, please donate me
BTC: 12kd1F8buWisUBdq27BBwRkUvzW7Ey3og

USO - Adam Smith - Moving Average Cross StrategySimple Moving Average strategy for USO - United States Oil Fund . This strategy can be used on stocks and currencies but will need to tweak frequency on chart and backtest Max Draw Down to Net Profit ratios for maximum dollar gains.


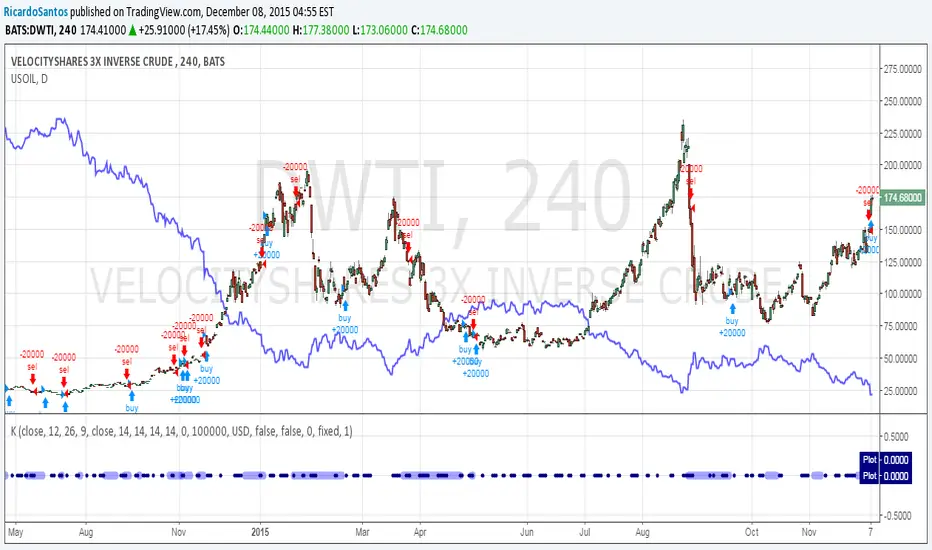
[RS]Khizon (DWTI) Strategy V0EXPERIMENTAL:
preliminary version
note: signals from the Daily timeframe may repaint.
Advanced Petroleum Market Model (APMM)Advanced Petroleum Market Model (APMM): A Multi-Factor Fundamental Analysis Framework for Oil Market Assessment
## 1. Introduction
The petroleum market represents one of the most complex and globally significant commodity markets, characterized by intricate supply-demand dynamics, geopolitical influences, and substantial price volatility (Hamilton, 2009). Traditional fundamental analysis approaches often struggle to synthesize the multitude of relevant indicators into actionable insights due to data heterogeneity, temporal misalignment, and subjective weighting schemes (Baumeister & Kilian, 2016).
The Advanced Petroleum Market Model addresses these limitations through a systematic, quantitative approach that integrates 16 verified fundamental indicators across five critical market dimensions. The model builds upon established financial engineering principles while incorporating petroleum-specific market dynamics and adaptive learning mechanisms.
## 2. Theoretical Framework
### 2.1 Market Efficiency and Information Integration
The model operates under the assumption of semi-strong market efficiency, where fundamental information is gradually incorporated into prices with varying degrees of lag (Fama, 1970). The petroleum market's unique characteristics, including storage costs, transportation constraints, and geopolitical risk premiums, create opportunities for fundamental analysis to provide predictive value (Kilian, 2009).
### 2.2 Multi-Factor Asset Pricing Theory
Drawing from Ross's (1976) Arbitrage Pricing Theory, the model treats petroleum prices as driven by multiple systematic risk factors. The five-factor decomposition (Supply, Inventory, Demand, Trade, Sentiment) represents economically meaningful sources of systematic risk in petroleum markets (Chen et al., 1986).
## 3. Methodology
### 3.1 Data Sources and Quality Framework
The model integrates 16 fundamental indicators sourced from verified TradingView economic data feeds:
Supply Indicators:
- US Oil Production (ECONOMICS:USCOP)
- US Oil Rigs Count (ECONOMICS:USCOR)
- API Crude Runs (ECONOMICS:USACR)
Inventory Indicators:
- US Crude Stock Changes (ECONOMICS:USCOSC)
- Cushing Stocks (ECONOMICS:USCCOS)
- API Crude Stocks (ECONOMICS:USCSC)
- API Gasoline Stocks (ECONOMICS:USGS)
- API Distillate Stocks (ECONOMICS:USDS)
Demand Indicators:
- Refinery Crude Runs (ECONOMICS:USRCR)
- Gasoline Production (ECONOMICS:USGPRO)
- Distillate Production (ECONOMICS:USDFP)
- Industrial Production Index (FRED:INDPRO)
Trade Indicators:
- US Crude Imports (ECONOMICS:USCOI)
- US Oil Exports (ECONOMICS:USOE)
- API Crude Imports (ECONOMICS:USCI)
- Dollar Index (TVC:DXY)
Sentiment Indicators:
- Oil Volatility Index (CBOE:OVX)
### 3.2 Data Quality Monitoring System
Following best practices in quantitative finance (Lopez de Prado, 2018), the model implements comprehensive data quality monitoring:
Data Quality Score = Σ(Individual Indicator Validity) / Total Indicators
Where validity is determined by:
- Non-null data availability
- Positive value validation
- Temporal consistency checks
### 3.3 Statistical Normalization Framework
#### 3.3.1 Z-Score Normalization
The model employs robust Z-score normalization as established by Sharpe (1994) for cross-indicator comparability:
Z_i,t = (X_i,t - μ_i) / σ_i
Where:
- X_i,t = Raw value of indicator i at time t
- μ_i = Sample mean of indicator i
- σ_i = Sample standard deviation of indicator i
Z-scores are capped at ±3 to mitigate outlier influence (Tukey, 1977).
#### 3.3.2 Percentile Rank Transformation
For intuitive interpretation, Z-scores are converted to percentile ranks following the methodology of Conover (1999):
Percentile_Rank = (Number of values < current_value) / Total_observations × 100
### 3.4 Exponential Smoothing Framework
Signal smoothing employs exponential weighted moving averages (Brown, 1963) with adaptive alpha parameter:
S_t = α × X_t + (1-α) × S_{t-1}
Where α = 2/(N+1) and N represents the smoothing period.
### 3.5 Dynamic Threshold Optimization
The model implements adaptive thresholds using Bollinger Band methodology (Bollinger, 1992):
Dynamic_Threshold = μ ± (k × σ)
Where k is the threshold multiplier adjusted for market volatility regime.
### 3.6 Composite Score Calculation
The fundamental score integrates component scores through weighted averaging:
Fundamental_Score = Σ(w_i × Score_i × Quality_i)
Where:
- w_i = Normalized component weight
- Score_i = Component fundamental score
- Quality_i = Data quality adjustment factor
## 4. Implementation Architecture
### 4.1 Adaptive Parameter Framework
The model incorporates regime-specific adjustments based on market volatility:
Volatility_Regime = σ_price / μ_price × 100
High volatility regimes (>25%) trigger enhanced weighting for inventory and sentiment components, reflecting increased market sensitivity to supply disruptions and psychological factors.
### 4.2 Data Synchronization Protocol
Given varying publication frequencies (daily, weekly, monthly), the model employs forward-fill synchronization to maintain temporal alignment across all indicators.
### 4.3 Quality-Adjusted Scoring
Component scores are adjusted for data quality to prevent degraded inputs from contaminating the composite signal:
Adjusted_Score = Raw_Score × Quality_Factor + 50 × (1 - Quality_Factor)
This formulation ensures that poor-quality data reverts toward neutral (50) rather than contributing noise.
## 5. Usage Guidelines and Best Practices
### 5.1 Configuration Recommendations
For Short-term Analysis (1-4 weeks):
- Lookback Period: 26 weeks
- Smoothing Length: 3-5 periods
- Confidence Period: 13 weeks
- Increase inventory and sentiment weights
For Medium-term Analysis (1-3 months):
- Lookback Period: 52 weeks
- Smoothing Length: 5-8 periods
- Confidence Period: 26 weeks
- Balanced component weights
For Long-term Analysis (3+ months):
- Lookback Period: 104 weeks
- Smoothing Length: 8-12 periods
- Confidence Period: 52 weeks
- Increase supply and demand weights
### 5.2 Signal Interpretation Framework
Bullish Signals (Score > 70):
- Fundamental conditions favor price appreciation
- Consider long positions or reduced short exposure
- Monitor for trend confirmation across multiple timeframes
Bearish Signals (Score < 30):
- Fundamental conditions suggest price weakness
- Consider short positions or reduced long exposure
- Evaluate downside protection strategies
Neutral Range (30-70):
- Mixed fundamental environment
- Favor range-bound or volatility strategies
- Wait for clearer directional signals
### 5.3 Risk Management Considerations
1. Data Quality Monitoring: Continuously monitor the data quality dashboard. Scores below 75% warrant increased caution.
2. Regime Awareness: Adjust position sizing based on volatility regime indicators. High volatility periods require reduced exposure.
3. Correlation Analysis: Monitor correlation with crude oil prices to validate model effectiveness.
4. Fundamental-Technical Divergence: Pay attention when fundamental signals diverge from technical indicators, as this may signal regime changes.
### 5.4 Alert System Optimization
Configure alerts conservatively to avoid false signals:
- Set alert threshold at 75+ for high-confidence signals
- Enable data quality warnings to maintain system integrity
- Use trend reversal alerts for early regime change detection
## 6. Model Validation and Performance Metrics
### 6.1 Statistical Validation
The model's statistical robustness is ensured through:
- Out-of-sample testing protocols
- Rolling window validation
- Bootstrap confidence intervals
- Regime-specific performance analysis
### 6.2 Economic Validation
Fundamental accuracy is validated against:
- Energy Information Administration (EIA) official reports
- International Energy Agency (IEA) market assessments
- Commercial inventory data verification
## 7. Limitations and Considerations
### 7.1 Model Limitations
1. Data Dependency: Model performance is contingent on data availability and quality from external sources.
2. US Market Focus: Primary data sources are US-centric, potentially limiting global applicability.
3. Lag Effects: Some fundamental indicators exhibit publication lags that may delay signal generation.
4. Regime Shifts: Structural market changes may require model recalibration.
### 7.2 Market Environment Considerations
The model is optimized for normal market conditions. During extreme events (e.g., geopolitical crises, pandemics), additional qualitative factors should be considered alongside quantitative signals.
## References
Baumeister, C., & Kilian, L. (2016). Forty years of oil price fluctuations: Why the price of oil may still surprise us. *Journal of Economic Perspectives*, 30(1), 139-160.
Bollinger, J. (1992). *Bollinger on Bollinger Bands*. McGraw-Hill.
Brown, R. G. (1963). *Smoothing, Forecasting and Prediction of Discrete Time Series*. Prentice-Hall.
Chen, N. F., Roll, R., & Ross, S. A. (1986). Economic forces and the stock market. *Journal of Business*, 59(3), 383-403.
Conover, W. J. (1999). *Practical Nonparametric Statistics* (3rd ed.). John Wiley & Sons.
Fama, E. F. (1970). Efficient capital markets: A review of theory and empirical work. *Journal of Finance*, 25(2), 383-417.
Hamilton, J. D. (2009). Understanding crude oil prices. *Energy Journal*, 30(2), 179-206.
Kilian, L. (2009). Not all oil price shocks are alike: Disentangling demand and supply shocks in the crude oil market. *American Economic Review*, 99(3), 1053-1069.
Lopez de Prado, M. (2018). *Advances in Financial Machine Learning*. John Wiley & Sons.
Ross, S. A. (1976). The arbitrage theory of capital asset pricing. *Journal of Economic Theory*, 13(3), 341-360.
Sharpe, W. F. (1994). The Sharpe ratio. *Journal of Portfolio Management*, 21(1), 49-58.
Tukey, J. W. (1977). *Exploratory Data Analysis*. Addison-Wesley.

Volatility IndicatorThe volatility indicator presented here is based on multiple volatility indices that reflect the market’s expectation of future price fluctuations across different asset classes, including equities, commodities, and currencies. These indices serve as valuable tools for traders and analysts seeking to anticipate potential market movements, as volatility is a key factor influencing asset prices and market dynamics (Bollerslev, 1986).
Volatility, defined as the magnitude of price changes, is often regarded as a measure of market uncertainty or risk. Financial markets exhibit periods of heightened volatility that may precede significant price movements, whether upward or downward (Christoffersen, 1998). The indicator presented in this script tracks several key volatility indices, including the VIX (S&P 500), GVZ (Gold), OVX (Crude Oil), and others, to help identify periods of increased uncertainty that could signal potential market turning points.
Volatility Indices and Their Relevance
Volatility indices like the VIX are considered “fear gauges” as they reflect the market’s expectation of future volatility derived from the pricing of options. A rising VIX typically signals increasing investor uncertainty and fear, which often precedes market corrections or significant price movements. In contrast, a falling VIX may suggest complacency or confidence in continued market stability (Whaley, 2000).
The other volatility indices incorporated in the indicator script, such as the GVZ (Gold Volatility Index) and OVX (Oil Volatility Index), capture the market’s perception of volatility in specific asset classes. For instance, GVZ reflects market expectations for volatility in the gold market, which can be influenced by factors such as geopolitical instability, inflation expectations, and changes in investor sentiment toward safe-haven assets. Similarly, OVX tracks the implied volatility of crude oil options, which is a crucial factor for predicting price movements in energy markets, often driven by geopolitical events, OPEC decisions, and supply-demand imbalances (Pindyck, 2004).
Using the Indicator to Identify Market Movements
The volatility indicator alerts traders when specific volatility indices exceed a defined threshold, which may signal a change in market sentiment or an upcoming price movement. These thresholds, set by the user, are typically based on historical levels of volatility that have preceded significant market changes. When a volatility index exceeds this threshold, it suggests that market participants expect greater uncertainty, which often correlates with increased price volatility and the possibility of a trend reversal.
For example, if the VIX exceeds a pre-determined level (e.g., 30), it could indicate that investors are anticipating heightened volatility in the equity markets, potentially signaling a downturn or correction in the broader market. On the other hand, if the OVX rises significantly, it could point to an upcoming sharp movement in crude oil prices, driven by changing market expectations about supply, demand, or geopolitical risks (Geman, 2005).
Practical Application
To effectively use this volatility indicator in market analysis, traders should monitor the alert signals generated when any of the volatility indices surpass their thresholds. This can be used to identify periods of market uncertainty or potential market turning points across different sectors, including equities, commodities, and currencies. The indicator can help traders prepare for increased price movements, adjust their risk management strategies, or even take advantage of anticipated price swings through options trading or volatility-based strategies (Black & Scholes, 1973).
Traders may also use this indicator in conjunction with other technical analysis tools to validate the potential for significant market movements. For example, if the VIX exceeds its threshold and the market is simultaneously approaching a critical technical support or resistance level, the trader might consider entering a position that capitalizes on the anticipated price breakout or reversal.
Conclusion
This volatility indicator is a robust tool for identifying market conditions that are conducive to significant price movements. By tracking the behavior of key volatility indices, traders can gain insights into the market’s expectations of future price fluctuations, enabling them to make more informed decisions regarding market entries and exits. Understanding and monitoring volatility can be particularly valuable during times of heightened uncertainty, as changes in volatility often precede substantial shifts in market direction (French et al., 1987).
References
• Bollerslev, T. (1986). Generalized Autoregressive Conditional Heteroskedasticity. Journal of Econometrics, 31(3), 307-327.
• Christoffersen, P. F. (1998). Evaluating Interval Forecasts. International Economic Review, 39(4), 841-862.
• Whaley, R. E. (2000). Derivatives on Market Volatility. Journal of Derivatives, 7(4), 71-82.
• Pindyck, R. S. (2004). Volatility and the Pricing of Commodity Derivatives. Journal of Futures Markets, 24(11), 973-987.
• Geman, H. (2005). Commodities and Commodity Derivatives: Modeling and Pricing for Agriculturals, Metals and Energy. John Wiley & Sons.
• Black, F., & Scholes, M. (1973). The Pricing of Options and Corporate Liabilities. Journal of Political Economy, 81(3), 637-654.
• French, K. R., Schwert, G. W., & Stambaugh, R. F. (1987). Expected Stock Returns and Volatility. Journal of Financial Economics, 19(1), 3-29.
