Alert GetTrendStrategy BTCUSDAlerta para la estrategia "GetTrendStrategy 370 30 min" optimizada para Bitcoin
Puedes programar alarmas para que envié mensajes al móvil o al correo electrónico. Para ello observa la siguiente imagen:
mejorestraders.ml
"alert"に関するスクリプトを検索
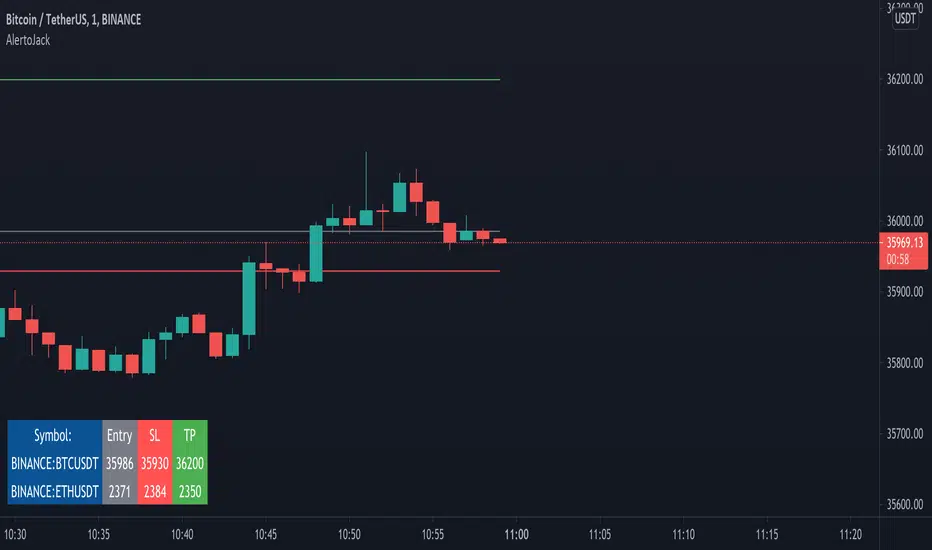
AlertoJack AlertoJack
v0.1a
coded by Bogdan Vaida
This indicator was created to provide easily defined alerts on multiple symbols.
It's still POC code.
Usage:
- Add it on any coin,
- The chart timeframe will be the timeframe for the alerts;
- Configure it with the symbols you want to be alerted on,
- Add the prices to be alerted for,
- Use Add Alert -> condition AlertoJack -> "Any alert() function call"
- Check the Alerts log.
Notes:
- Alert happens when candle crosses the price.
- Because of how Trading View functions, if you modify the indicator settings
you'll need to add the alerts again (because an alert uses the code version
it was created from).
- The alert runs once per current bar's timeframe (e.g. once per minute
if you're on the 1m).
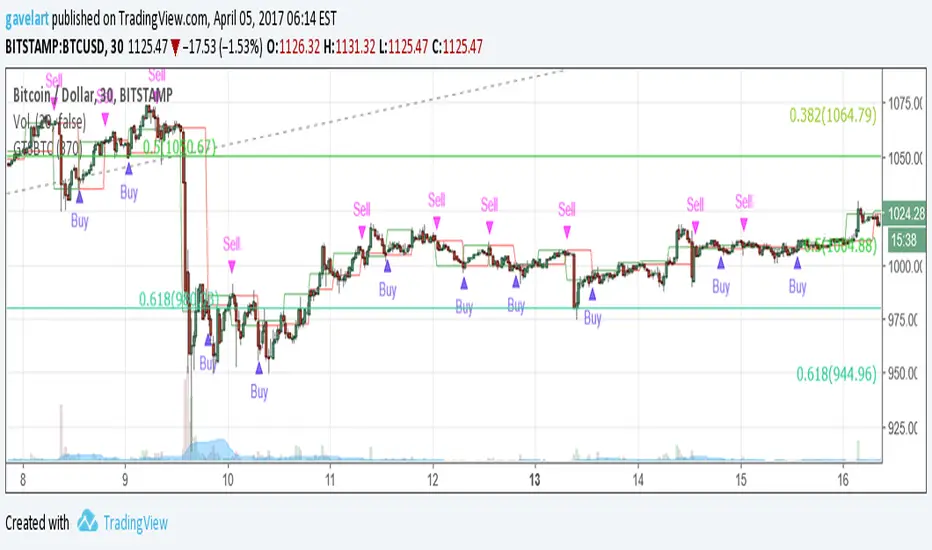
alert!!!!alerts work over values of plots on the chart. could not find a way to add an alert when a strategy is triggered.
so, i created an alert chart that uses the same conditions as the strategy(i published the example strat in my previous script). an alert chart should be mostly zero, but when the strat fires up, the alert = 1, and when the strat fires down, alert = -1. this way it's easy to check the chart for alerts.
but, if i'm looking at the cahrt and see the strat's arrows, what's the point? well, the point is that we can add alerts to this chart, to send emails, popup on screen, start screaming, whatever. so that now i don't actually need the chart in screen all the time :)
since this alert chart behaves so nice, values = to add an alert is just setting it's value >0.5, or value > -0.5 :)
note: aloert is not actually in the script, it has to be added manually using the button. if Pine has a way to add alerts programatically, i couldn't find it
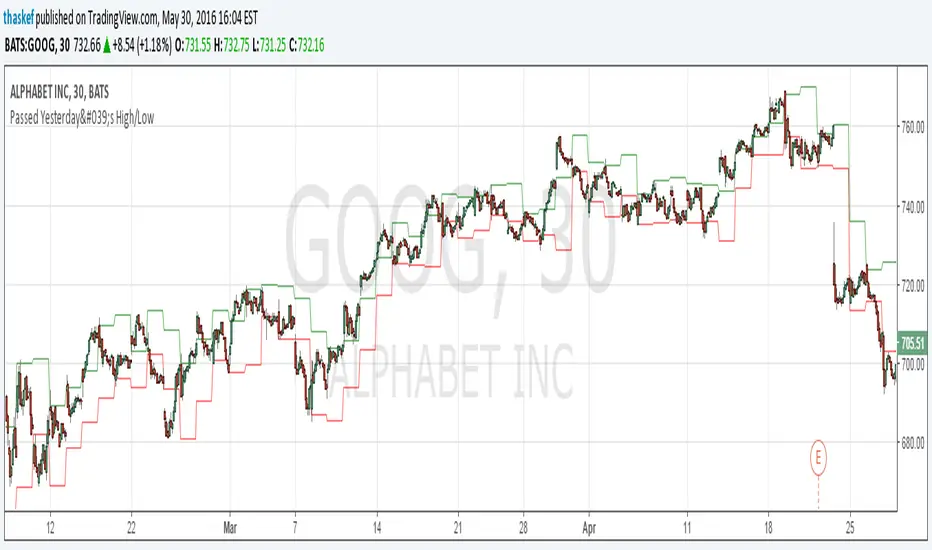
ALERT: Passed Yesterday's High/LowThis is just a simple script to show if the current price passed yesterday's high or low price. It will create an alert if so (which can be set up to notify you via email or text).
blog.tradingview.com
Alert on Candle CloseAlert on Candle Close is a simple indicator allowing you to set alerts when a candlestick closes.
Instructions for use
From the chart window, click on "Indicators" and search for "Alert on Candle Close".
Click on "Alert on Candle Close" to add the indicator to your chart. Click on the star icon to add it to your favourites to easily access later.
Set your chart timeframe to the timeframe you wish to alert on. For example, to create an alert when a 4h candlestick closes, set your chart to the "4h" timeframe.
Hover over the "Alert on Candle Close" indicator which has been added to your chart and click the ellipsis "..." icon, then click "Add alert on Alert on Candle Close" or use the keyboard shortcut "Alt+A" from the chart.
In the alert pop-up window, make sure "Condition" is set to "Alert on Candle Close" and "Trigger" is set to "Once Per Bar".
Optionally, you can set a custom expiry for the alert, give the alert a name and customise the alert message. You can configure notification settings from the "Notifications" tab.
Click "Create" and your alert is set up!
Each alert is tied to the timeframe and chart it was created on, so you can change the timeframe or asset and create more alerts by repeating the above process.
Note : this indicator is only designed to work with time-based chart types, such as Bars, Candles or Heikin Ashi. It will not work for non-time charts such as Renko.
FAQs
Why do my alerts sometimes not fire as soon as the candle closes?
This is a limitation with Pine Script's execution model. Indicators are calculated whenever a price or volume change occurs i.e. when a new trade happens. For illiquid or slow moving markets, there may be some time between when a candle closes and the next trade, leading to a delay in the alert triggering. The alert will trigger on the next tick of data on the chart.
Why can't I create more alerts?
TradingView has a limit on the number of active technical alerts you can have based on your membership tier. To configure more alerts, consider upgrading your TradingView plan to a higher tier. See a comparison of TradingView plans at www.tradingview.com
My alert only fired once, how can I get it to keep working?
When configuring the alert in the alert pop-up window, make sure you set "Trigger" to "Once Per Bar" and "Expiration" to "Open-ended alert".

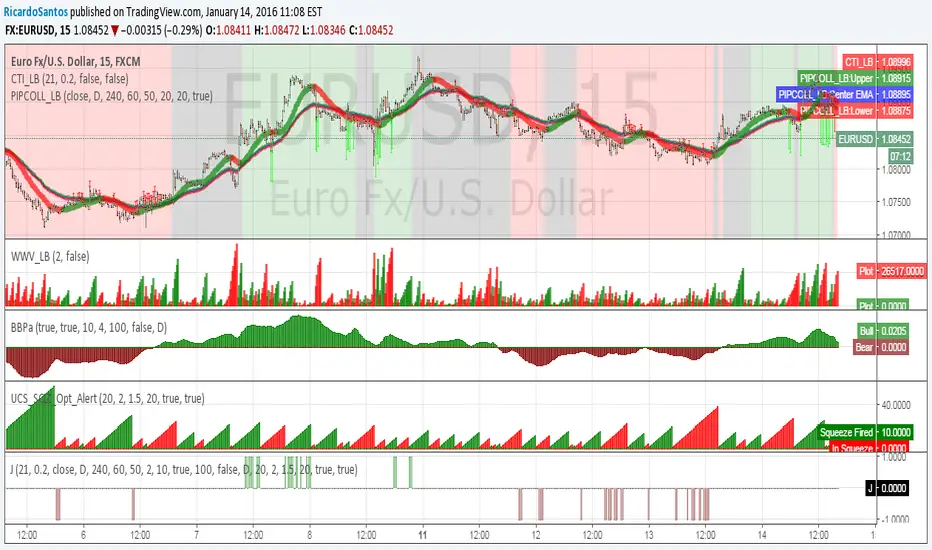
[RS]JDSarano Alert V0Request for JDSarano:
alert signal on indicator accordance:
Coral trend Indicator from LazyBear
pip Collector from LazyBear ( I use this only for the red, gray, green background
Weis Wave Volume (LazyBear) default settings. (2)
Linear Regression Bull and Bear power acummulation V0
UCS_SQZ_Opt_Alert
Alert Intervals and Delays Framework [BigBitsIO]Simply explained, this script, when modified to each specific use case, can allow you to specify that alert conditions are only checked every X seconds (AKA Intervals - as fast as every single second) and that alerts can not occur quicker than the user-specified delay (in seconds)
Explained:
- This will work on any resolution, but for the best results/fastest alerts a premium plan with 1s resolution will work best.
- Be mindful of which alert option you choose when setting up corresponding alerts. On 1s resolution with alerts once per bar you can get alerts up to every second.
- The scan for alerts every X seconds will be when the script can scan, by default every 5th second. If you want it to scan on any and all updates, set it to 1 for 1 second
- The delay between alerts will just require than that many seconds have passed since the last alert was fired (whether it was an actual alert in TradingView or just as recognized by this script)
- To have a custom alert condition met, do your normal indicator logic and check your conditions during the scanning period after the delay has been met, as marked by comments in the code
FAQ
- Why is this script useful?
- Many people do not want to constantly monitor for alerts, and may only want alerts to trigger at certain times, or after certain periods of time
- What is an example?
- You want a 1min resolution RSI alert, but you don't want to see it every minute, or only once.
- By setting your alert to once per bar, or once per minute on a 1min or less resolution chart you can get alerts only every 2min 30sec for example when setting your delay to 150 (seconds)
Warning: Since the scan time and alert times on larger resolutions can not be accessed from previous candles when first added to the chart it should be pretty important that you operate on a chart with a smaller resolution than your delay.

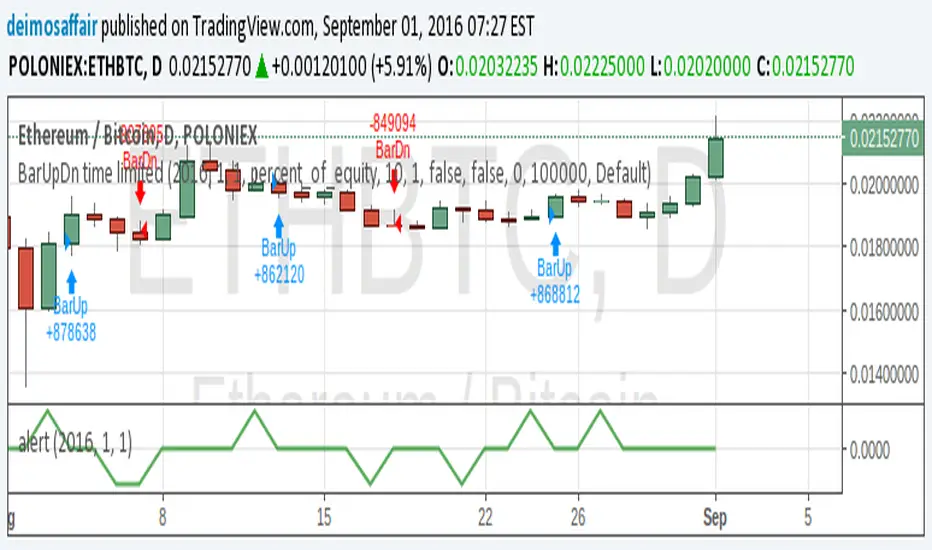
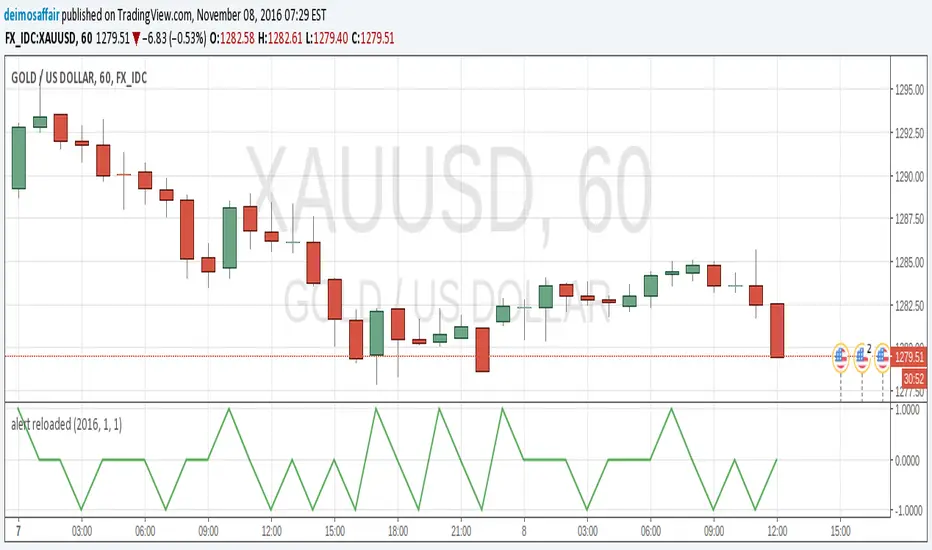
alert reloadedtype: alert creation
required time: 5 minutes
level: easy
Getting alerts for indicators and strats is good to easy the eyes of the charts for a while :)
After my first script itroducing how to do alerts here there is an easier, more clear way to create an alert. It's still good to do it the "old way" to understand/debug an alert, but after that you'll want this extra tool for sure.
I assume you read my previous post, or understand how alerts are set up on a chart.
So, there is this function called alercondition() that does (almost)the whole job for us :)
The function does NOT create the alert automatically, what is does is introducing a new option in the alerts popup. While in the v1.0 of my script the alert was triggered checking for the plot value against 0.9 or -0.9, in this example the alertcondition() function just fires the alert by itself.
Get the script for yourself, in favourites, copy/paste, whatever. Add it to any chart. Then, open the popup to create an alert(the little clock at the top). There will be a drop menu with the options and "Alert reloaded". This is the title provided in the study() parameter. Choose this one.
Now, the second drop menu has the "going UP" and "going DOWN" options. These are the titles from the alertcondition() function. Select one. Make all the aditional choices for the alert you want. Save it.
And that's it, the alert will fire when the conditions become true. You can still keep the plot() for graphical reference, but it's now an extra, removing it will not affect the alert, so more space in the chart. Yey!! :)
ALERTS :: ALLinDivergence v10.0
Everything you see in this indicator has a designated purpose to ease your trading with predefined ALERTS of high quality. It pulls data from 7 different TimeFrames and it can not be more simpler visual representation of its calculations when applied on chart.
When applied on chart, it will colour your chart BARS/CANDLE to the colour PURPLE as that colour is well known colour of Relative Strength Indicator line that indicates overbought or oversold area. RSI is used as a main source of information/data for this indicator.
Second reason of colour PURPLE is that it cancels all the noise that default green/red bars have.
This indicator also has GREEN/RED colouring of BARS/CANDLES and they appear when something crucial is happening in the market. That something needs to be checked ASAP. This green/red coloured bars are just there to remind you that something can happen and it does not mean that market would actually change direction it is just a "friendly warning" you can use when creating alerts.
The best thing about this indicator is those full coloured GREEN/RED LITTLE DOTS.
They represent DIVERGENCES emerging and possible actual change of market direction. To be sure, you need to analyse your chart more in depth any way you prefer to get your needed confirmations. To do that, use your strategy that you have been using when trading up until now or even better, use indicator that I made and is called RSI :: ALLinDivergence v 10.0 -> It is a visual representation of ALERT :: ALLinDivergence v 10.0 indicator signals. Very easy to analyse in minutes.
HOW TO USE IT?
Rule 1.
TIMEFRAMES
Choose the best TimeFrame for the job. I use: 1min, 2min, 3min, 5min, 8min, 13min, 21min, 34min or 56min (golden ratio). You can also pick a different TF but only to up to 1h TF chart as it does not work well with TF over 1h. Smaller TF is used for SCALPING of DAY TRADING higher TF is used for SWING TRADING. You get the picture?
Rule 2
To ENTER A POSITION
Find the best TF that suits your needs. That depends on your trading style (day trading, scalping, swing trading, ect.). To know which TF is the best for you you also need to look for a good quality signals when looking the chart in the past (visual BACKTESTING). Signals from past should yield positive results.
When you wish to trade certain pair, find the best TF and from there you need to "Create Alert". Choose this indicator when creating alerts and from dropdown menu pick "GREEN" for Divergence BUY/LONG signals or "RED" Divergence SELL/SHORT signals. Then choose "Greater Than" and change the value to "1" (that will set off the alarm), choose how you want to be notified and then name the ALERT so you will know how it is made.
Do not forget to do your work and analyse your market situation best way you can and get needed confirmations before doing anything about it.
Rule 3
TO EXIT A POSITION
From the same TF as Divergence alerts are made from (Rule 2), you can make alerts that are just a "friendly warning" that something is happening on the market you are in an opened position. Instead of picking GREEN or RED from dropdown menu when creating alerts, you need to pick GREEN BARS or RED BARS and the rest is the same as with rule 2.
Rule 4
CONFIRMATIONS
Help yourself with any type of analysis you need to get the confirmations you need to enter or exit the position. Use the style you always have up until now. Or find a better one that is quicker and with good yield.
There is a great option that can change your way of thinking about trading and it is called RSI :: ALLinDivergence v 10.0 indicator that is used as a visual representation of ALERTS indicator. It takes literally minutes to do whole analysis - remember it uses data from 7 different TimeFrames and it is really good! Just find LowerHighs of RSI curve for SHORT or HigherLows for LONG.

Alert Before Bar Closei.imgur.com
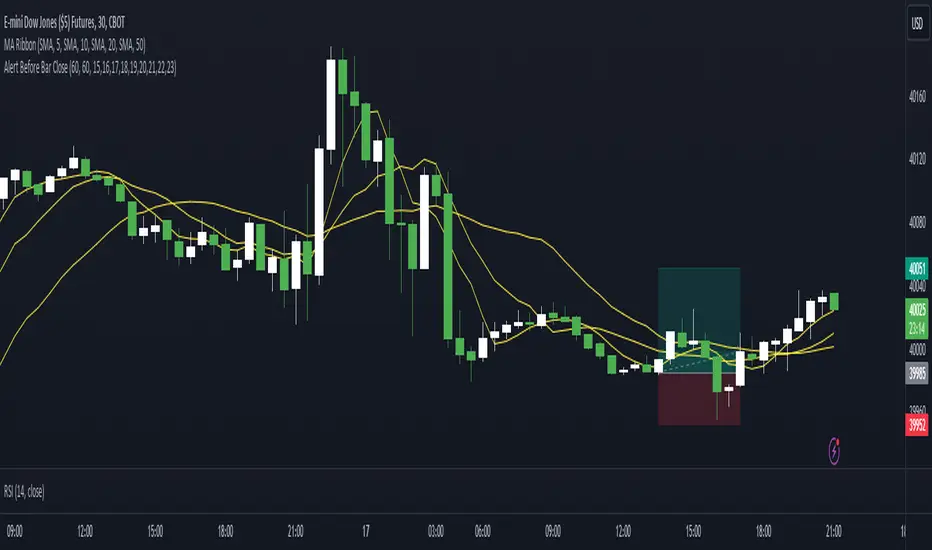
Alert Before Bar Close
==========================
Example Figure
Originality and usefulness
This indicator/alert mechanism is unique in two ways. First, it provides alerts before the close of a candlestick, allowing time-based traders to prepare early to determine if the market is about to form a setup. Second, it introduces an observation time mechanism, enabling time-based traders to observe when the market is active, thereby avoiding too many false signals during electronic trading or when trading is light.
Detail
Regarding the settings (Arrow 1). The first input is to select the candlestick period you want to observe. The second is to notify a few seconds in advance. The third input sets the observation time. For example, if you set "1,2,3,4,5," the alert mechanism will only be activated during the period from 01:00:00 to 05:59:59, consistent with the time zone you set in TradingView. Additionally, I have set it so that the alert will only trigger once per candlestick, so don't worry about repeated alerts.
The alert setup is very simple, too. Follow the steps (Arrow 2, 3) to complete the setup. I have tested several periods and successfully received alerts on both mobile and computer. If anyone encounters any issues, feel free to let me know.
Alert example: multiple checked symbols and checked conditionsHere is the example how to check multiple conditions for multiple instruments using only ONE alert.
How to use :
Add into the code needed conditions and instruments.
Apply the indicator on the chart, call Create Alert Dialog and just click "Create".
Enjoy.

[ALERTS] CMYK-RMI-TRIPLE IIThis is the same previous script but without the Deribit index (for BITMEX users for example) that can give problems due to no connection with any of the 6 exchanges. Now use 'close' as source.
BTCUSD, XBTUSD, ...
Best time frame: 5 minutes
Alerts: 'once per bar'

[ALERTS] ADX and DIThe average directional index (ADX) is a technical analysis metric. Analysts use it to determine the relative strength of a trend, with the direction of the trend either upwards or downwards.
The Average Directional Index (ADX) along with the Negative Directional Indicator (-DI) and the Positive Directional Indicator (+DI) are momentum strength indicators that evolved for use in stock trading. Commodities trader J. Welles Wilder pioneered their use. Technical traders who use charting techniques want to know when first spotting a shifting trend how strong that trend is and how likely it is to sustain itself over time. The ADX helps investors determine trend strength as they plan their investment strategies.
Confirmation on a chart and other momentum indicators help investors spot trend reversals. But some trends are more potent than others and investors want to better understand the strength of a trend. The ADX identifies a strong positive trend when the ADX is over 25 and a weak trend when the ADX is below 20. Investors can determine directional movement by analyzing the difference between two consecutive low prices and their correlated highs. The movement is +DM when the current high price, less the previous high price, is greater than the previous low price less the current low. The opposite applies in determining the negative or –DI.
When analyzing charts, stock price is the single most important variable to follow. ADX and other indicators are supplementary to price movements in providing additional directional information and support. For example, some of the best trends come about from price range consolidation. It is those tugs of war between buying and selling volumes that lead to breakouts and other trading opportunities.
The Inventor of the Average Directional Index
J. Welles Wilder, Jr. is a former American engineer and real estate developer who went on to revolutionize trading analysis by applying mathematical systems to the world of investing. In addition to developing the ADX, Wilder is also responsible for several other commonly used technical analysis tools including the Average True Range (ATR), the Relative Strength Index (RSI) and the Parabolic SAR.
www.investopedia.com
This script has alerts and includes the filter for markets with no trend defined.
Green Alert --> Long
Red Alert --> Short
Yellow Area --> Weak trend. ADX below threshold
Green candles --> Bullish Market
Red Candles --> Bearish Market
Orange candles --> No defined trend
Enjoy!

[ALERTS] CMYK-RMI-SMA
▼ This is the study version of the script, For usage with Autoview
◊ Introduction
This script makes use of three RMI's and SMA's, that indicate Overbought/Oversold on different Periods that correspond with Frequency’s that move the market.
◊ Origin
This is an update on █▓▒░ CMYK ♦ RMI ♦ TRIPLE ░▒▓█
◊ Usage
This script is intended for Automated Trading on the 1-5 minute chart.
◊ Features Summary
Two Part Indicator
Strategy Type Selection
Three RMI's SMA's
Trend adjustment
Pump/Dump Entry Delay
Pyramiding
Ignore first entries
Take Profit
Interval between Entries
Multiring Fix
Alert signal Seperation
◊ Community
Wanna try this script out ? need help resolving a problem ?
CMYK :: discord.gg
AUTOVIEW :: discordapp.com
TRADINGVIEW UNOFFICIAL :: discord.gg
◊ Setting up Autoview Alerts
Use the study version of this script, To set up The Alerts Autoview Picks up on.
Goto the CMYK Discord for support and Settings.
◊ Backtesting
Use the strategy version of this script for backtesting.
◊ Contact
Wanna try this script out ? need help resolving a problem ?
CMYK :: discord.gg
HAPPY TRADES!!!

Alert BatchesThis script lets you separate alerts into batches, and trigger each batch in either sequential order or (pseudo)random order. You can also specify the number of batches being used.
This is helpful when you have alerts to be triggered on every candle, but the number of alerts causes API errors if they are all executed at once.

[Alerts] - Moving Average Cross and/or Bbands botThis is the alert script for :
We've included the basic alert syntax for Autoview automation. You can learn more about the syntax here: autoview.with.pink and you can watch this video here: www.youtube.com
These settings are set, by default, to the lowest contracts allowed by Bitmex (at the time of this posting) to avoid a spam account.
You can learn more about Autoview here:
autoview.with.pink
Get your invite and join us in slack here:
slack.with.pink

Alert N seconds before candle closeThe indicator alerts about the closing of the candle in N seconds.
Instruction:
1. Add an indicator
2. Specify the time in the indicator settings
3. Alt+A, Condition - choose indicator

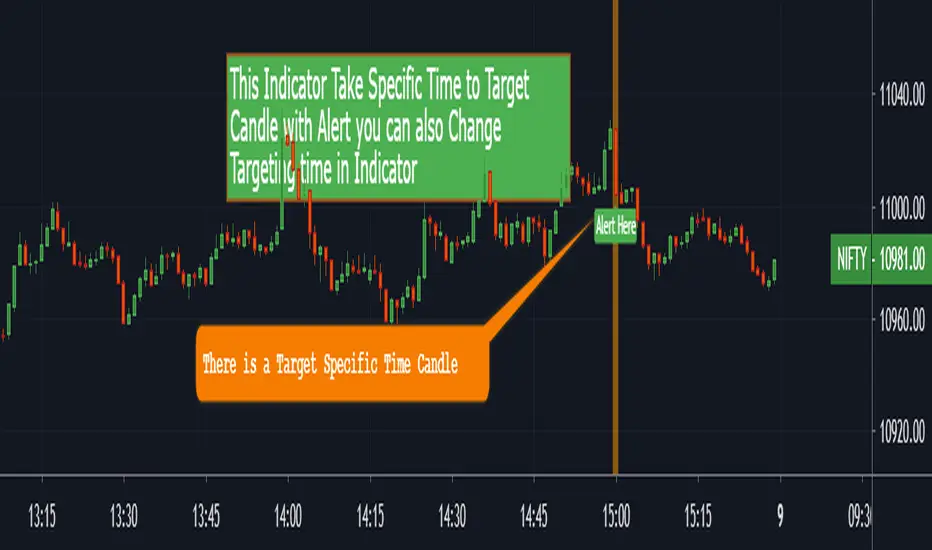
Alert with Specific Candle [MV}This Indicator Takes Specific Time to Target Candle With Alert
You Can Also Change Targeting Time in Indicator
You Can Also Add Alert
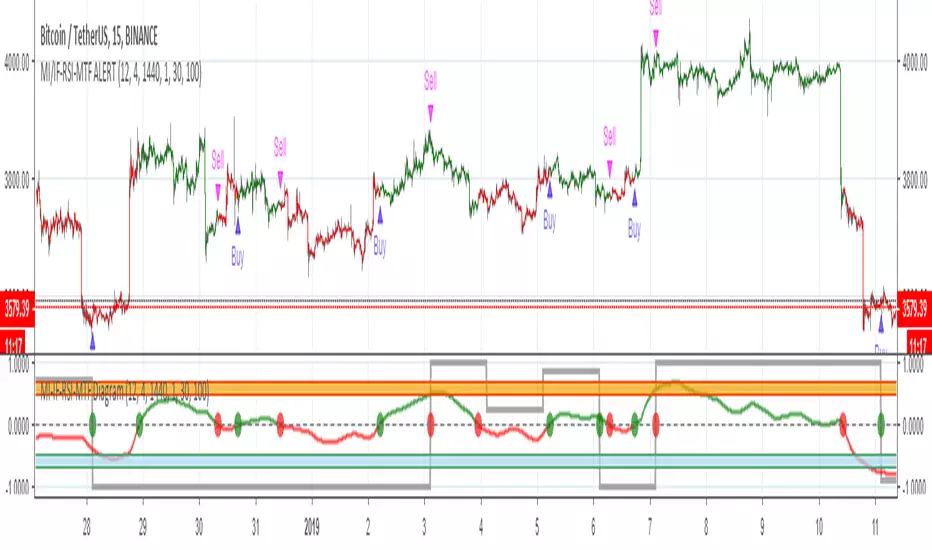
MOMENTUM INDICATOR / INVERS FISHER / RSI / MTF / ALERT// Alerts based on Momentum indicator and Inverse Fisher transform with Multi Time Frame function on Relative Strength Index (RSI)
// Greatest effect on 15M+ time frame
// Created and based on Binance chart
// Working with comission
// No repaints
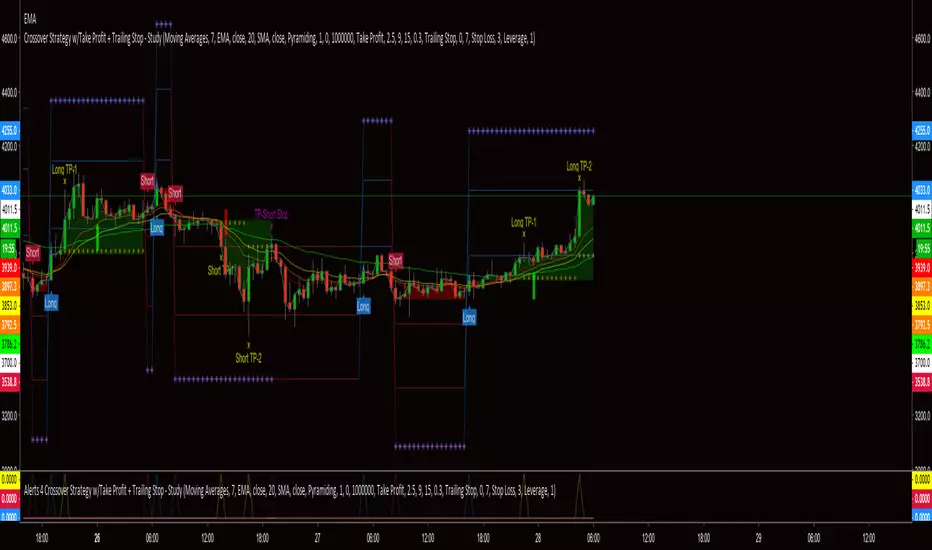
Alerts 4 Crossover Strategy w/Take Profit + Trailing StopThis is the companion script for the "Crossover Strategy w/Take Profit + Trailing Stop - Study". It's sole purpose is to provide the alert triggers for use with AutoView!!!
***** YOU MUST BE SURE THAT ALL SETTINGS MATCH THE CORRESPONDING CROSSOVER STRATEGY *****