USFuturesInvestments Moving Averages - Exponencia and SimpleThis indicator contains the main exponential moving averages (9, 21 and 80) and the simple moving averages (200, 305 and 610), which I use in my operational.
It was developed by my friend Giovani, who is a 10 note guy!
I hope he can help you on your journey to becoming a Professional Trader.
You can modify it the way you prefer, it is very simple.
Neste indicador estão reunidas as principais médias móveis exponenciais (9, 21 e 80) e as médias móveis simples (200, 305 e 610), que uso em meu operacional.
Ele foi desenvolvido por meu amigo Giovani, que é um cara nota 10!
Espero que ele possa ajudar a você na jornada para se tornar um Trader Profissional.
Você pode modifica-la do jeito que preferir, é muito simples.
"averages"に関するスクリプトを検索

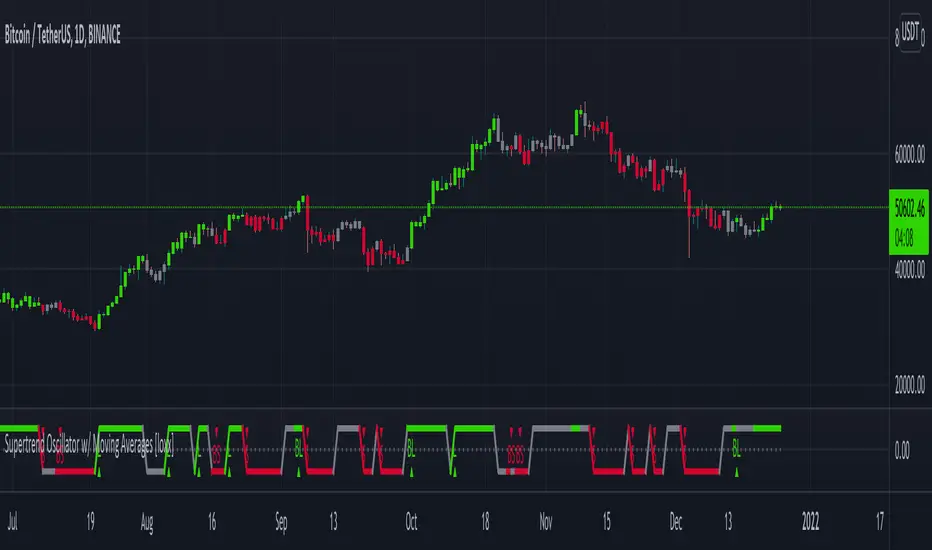
Supertrend Oscillator w/ Moving Averages [loxx]Supertrend Oscillator w/ Moving Averages
Supertrend Oscillator with configurable inputs for either standard or moving average inputs
Features
-Includes the folowing moving averages
ALMA
DEMA
DONCHIAN
EDSMA
EMA
FRAMA
HMA
INSTANT
JMA
KAMA
Kijun v2
LSMA
MAMA
McGinley
MF
RMA
SMA
SSMA
T3
TEMA
TRIMA
VWMA
WM
ZLEMA
-Baseline filtering internal to indicator
-Has logic to account for post signal baseline crossover rules
-Has both short and long signals
-Colors background
10 in 1 Different Moving Averages ( SMA/EMA/WMA/RMA )This indicator is a combination of different types of moving averages where you can select which kind of moving average you want according to your need.
It consists of 10 moving averages none of which is fixed by default, you can change the properties of any MA according to your will.
I hope you all will like it.

Daily and Weekly Moving Averages on Daily ChartThis script is designed to be used on Swing and Position style approaches.
Based on moving averages that I use with the integration of a weekly moving average that is visible on the daily chart /all timeframes.
The moving averages are:
9EMA;
21EMA;
10 week SMA ;
50EMA;
150EMA;
and 200EMA.
Base script from CaptainBrett with Matt Caruso's chat with Richard Moglen showing me that this can be done on Tradingview. When searching for the script, I couldn't find it within the public library.
Please Enjoy

Multiple Moving AveragesThis script adds up to 5 moving averages to your chart - and you can select which moving average type (and timeframe) you want to use for each.
The possible MA type options are:
EMA
SMA
HMA
WMA
DEMA
VWMA
VWAP
You can specify the length of each moving average, and you can override the type of all moving averages with the setting "ALL MA TYPE".
There is also higher-timeframe functionality, so you can select the timeframe for each moving average.
If the "Smooth HTF MA" setting is turned on then the script will fill any gaps in intraday price data by averaging the difference (giving it a regular smooth look), and if it's turned off then the HTF MAs will have a "stepped" look to them. Technically speaking, the non-smoothed setting is more accurate and so it's turned off by default.
And finally, the first option "Color MA 1" will change your first MA's color based on whether price action is above that MA's price or below it. If it's above it then the color turns green, if it's below it then it turns red.
If you set an MA's length to zero it will disable that MA.
The source code is protected but available on my website (link in my profile).
Enjoy! Good luck with your trading :) 😎

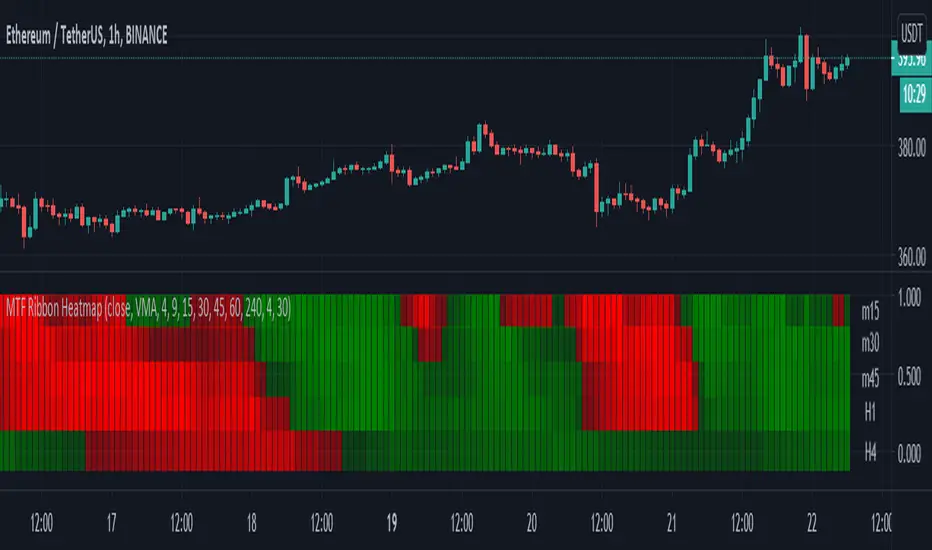
Moving Averages - 5 Ribbon MTF HeatmapThis is a 5 Ribbon heatmap moving averages indicator where each represents a different time frame, The RED or GREEN color palette is also affected by asset velocity using ATR.
Supports various moving averages including VMA (Default), Zero Lag, TSF (Time Series Forecast).
A single ribbon is set to GREEN when fast MA (moving average) is above the slower MA and RED when fast MA is below the slower MA.
In the settings you can set the ATR length (Average True Range) which will affect the velocity calculation for the colors, higher ATR length will smooth the coloring more (Less color changes), while lower ATR will show more instant changes.
HOW TO USE?
The brighter the GREEN is the stronger the up trend.
The brighter the RED is the stronger the down trend.
A weakening GREEN color can be a sign for a down reversal.
A weakening RED color can be a sign for a up reversal .
Supports alerts when fast moving average crosses slow moving average from all time frames, either way, up or down.
Comments/Suggested/Positive feedbacks are welcome and can make this indicator even better.
Follow for upcoming indicators: www.tradingview.com
DMA: Triple Moving AveragesMoving average is a simple, technical analysis tool. Moving averages are usually calculated to identify the trend direction of a stock or to determine its support and resistance levels. It is a trend-following—or lagging—indicator because it is based on past prices.
The longer the time period for the moving average, the greater the lag. So, a 200-day moving average will have a much greater degree of lag than a 20-day MA because it contains prices for the past 200 days. The 50-day and 200-day moving average figures for stocks are widely followed by investors and traders and are considered to be important trading signals.
This indicator was made to allow three moving averages to be displayed without needing to use up 3 charting indicators individually
This is fully complited mini trading system for each traders. Yopu can use short, middle and long view distance of traders interests on market and open your position with trend.

EMA - Color Coded Moving AveragesThis indicator allows two Moving Averages to be input. Each Moving Average is displayed on the chart and area between moving averages changes color based on whether the Fast moving average is abopve / below the Slow moving average.

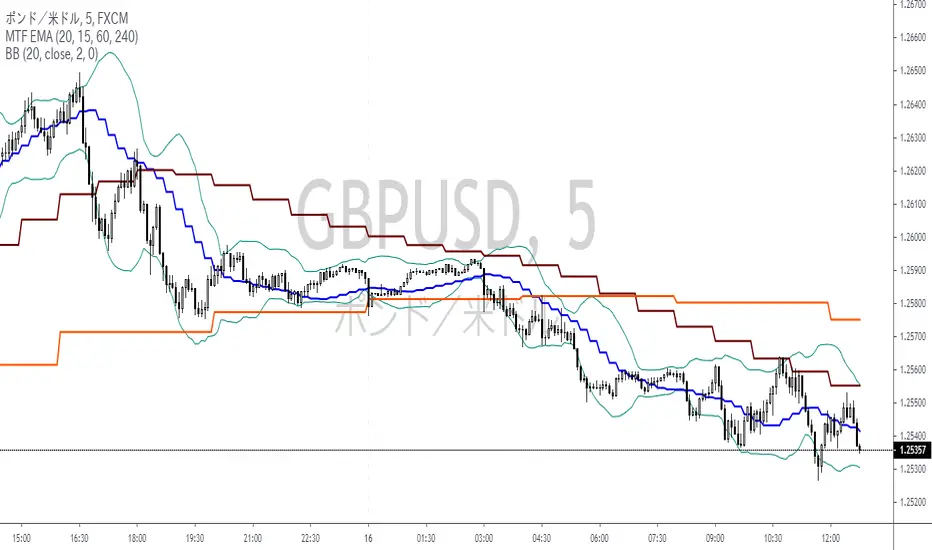
MTF EMA 3Set(Multi Time Frame Exponential Moving Averages 3 Set)Multi Time Frame Exponential Moving Averages 3 Set
One indicator displays the three types of moving averages of the top bar.
It can be used for environment recognition.
It is easy to repel when the 4 hour foot and the pivot overlap.
Multiple Moving Averages in one indicatorHi, that's an "enhanced" version of this indicator gently published by myfye13 .
Here's the things I've implemented:
Up to 8 moving averages
Now you can set the source of each moving average
Now you can set the length of each moving average.
Hope this will help especially those who have an indicato limit or who use multiple emas and don't wan't to see a stack of indicators list on the upper left of the chart.

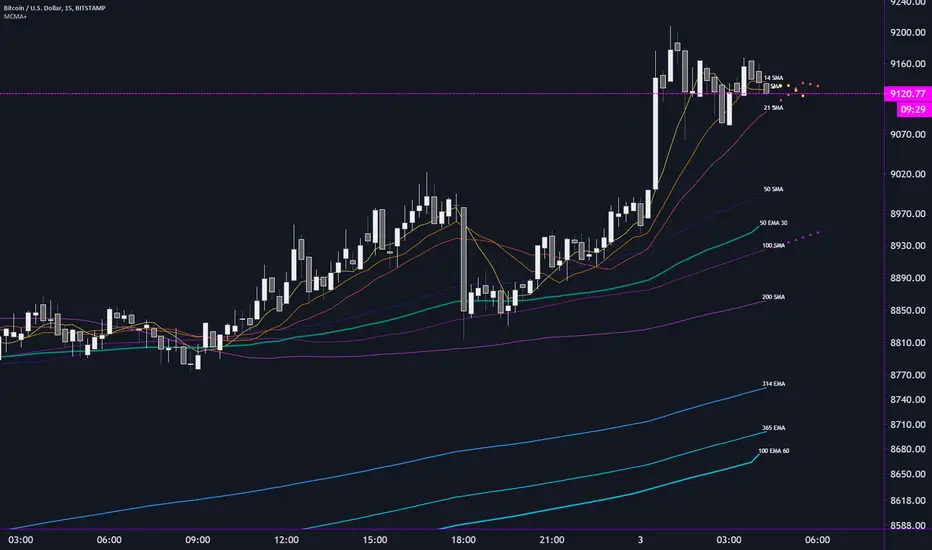
MCMA+ Multi Custom Moving Averages by Flinty + CryptorhythmsLatest release of my Multi Custom Moving Average indicator.
Plot up to 10 moving averages
for each MA, you can customise the following:
Period - from 1 to 1825 days
Type - DEMA, EMA, SMA, TEMA, VMWA or WMA
Source - Open, High, Low, Close, HL2, HLC3,OHLC4
The lowest and highest TF chart each MA will plot on. Only show the MA's you want on any time frame without having to continually adjust settings
Higher Time Frame MA -
Plot up to 3 additional moving averages from higher time frames
Customise each of these with Period, Type, Source, low and high TF plots and finally Time Frame
Time Frame can be a fixed TF or it can be set to always show the interval or period above the currently active TF
Labels can be customised to show the MA number or useful information such as the period, the MA type and the Time Frame where applicable
Another exciting feature is the ability to plot 7 bars ahead by enabling our prediction routine
This can be enabled for any three MA's
Hopefully I will be able to implement crossover alerts in the near future
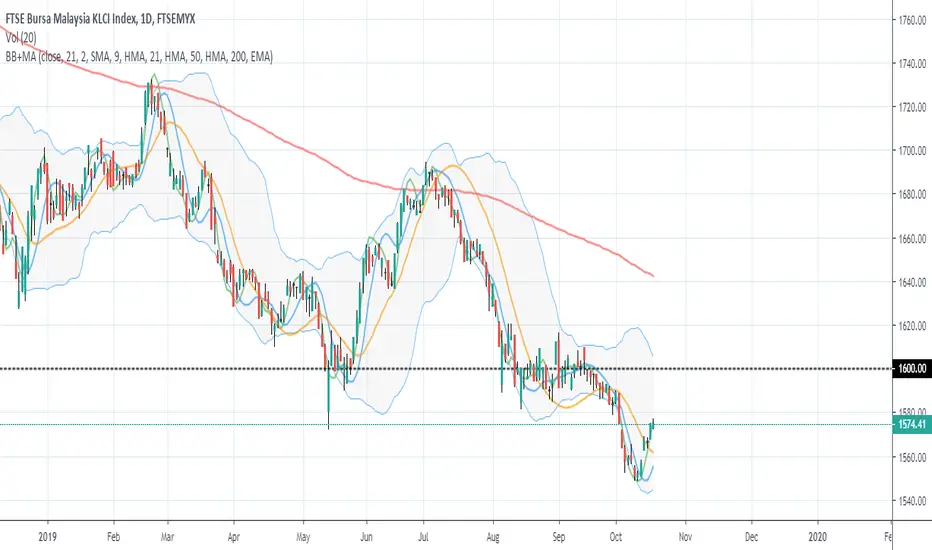
Moving Averages with Bollinger BandsContains moving averages as well as Bollinger bands
7 sma, 2 ema, VWAP, 3 hma, standard Bollinger bands
Wanted moving averages and the Bollinger Bands in a single indicator
Some of the study code copied and pasted from "7MA" (bogdan_black) and "Triple Hull Moving Average" (cmkirkham)

eha Moving Averages StrategyMoving Average based strategies are very popular ones among both long-term investors and short-term traders as they can be tailored to any time frame. One of the main moving average strategies are crossovers. The very simple type is a price crossover , which is when the price crosses above or below a moving average to signal a potential change in trend.
Another strategy is to apply two moving averages to a chart: one longer (or slow) and one shorter (or fast). When the shorter-term MA crosses above the longer-term MA, it's a buy signal, as it indicates that the trend is shifting up (also known as “ Golden Cross ”). Meanwhile, when the shorter-term MA crosses below the longer-term MA, it's a sell signal, as it indicates that the trend is shifting down (which is also known as “ Dead/Death Cross ”).
This is a study to find a suitable trading strategy for 4-6 hour time frames. As you can see the performance is currently very poor. It has just generated almost 90 trades in a very long period from January 2017 to the time of publishing the study for the first time.
Moving averages work quite well in strong trending conditions but poorly in choppy or ranging conditions. Adjusting the time frame can correct this problem temporarily, although, at some point, these issues are likely to occur regardless of the time frame chosen for the moving average(s).
I am working on this basic strategy to make its performance better and I will update the post in the future. So keep in touch by following the post.
Why have I republished my study?
It sounds like TradingView stores and indexes scripts based on the title of the post rather than the actual title of the scripts and if one chose general terms as the title of the post, the TradingView script search engine may be unable to find it. So I decided to repost the strategy with a more searchable and unique prefix of " eha ".
Please provide me with your precious feedback.

Fancy Triple Moving Averages [BigBitsIO]This script is for three moving averages with as many features as I can possibly fit into a single moving average.
Features:
- Three moving averages (MA1, MA2, MA3).
- Standard MA inputs.
- MA type.
- MA period.
- MA price.
- MA resolution (time frame).
- Visibility toggle.
- MA Candle Type
- Fancy MA inputs.
- Toggle to show only candles included in the MA calculation ("Highlight inclusion") or display entire MA history.
- Toggle to show a ghost trail when Highlight inclusion is toggled on. Displays a shaded version of past MA history before the inclusion period (as seen on snapshot).
- Toggle to show forecast values for the MA.
- Other inputs related to forecasting:
- Forecast bias. (Neutral forecasts MA if the current price remains the same.)
- Forecast period.
- Forecast magnitude.
*** DISCLAIMER: For educational and entertainment purposes only. Nothing in this content should be interpreted as financial advice or a recommendation to buy or sell any sort of security or investment including all types of crypto. DYOR, TYOB. ***

Simple & Exponential Moving Averages ProjectionsMA and EMA strategy with projections. This allows exponential moving averages and moving averages to be off the chart as preference with projections on each as desired.
Enjoy =]

Multi Moving AveragesHallo semuanya, kali ini saya akan mempublikasikan skrip indikator yang saya namakan "Multi moving average" atau MMA.
MMA ini memiliki 5 moving average, 2 sma, 2 ema, dan 1 hma yang bisa diatur periode, warna, dan sumbernya.
Tujuan dari skrip ini adalah mempermudah pengaturan beberapa moving average sekaligus dan sebagai
bantuan kecil bagi para "non-premium user" seperti saya (hehe)
Kedepan mungkin saya juga akan membuat beberapa skrip kecil jika ada waktu...
Catatan,
Skrip ini saya adaptasi dari skrip "Three Moving Average" milik user "AdventTrading" yang luar biasa
Semoga skrip kecil ini bisa membantu aktifitas trading teman-teman
EN Section (ketentuan komunitas)-------------
Hello everyone, this time I will publish the indicator script which I call "Multi moving average" or MMA.
This MMA has 5 moving averages, 2 high schools, 2 ema, and 1 hma that can be adjusted for periods, colors, and sources.
The purpose of this script is to facilitate setting multiple moving averages at once and as
small help for "non-premium users" like me (hehe)
In the future maybe I will also make some small scripts if there is time ...
Note,
I adapted this script from "Three Moving Average" amazing script from user "AdventTrading"
unfortunately i cant contact author as (s)he inactive for 2 year, hope (s)he is okay. Giving this script published by author as open-source, this
MMA to will viable as open-source (also according to community rule)
Hopefully this little script can help your trading activities
Exponentially Weighted AveragesImplementation of Exponentially Weighted Averages and it difference in Pine Script. It can generate a line that adjust to the overall trend of a graphic.
Exponentially Weighted Averages
This technique is used for generating smoother lines that adjust to a graphic. In finances, it is used to predict the overall trend of a graphic. The function that defines the EWA is the one bellow:
Vt = β V(t-1) + (1 - β) θt
Where:
β: Hyperparammeter that we have to adjust.
V(t-1): Value calculated for the previous element of the graphic.
θt: Current element of the graphic.


Colored Moving Averages Can Help You Spot TrendsMoving averages are perhaps the most popular indicator in technical analysis. But sometimes they're not the easiest to interpret.
This indicator helps you see the trend by coloring the MA based on its direction. It's green when rising and red when falling. Of course, you can easily change that in the Style tab under Settings.
Color MA also lets you select from five different types of moving averages, including simple, exponential and Hull. We've included a list for easy reference below. Just change the "AvgType" on the Input tab under Settings.
This chart of Facebook shows the 20-day simple moving average. Notice how swings often marked turns in the stock price.
AvgType codes:
1 - Simple Moving Average
2 - Exponential Moving Average
3 - Hull Moving Average
4 - Weighted Moving Average
5 - Volume Weighted Moving Average

Bollinger Bands + Moving AveragesCombination of Bollinger Bands and 4 Moving Averages in one indicator.
The smoothing algorithm for the Bollinger Bands basis line and each of the Moving Averages can be chosen from either SMA , EMA , WMA , RMA, or HMA .
Scripting Tutorial 8 - Triple Many Moving Averages RibbonsThis script is for a triple moving average indicator where the user can select from different types of moving averages, price sources, lookback periods and resolutions.
Features:
- 3 Moving Averages with variable MA types, periods, price sources, resolutions and the ability to disable each individually
- Crossovers are plotted on the chart with detailed information regarding the crossover (Ex: 50 SMA crossed over 200 SMA )
- Forecasting available for all three MAs. MA values are forecasted 5 values out and plotted as if a continuation to the MA.
- Forecast bias also applies to all forecasting. Bias means we can forecast based on an anticipated bullish, bearish or neutral direction in the market.
- To understand bias, please read the source code, or if you can't read the code just send me a message on here or Twitter. Twitter should be linked to my profile.
- Ribbons added and on by default. Optional setting to disable the ribbons. 5 ribbons between MA1 and MA2 and another 5 between MA2 and MA3.
- Ribbons are alpha-color coded based on their relation to their default MAs.
- Ribbons are only visible between MAs if the MAs being compared share the same Type, Resolution, and Source because there is no way to consolidate those three in a simple manner.
- Ribbon values are calculated based on calculated MA Periods between the MAs.
This script is meant as an educational script with well-formatted styling, and references for specific functions.

Scripting Tutorial 7 - Triple Many Moving Averages ResolutionsThis script is for a triple moving average indicator where the user can select from different types of moving averages, price sources, lookback periods and resolutions.
Features:
- 3 Moving Averages with variable MA types, periods, price sources, resolutions and the ability to disable each individually
- Crossovers are plotted on the chart with detailed information regarding the crossover (Ex: 50 SMA crossed over 200 SMA )
- Forecasting available for all three MAs. MA values are forecasted 5 values out and plotted as if a continuation to the MA.
- Forecast bias also applies to all forecasting. Bias means we can forecast based on an anticipated bullish, bearish or neutral direction in the market.
- To understand bias, please read the source code, or if you can't read the code just send me a message on here or Twitter. Twitter should be linked to my profile.
This script is meant as an educational script with well-formatted styling, and references for specific functions.
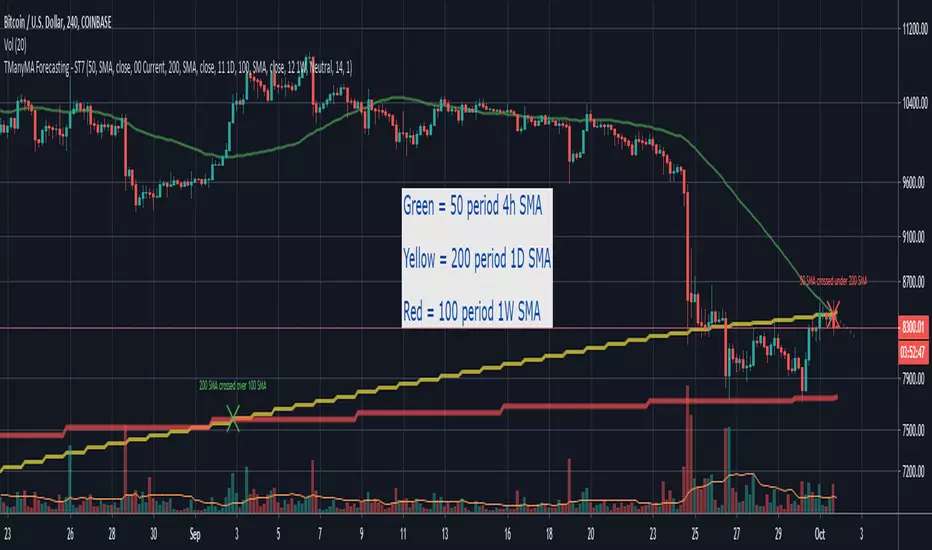
Scripting Tutorial 6 - Triple Many Moving Averages ForecastingThis script is for a triple moving average indicator where the user can select from different types of moving averages, price sources and lookback periods.
Features:
- 3 Moving Averages with variable MA types, periods, price sources and ability to disable each individually
- Crossovers are plotted on the chart with detailed information regarding the crossover (Ex: 50 SMA crossed over 200 SMA )
- Forecasting available for all three MAs. MA values are forecasted 5 values out and plotted as if a continuation to the MA.
- Forecast bias also applies to all forecasting. Bias means we can forecast based on an anticipated bullish, bearish or neutral direction in the market.
- To understand bias, please read the source code, or if you can't read the code just send me a message on here or Twitter. Twitter should be linked on my profile.
This script is meant as an educational script with well-formatted styling, and references for specific functions.
