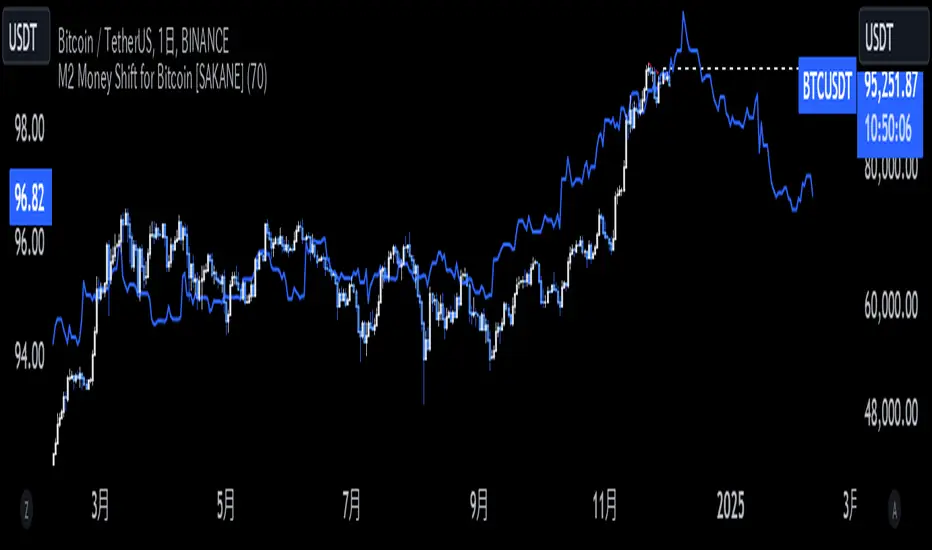
M2 Money Shift for Bitcoin [SAKANE]M2 Money Shift for Bitcoin was developed to visualize the impact of M2 Money, a macroeconomic indicator, on the Bitcoin market and to support trade analysis.
Bitcoin price fluctuations have a certain correlation with cycles in M2 money supply.In particular, it has been noted that changes in M2 supply can affect the bitcoin price 70 days in advance.Very high correlations have been observed in recent years in particular, making it useful as a supplemental analytical tool for trading.
Support for M2 data from multiple countries
M2 supply data from the U.S., Europe, China, Japan, the U.K., Canada, Australia, and India are integrated and all are displayed in U.S. dollar equivalents.
Slide function
Using the "Slide Days Forward" setting, M2 data can be slid up to 500 days, allowing for flexible analysis that takes into account the time difference from the bitcoin price.
Plotting Total Liquidity
Plot total liquidity (in trillions of dollars) by summing the M2 supply of multiple countries.
How to use
After applying the indicator to the chart, activate the M2 data for the required country from the settings screen. 2.
2. adjust "Slide Days Forward" to analyze the relationship between changes in M2 supply and bitcoin price
3. refer to the Gross Liquidity plot to build a trading strategy that takes into account macroeconomic influences.
Notes.
This indicator is an auxiliary tool for trade analysis and does not guarantee future price trends.
The relationship between M2 supply and bitcoin price depends on many factors and should be used in conjunction with other analysis methods.
"bitcoin"に関するスクリプトを検索
Pulse DPO: Major Cycle Tops and Bottoms█ OVERVIEW
Pulse DPO is an oscillator designed to highlight Major Cycle Tops and Bottoms .
It works on any market driven by cycles. It operates by removing the short-term noise from the price action and focuses on the market's cyclical nature.
This indicator uses a Normalized version of the Detrended Price Oscillator (DPO) on a 0-100 scale, making it easier to identify major tops and bottoms.
Credit: The DPO was first developed by William Blau in 1991.
█ HOW TO READ IT
Pulse DPO oscillates in the range between 0 and 100. A value in the upper section signals an OverBought (OB) condition, while a value in the lower section signals an OverSold (OS) condition.
Generally, the triggering of OB and OS conditions don't necessarily translate into swing tops and bottoms, but rather suggest caution on approaching a market that might be overextended.
Nevertheless, this indicator has been customized to trigger the signal only during remarkable top and bottom events.
I suggest using it on the Daily Time Frame , but you're free to experiment with this indicator on other time frames.
The indicator has Built-in Alerts to signal the crossing of the Thresholds. Please don't act on an isolated signal, but rather integrate it to work in conjunction with the indicators present in your Trading Plan.
█ OB SIGNAL ON: ENTERING OVERBOUGHT CONDITION
When Pulse DPO crosses Above the Top Threshold it Triggers ON the OB signal. At this point the oscillator line shifts to OB color.
When Pulse DPO enters the OB Zone, please beware! In this Area the Major Players usually become Active Sellers to the Public. While the OB signal is On, it might be wise to Consider Selling a portion or the whole Long Position.
Please note that even though this indicator aims to focus on major tops and bottoms, a strong trending market might trigger the OB signal and stay with it for a long time. That's especially true on young markets and on bubble-mode markets.
█ OB SIGNAL OFF: EXITING OVERBOUGHT CONDITION
When Pulse DPO crosses Below the Top Threshold it Triggers OFF the OB signal. At this point the oscillator line shifts to its normal color.
When Pulse DPO exits the OB Zone, please beware because a Major Top might just have occurred. In this Area the Major Players usually become Aggressive Sellers. They might wind up any remaining Long Positions and Open new Short Positions.
This might be a good area to Open Shorts or to Close/Reverse any remaining Long Position. Whatever you choose to do, it's usually best to act quickly because the market is prone to enter into panic mode.
█ OS SIGNAL ON: ENTERING OVERSOLD CONDITION
When Pulse DPO crosses Below the Bottom Threshold it Triggers ON the OS signal. At this point the oscillator line shifts to OS color.
When Pulse DPO enters the OS Zone, please beware because in this Area the Major Players usually become Active Buyers accumulating Long Positions from the desperate Public.
While the OS signal is On, it might be wise to Consider becoming a Buyer or to implement a Dollar-Cost Averaging (DCA) Strategy to build a Long Position towards the next Cycle. In contrast to the tops, the OS state usually takes longer to resolve a major bottom.
█ OS SIGNAL OFF: EXITING OVERSOLD CONDITION
When Pulse DPO crosses Above the Bottom Threshold it Triggers OFF the OS signal. At this point the oscillator line shifts to its normal color.
When Pulse DPO exits the OS Zone, please beware because a Major Bottom might already be in place. In this Area the Major Players become Aggresive Buyers. They might wind up any remaining Short Positions and Open new Long Positions.
This might be a good area to Open Longs or to Close/Reverse any remaining Short Positions.
█ WHY WOULD YOU BE INTERESTED IN THIS INDICATOR?
This indicator is built over a solid foundation capable of signaling Major Cycle Tops and Bottoms across many markets. Let's see some examples:
Early Bitcoin Years: From 0 to 1242
This chart is in logarithmic mode in order to properly display various exponential cycles. Pulse DPO is properly signaling the major early highs from 9-Jun-2011 at 31.50, to the next one on 9-Apr-2013 at 240 and the epic top from 29-Nov-2013 at 1242.
Due to the massive price movements, the OB condition stays pinned during most of the exponential price action. But as you can see, the OB condition quickly vanishes once the Cycle Top has been reached. As the market matures, the OB condition becomes more exceptional and triggers much closer from the Cycle Top.
With regards to Cycle Bottoms, the early bottom of 2 after having peaked at 31.50 doesn’t get captured by the indicator. That is the only cycle bottom that escapes the Pulse DPO when the bottom threshold is set at a value of 5. In that event, the oscillator low reached 6.95.
Bitcoin Adoption Spreading: From 257 to 73k
This chart is in logarithmic mode in order to properly display various exponential cycles. Pulse DPO is properly signaling all the major highs from 17-Dec-2017 at 19k, to the next one on 14-Apr-2021 at 64k and the most recent top from 9-Nov-2021 at 68k.
During the massive run of 2017, the OB condition still stayed triggered for a few weeks on each swing top. But on the next cycles it started to signal only for a few days before each swing top actually happened. The OB condition during the last cycle top triggered only for 3 days. Therefore the signal grows in focus as the market matures.
At the time of publishing this indicator, Bitcoin printed a new All Time High (ATH) on 13-Mar-2024 at 73k. That run didn’t trigger the OB condition. Therefore, if the indicator is correct the Bitcoin market still has some way to grow during the next months.
With regards to Cycle Bottoms, the bottom of 3k after having peaked at19k got captured within the wide OS zone. The bottom of 15k after having peaked at 68k got captured too within the OS accumulation area.
Gold
Pulse DPO behaves surprisingly well on a long standing market such as Gold. Moving back to the 197x years it’s been signaling most Cycle Tops and Bottoms with precision. During the last cycle, it shows topping at 2k and bottoming at 1.6k.
The current price action is signaling OB condition in the range of 2.5k to 2.7k. Looking at past cycles, it tends to trigger on and off at multiple swing tops until reaching the final cycle top. Therefore this might indicate the first wave within a potential gold run.
Oil
On the Oil market, we can see that most of the cycle tops and bottoms since the 80s got signaled. The only exception being the low from 2020 which didn’t trigger.
EURUSD
On Forex markets the Pulse DPO also behaves as expected. Looking back at EURUSD we can see the marketing triggering OB and OS conditions during major cycle tops and bottoms from recent times until the 80s.
S&P 500
On the S&P 500 the Pulse DPO catched the lows from 2016 and 2020. Looking at present price action, the recent ATH didn’t trigger the OB condition. Therefore, the indicator is allowing room for another leg up during the next months.
Amazon
On the Amazon chart the Pulse DPO is mirroring pretty accurately the major swings. Scrolling back to the early 2000s, this chart resembles early exponential swings in the crypto space.
Tesla
Moving onto a younger tech stock, Pulse DPO captures pretty accurately the major tops and bottoms. The chart is shown in logarithmic scale to better display the magnitude of the moves.
█ SETTINGS
This indicator is ideal for identifying major market turning points while filtering out short-term noise. You are free to adjust the parameters to align with your preferred trading style.
Parameters : This section allows you to customize any of the Parameters that shape the Oscillator.
Oscillator Length: Defines the period for calculating the Oscillator.
Offset: Shifts the oscillator calculation by a certain number of periods, which is typically half the Oscillator Length.
Lookback Period: Specifies how many bars to look back to find tops and bottoms for normalization.
Smoothing Length: Determines the length of the moving average used to smooth the oscillator.
Thresholds : This section allows you to customize the Thresholds that trigger the OB and OS conditions.
Top: Defines the value of the Top Threshold.
Bottom: Defines the value of the Bottom Threshold.

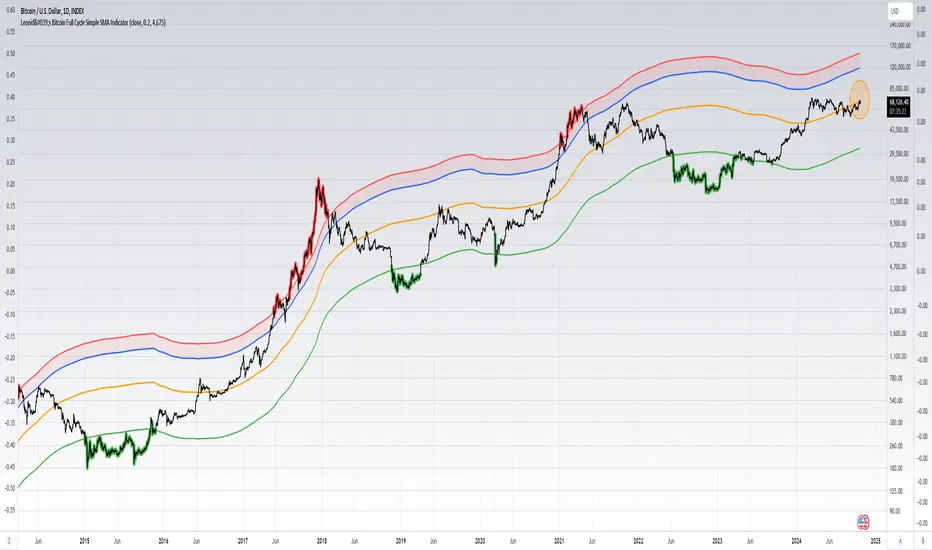
Leonid's Bitcoin Full Cycle Simple SMA IndicatorThis is a straight-forward and customizable indicator to track Bitcoin cycles, specifically used for helping investors understand where to buy and sell. This is done by using a two year SMA period as the base calculation. With that calculation you create lower and upper bounds for bull market peaks and bear market bottoms.
The novel idea here is that you can customize the SMA "strength" for both the upper and lower bounds as alpha decays over time and price get's less volatile with adoption increasing. The multiples are customizable for both the upper and lower bounds along with a mid-line that will adjust based on the settings input.
Indicators don't always have to rely on crazy math or outlandish ideas to be useful, sometimes even the simplest of inputs can give investors (especially those that are new) a great base case for their strategy. Something being simple does not diminish the idea or strength behind the data.
How to use this indicator: This script must be used on INDEX:BTCUSD (Bitcoin All-Time History Index) with the y-axis being set to Logarithmic scale.
Details & how to interpret: The price is colored green when Bitcoin enters a "value zone" meaning it is heavily oversold and likely near a bottom for the bear market cycle. The price is colored red when Bitcoin enters an "overbought zone" meaning it is heavily overbought and is likely near a top for the bull market cycle.
Along with the upper and lower bound I have plotted a mid-line (in orange) to establish a neutral zone which helps depict what phase of the cycle we're in (under mid-line = bearish/accumulation phase, over mid-line = bullish/distribution phase).
The inputs for the upper and lower bound are customizable and will need to be adjusted over time as alpha decay will occur as time goes on. Currently the numbers are as follows:
0.2 for the lower bound
4.675 for the upper bound
Both inputs can be modified depending on your risk tolerance. Mathematically it is safe to assume these numbers will decrease as time goes on and volatility during cycle peaks & troughs is reduced.
I've also plotted an upper bound "heat zone" which is shaded in green, this area is great for signaling when you should be preparing to begin taking profits. It takes the upper bound and subtracts the lower bound to derive the band.
All the colors are customizable and this indicator is best used on a line chart but can be customized to use on a bar chart/candlestick as well.
Simple Moving Averages are a very basic indicator but are often extremely powerful because the majority of traders/investors are looking at such levels which creates a psychological/herd effect. Another good example is the law of round numbers.
Regardless this script can be adapted with EMAs or additional standard deviations if necessary. If you have any questions or concerns please don't hesitate to message me.
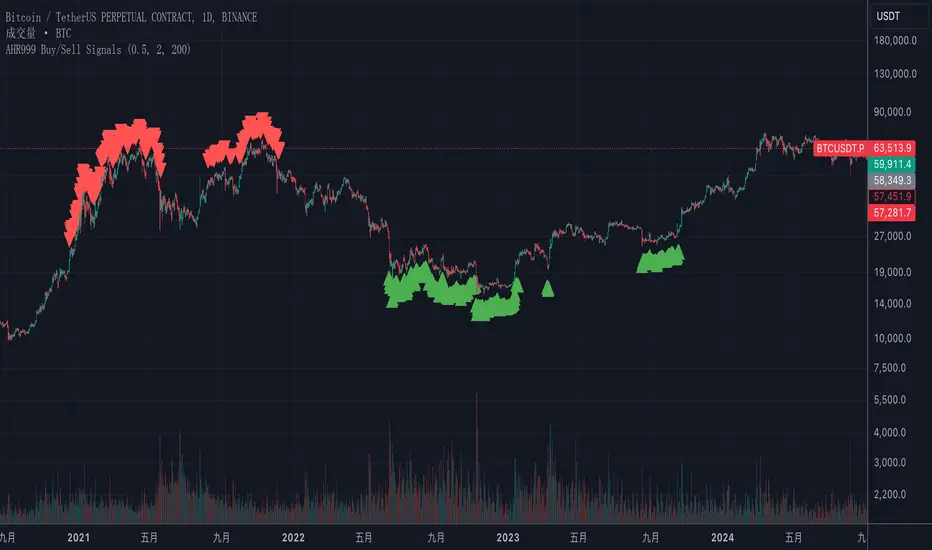
AHR999 Bitcoin Buy/Sell Signals Indicator - Accurate Trading OppThis Pine Script indicator combines the AHR999 metric with Bitcoin's historical price trends to provide clear buy and sell signals, assisting you in making informed trading decisions at crucial moments. It calculates the AHR999 index based on Bitcoin's 200-day Geometric Moving Average (GMA) and the estimated price, offering customizable buy and sell thresholds for precise entry and exit points. Ideal for traders looking to capture long-term investment trends, this indicator helps you effectively identify Bitcoin market opportunities.
BTC Coinbase PremiumThis script is designed to compare the price of Bitcoin on two major exchanges: Coinbase and Binance. It helps you see if there’s a difference in the price of Bitcoin between these two exchanges, which is known as a “premium” or “discount.”
Here’s how it works in simple terms:
Getting the Prices:
The script first fetches the current price of Bitcoin from Coinbase and Binance. It looks at the closing price, which is the price at the end of the selected time period on your chart.
Calculating the Difference:
It then calculates the difference between these two prices. If Bitcoin is more expensive on Coinbase than on Binance, this difference will be positive, indicating a “premium.” If it’s cheaper on Coinbase, the difference will be negative, indicating a “discount.”
Visualizing the Difference:
The script creates a visual chart that shows this price difference over time. It uses green bars to show when there’s a premium (Coinbase is more expensive) and red bars to show when there’s a discount (Coinbase is cheaper).
Optional Table Display:
If you choose to, the script can also show this price difference in a small table at the top right corner of your chart. The table displays the words “Coinbase Premium” and the exact dollar amount of the premium or discount.
Why does it matter?
Traders and investors have spotted a correlation between bullish strength on BTC and a strong Coinbase premium along with the inverse of a strong Coinbase discount and BTC price weakness.

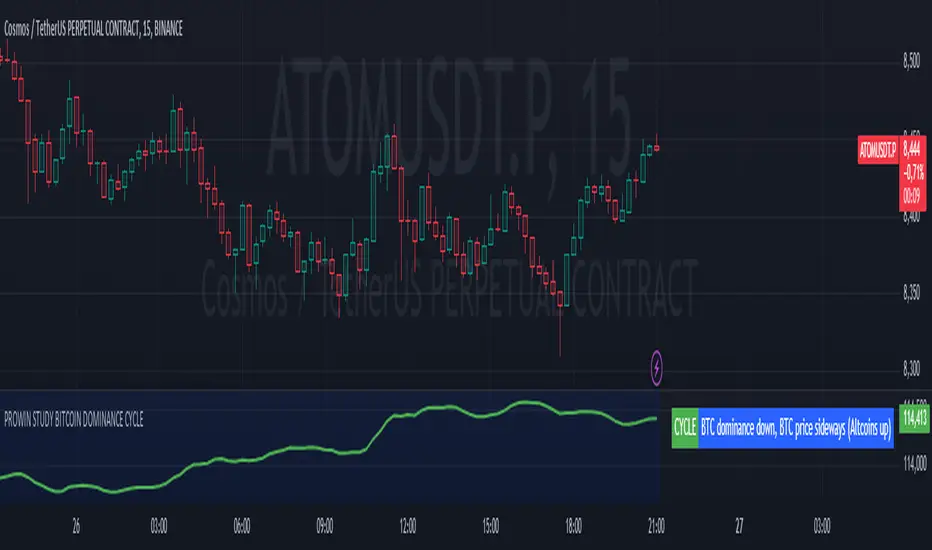
PROWIN STUDY BITCOIN DOMINANCE CYCLE**Title: PROWIN STUDY BITCOIN DOMINANCE CYCLE**
**Overview:**
This TradingView script analyzes the relationship between Bitcoin dominance and Bitcoin price movements, as well as the performance of altcoins. It categorizes market conditions into different scenarios based on the movements of Bitcoin dominance and Bitcoin price, and plots the Exponential Moving Average (EMA) of the altcoins index.
**Key Components:**
1. **Bitcoin Dominance:**
- `dominanceBTC`: Fetches the Bitcoin dominance from the "CRYPTOCAP:BTC.D" symbol for the current timeframe.
2. **Bitcoin Price:**
- `priceBTC`: Uses the closing price of Bitcoin from the current chart (assumed to be BTC/USD).
3. **Altcoins Index:**
- `altcoinsIndex`: Fetches the total market cap of altcoins (excluding Bitcoin) from the "CRYPTOCAP:TOTAL2" symbol.
4. **EMA of Altcoins:**
- `emaAltcoins`: Calculates the 20-period Exponential Moving Average (EMA) of the altcoins index.
**Conditions:**
1. **Bitcoin Dominance and Price Up:**
- `dominanceBTC_up`: Bitcoin dominance crosses above its 20-period Simple Moving Average (SMA).
- `priceBTC_up`: Bitcoin price crosses above its 20-period SMA.
2. **Bitcoin Dominance Up and Price Down:**
- `priceBTC_down`: Bitcoin price crosses below its 20-period SMA.
3. **Bitcoin Dominance Up and Price Sideways:**
- `priceBTC_lateral`: Bitcoin price change is less than 5% of its 10-period average change.
4. **Altseason:**
- `altseason_condition`: Bitcoin dominance crosses below its 20-period SMA while Bitcoin price crosses above its 20-period SMA.
5. **Dump:**
- `dump_altcoins_condition`: Bitcoin dominance crosses below its 20-period SMA while Bitcoin price crosses below its 20-period SMA.
6. **Altcoins Up:**
- `altcoins_up_condition`: Bitcoin dominance crosses below its 20-period SMA while Bitcoin price moves sideways.
**Current Condition:**
- Determines the current market condition based on the above scenarios and stores it in the `currentCondition` variable.
**Plotting:**
- Plots the EMA of the altcoins index on the chart in green with a linewidth of 2.
- Displays the current market condition in a table at the top-right of the chart, with appropriate background and text colors.
**Background Color:**
- Sets a semi-transparent blue background color for the chart.
This script helps traders visualize and understand the market dynamics between Bitcoin dominance, Bitcoin price, and altcoin performance, providing insights into different market cycles and potential trading opportunities.
Qu_Trend+
composition
- Consists of a thick trend line and a thin yellow line.
- The largest (green/red) lines indicate rising and falling markets.
- This line represents the 13-candle moving average of Tilson T3.
- The reason for 13 candles is because it best matches the recent market price based on Bitcoin.
- This value cannot be changed, so if you need it, please modify the public code and use it.
- The yellow line is the MA20 line, the ‘Bollinger Band center line’
(UI will show whether this line has been breakout)
- The same algorithm as 20 of the basic moving average (close standard) is applied.
- The algorithm for breakthrough is calculated based on real-time prices, not based on closing prices.
An additional short-term SMA is created, and whether it crosses the SMA is classified as a breakout/resistance.
How to use it
- If the trend line becomes gentle, it may indicate a change in trend when + MA20 is broken.
- While the slope of the trend line is steep, it indicates that the trend is difficult to change.
(If the trend changes at this time, it is likely to move sideways)
- If the trend changes continuously, it is a sideways market.
At this time, watch out for the movement of the end point where the sideways trend ends.

BTC Price to Hashrate Delta Ratio with MAHistorically, Hashrate and Bitcoin prices have a strong correlation. When hashrate increases more than Bitcoin price, it indicates a rise in Bitcoin price soon.
This indicator uses the formula:
Price/hashrate delta ratio = period price delta / period hashrate delta
Whenever the ratio between the price and hashrate of Bitcoin is positive, it indicates that the price is increasing at a faster rate than the hashrate. This, in turn, means that Bitcoin is becoming more expensive compared to any variations occurring in the hashrate. Using the Price/Hashrate Delta ratio, we can determine whether Bitcoin is overvalued or undervalued in relation to the hashrate. This can be a helpful indicator for assessing the current market conditions.

Correlation Coefficient - DXY & XAUPublishing my first indicator on TradingView. Essentially a modification of the Correlation Coefficient indicator, that displays a 2 ticker symbols' correlation coefficient vs, the chart presently loaded.. You can modify the symbols, but the default uses DXY and XAU, which have been displaying strong negative correlation.
As with the built-in CC (Correlation Coefficient) indicator, readings are taken the same way:
Positive Correlation = anything above 0 | stronger as it moves up towards 1 | weaker as it moves back down towards 0
Negative Correlation = anything below 0 | stronger moving down towards -1 | weaker moving back up towards 0
This is primarily created to work with the Bitcoin weekly chart, for comparing DXY and Gold (XAU) price correlations (in advance, when possible). If you change the chart timeframe to something other than weekly, consider playing with the Length input, which is set to 35 by default where I think it best represents correlations with Bitcoin's weekly timeframe for DXY and Gold.
The intention is that you might be able to determine future direction of Bitcoin based on positive or negative correlations of Gold and/or the US Dollar Index. DXY has been making peaks and valleys prior to Bitcoin since after March 2020 black swan event, where it peaked just after instead. In the future, it may flip over again and Bitcoin may hit major highs or lows prior to DXY, again. So, keep an eye on the charts for all 3, as well as the indicator correlations.
Currently, we've moved back into negative correlation between Bitcoin and DXY, and positive correlation with Bitcoin and Gold:
Negative Correlation b/w Bitcoin and DXY - if DXY moves up, Bitcoin likely moves down, or if DXY moves down, Bitcoin likely moves up (or if Bitcoin were to move first before DXY, as it did on March 2020, instead)
Positive Correlation b/w Bitcoin and Gold - Bitcoin and Gold will likely move up or down with each other.
DXY is represented by the green histogram and label, Gold is represented by the yellow histogram and label. Again, you can modify the tickers you want to check against, and you can modify the colors for their histograms / labels.
The inspiration from came from noticing areas of same date or delayed negative correlation between Bitcoin and DXY, here is one of my most recent posts about that:
Please let me know if you have any questions, or would like to see updates to the indicator to make it easier to use or add more useful features to it.
I hope this becomes useful to you in some way. Thank you for your support!
Cheers,
dudebruhwhoa :)

Optimized Logarithmic Curve for Bitcoin (BTC/USD) by FICASHello everyone!
I'd like to share with you a handy tool that is incredibly useful for analyzing Bitcoin's price movements. This optimized logarithmic curve indicator is a refined version of the popular "My BTC log curve" indicator, originally created by @quantadelic.
We have made several improvements to enhance its predictive capabilities when it comes to identifying potential price bottoms for Bitcoin BTC/USD.
Description:
In this detailed analysis, we are excited to introduce you to an optimized version of the popular "My BTC log curve" indicator, originally created by @quantadelic. We have refined the indicator for enhanced predictive capabilities when it comes to identifying potential price bottoms for Bitcoin BTC/USD. By putting ourselves in the reader's shoes, we aim to provide a comprehensive and meaningful explanation of our analysis and predictions using this improved tool.
The logarithmic curve is a powerful tool for analyzing price movements in a non-linear fashion, allowing traders and investors to identify critical turning points and trends. With the optimized logarithmic curve, we can more accurately predict potential price bottoms, ultimately guiding better-informed trading and investment decisions.
Key Features of the Optimized Logarithmic Curve:
Improved predictive capabilities: The refined logarithmic curve has been optimized to provide more accurate predictions of potential price bottoms, enabling traders to make better-informed decisions.
Enhanced visualization: The optimized curve offers a clearer visual representation of Bitcoin's price movements, making it easier for traders to identify patterns and trends.
Adaptability: This indicator can be applied to various timeframes, providing insights for both short-term and long-term traders.
The optimized logarithmic curve indicator is based on a logarithmic regression of the USD price of Bitcoin, calculated according to the equation:
y = A * exp(beta * x^lambda + c) + m * x + b
where x is the number of days since the genesis block. All parameters are editable in the script options, allowing traders to customize the curve to their preferences.
Here are some of the key changes made to the original indicator to create the optimized logarithmic curve:
Midline Calculation: The optimized logarithmic curve utilizes an updated method for calculating the midline, which better represents the average price movement of Bitcoin over time. This improved midline calculation provides a more accurate representation of Bitcoin's historical price trajectory, making it easier to identify potential price bottoms.
Cross Line Calculation: We have modified the way cross lines are calculated in the optimized logarithmic curve. These new cross lines are derived from a combination of the updated midline calculation and historical support and resistance levels. This change allows traders to more accurately identify critical points in the market where price action is likely to reverse or continue its trend.
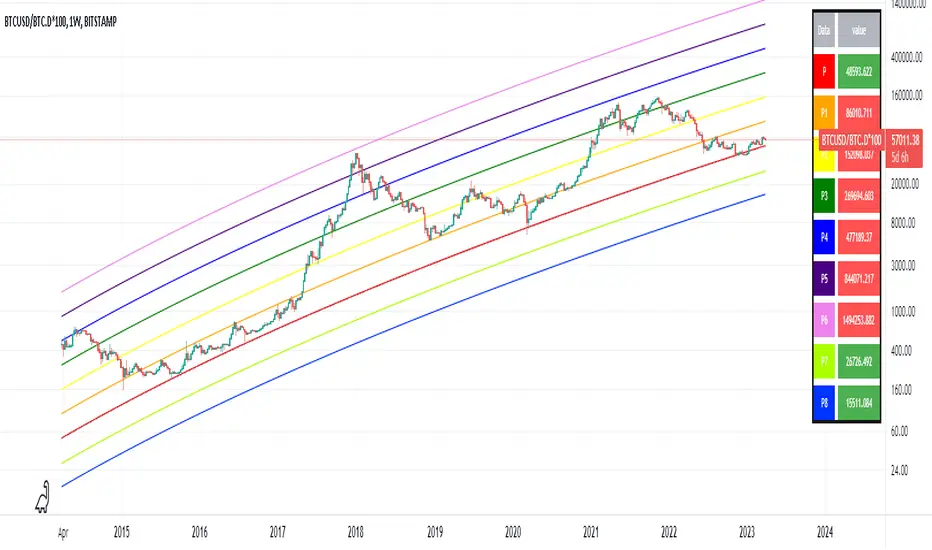
Table Display: a powerful visualization tool designed to provide a comprehensive overview of the relationships between various exponential curves and the Bitcoin price. This table display, integrated into the "FiCAS BTC log curve" indicator, enables traders and analysts to quickly compare and assess the impact of these curves on the market.
Our analysis using the optimized logarithmic curve suggests that Bitcoin might be at a critical price bottom, indicating that selling at this point may not be the most prudent course of action. Instead, traders and investors could consider taking advantage of the potential upswing as the market moves away from the identified price bottom.
Key highlights of this Optimized Logarithmic Curve for Bitcoin (BTC/USD) by FICAS:
Custom Pine Script: Pinescript code serves as the backbone of this strategy, providing a strong foundation for identifying potential opportunities based on the relationships between exponential curves and Bitcoin price.
MACD Indicator: The Moving Average Convergence Divergence (MACD) is integrated to help traders recognize trend reversals, bullish or bearish market conditions, and potential entry or exit points.
Momentum Indicator: By incorporating the Momentum (10, close) indicator, traders can identify the strength of price movements and potential trend continuations or reversals.
RSI and SMA: The Relative Strength Index (RSI) is used to assess overbought or oversold conditions, while the Simple Moving Average (SMA) with a period of 14 and an applied factor of 2 smoothens the data for better trend identification.
IMPORTANT:
While this indicator can be applied to traditional BTC/USD charts, we highly recommend using it on the following chart for optimal results in identifying price bottoms:
BITSTAMP:BTCUSD / CRYPTOCAP:BTC.D * 100
By employing the optimized logarithmic curve indicator on the recommended chart, traders can gain a more accurate perspective on potential price bottoms, leading to improved decision-making.
In conclusion, the optimized logarithmic curve indicator provides valuable insights into Bitcoin's price movements, allowing traders and investors to make more informed decisions. We encourage you to test this refined tool and share your thoughts in the comments section. Special thanks to @quantadelic, the first creator of this indicator, for inspiring us to develop this optimized version. If you have any questions or require further clarification, please feel free to ask. Wishing you success in your trading and investment endeavors!
Please ensure you understand and abide by the TradingView House Rules when using this indicator: www.tradingview.com
DXY Overlay CompareOverlays the DXY chart over the top of any other chart. When the dollar strength increases, asset prices can drop and vice versa. Was created personally to compare with the price of Bitcoin.

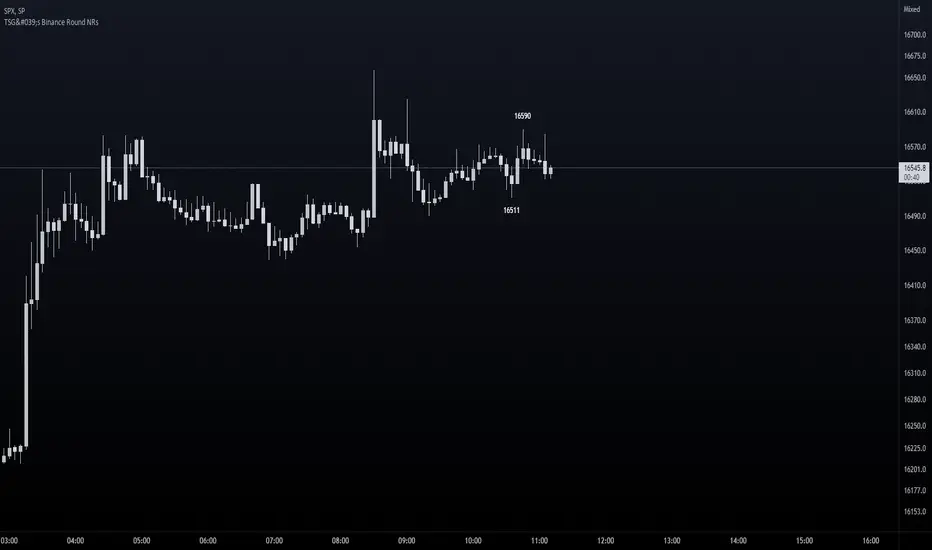
TSG's Binance Round NRs - only for BTCThis is good real-time / scalp indicator for those scalping Bitcoin.
It is based solely on Binance's BTCUSDT Perpetuals, but can be used on any BTCUSD pair as I am requesting info directly from Binance's chart.
IDEA
I have spotted that many times, round nrs (most likely caused by algo-trading) mark a top / bottom on a trend. Many times have catched extremes because of this technique and I have now coded it into an indicator on TradingView.
Feel free to test it out - It's not a 100% strategy - but if you spot round nrs around confluences - your odds go up big time.
SETUP
You are able to set the amount of candles you want to search for - default is 20.
Ofcourse we look only for extremes, therefore it will only look for extreme highs and lows within the amount of candles of your input.
HOW TO READ IT
The indicator will mark only the last High and Low matching the criteria - above and below the candle with the price number.
Good luck!
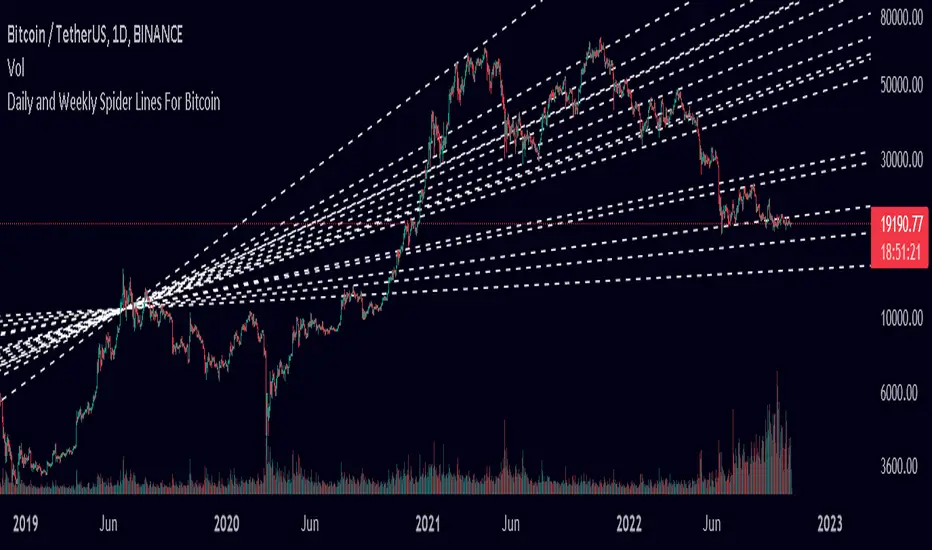
Spider Lines For Bitcoin (Daily And Weekly)I haven't seen any indicator do this, so I decided to publish this to form automatic Spider Charts without actually going through the effort of drawing them!
This script charts dotted lines (spider lines) all over, depicting support and resistance levels.
It works by connecting some candles from the 2018 bear market to the candle from 1st July 2019, followed by extending the lines to the right, making support and resistance levels for the future. The script works only for the daily and weekly charts for Bitcoin.
The levels are accurate to a good extent.
If the lines don't load, zoom out until the 2018 bear market top and it should load then.
Have fun with this indicator!
BTC Hashrate ribbonsBTC Hash Rate ribbons / Hash Rate cross
This strategy goes long when BTCs Hash Rate 30 day moving average crosses above the 60 day moving average, signifying that miner capitulation is over and recovery has started.
When the opposite signal is given, which signifies the beginning of miner capitulation, the strategy goes short (or flat, depending on configuration). This is generally considered the most popular Hash Rate related strategy.
The strategy is based on this medium article: medium.com
Thanks to the recent integration of IntoTheBlock data into Tradingview, we can now effortlessly show Hash Rate data on our chart,
keep in mind however, that IntoTheBlock doesn't provide Hash Rate data on timeframes below daily, so this strategy is based used on the daily, weekly or even monthly time frames.
Hash Rate definition:
The Bitcoin hash rate is the number of times per second that computers on the Bitcoin network are hashing data to verify transactions and perform the encryption that secures the network. The hash rate is an indicator of how healthy the Bitcoin network is at any given time, and is driven primarily by difficulty mining and the number of miners. Generally, a high hash rate is considered a good thing.
More precisely, the Bitcoin hash rate is the number of times per second that computers on the Bitcoin network are hashing data to verify transactions and perform the encryption that secures the network.

BTC Hashrate with smoothingBTC Hashrate with smoothing - thanks to the recent integration of IntoTheBlock data into Tradingview, we can now effortlessly show Hashrate data on our chart.
One popular use for Hashrate is to buy when the 30 day moving average crosses above the 60 day moving average, signifying that miner capitulation is over and recovery has started.
Definition
The Bitcoin hash rate is the number of times per second that computers on the Bitcoin network are hashing data to verify transactions and perform the encryption that secures the network. The hash rate is an indicator of how healthy the Bitcoin network is at any given time, and is driven primarily by difficulty mining and the number of miners. Generally, a high hash rate is considered a good thing.
More precisely, the Bitcoin hash rate is the number of times per second that computers on the Bitcoin network are hashing data to verify transactions and perform the encryption that secures the network.

Stochastic Moving AverageHi all,
This Strategy script combines the power of EMAs along with the Stochastic Oscillator in a trend following / continuation manner, along with some cool functionalities.
I designed this script especially for trading altcoins, but it works just as good on Bitcoin itself and on some Forex pairs.
______ SIGNALS ______
The script has 4 mandatory conditions to unlock a trading signal. Find these conditions for a long trade below (works the exact other way round for shorts)
- Fast EMA must be higher than Slow EMA
- Stochastic K% line must be in oversold territory
- Stochastic K% line must cross over Stochastic D% line
- Price as to close between slow EMA and fast EMA
Once all the conditions are true, a trade will start at the opening of the next
______ SETTINGS ______
- Trade Setup:
Here you can choose to trade only longs or shorts and change your Risk:Reward.
You can also decide to adjust your volume per position according to your risk tolerance. With “% of Equity” your stop loss will always be equal to a fixed percentage of your initial capital (will “compound” overtime) and with “$ Amount” your stop loss will always be 'x' amount of the base currency (ex: USD, will not compound)
Stop Loss:
The ATR is used to create a stop loss that matches current volatility. The multiplier corresponds to how many times the ATR stop losses and take profits will be away from closing price.
- Stochastic:
Here you can find the usual K% & D% length and overbought (OB) and oversold (OS) levels.
The “Stochastic OB/OS lookback” increase the tolerance towards OB/OS territories. It allows to look 'x' bars back for a value of the Stochastic K line to be overbought or oversold when detecting an entry signal.
The “All must be OB/OS” refers to the previous “Stochastic OB/OS lookback” parameter. If this option is ticked, instead of needing only 1 OB/OS value within the lookback period to get a valid signal, now, all bars looked back must be OB/OS.
The color gradient drawn between the fast and slow EMAs is a representation of the Stochastic K% line position. With default setting colors, when fast EMA > slow EMA, gradient will become solid blue when Stochastic is oversold and when slow EMA > fast EMA, gradient will become solid blue when Stochastic is overbought
- EMAs:
Just pick your favorite ones
- Reference Market:
An additional filter to be certain to stay aligned with the current a market index trend (in our case: Bitcoin). If selected reference market (and timeframe) is trading above selected EMA, this strategy will only take long trades (vice-versa for shorts) Because, let’s face it… even if this filter isn’t bulletproof, you know for sure that when Bitcoin tanks, there won’t be many Alts going north simultaneously. Once again, this is a trend following strategy.
A few tips for increased performance: fast EMA and D% Line can be real fast… 😉
As always, my scripts evolve greatly with your ideas and suggestions, keep them coming! I will gladly incorporate more functionalities as I go.
All my script are tradable when published but remain work in progress, looking for further improvements.
Hope you like it!

Lev Umanov Sin EquationThis indicator is taken from the calculations made by Lev Umanov. It predicts the peaks of Bitcoin. The indicator works with most BTCUSD pairings.

BTC Gravity OscillatorThis indicator is a deviation of a Center of Gravity Oscillator corrected for the diminishing returns of Bitcoin.
I've set up this indicator for it to be used on the weekly timeframe. The indicator oscillates between 0 and 10, where 0 indicates oversold conditions and 10 indicates overbought conditions.
The indicator plots in any BTCUSD spot, futures , BLX index and BTCEUR .
It paints in all time frames, but Weekly time frame is the correct one to interpret the 'official' read of it.

BTC Cap Dominance RSIBTC Cap Dominance RSI indicator is a combination of the RSI of Bitcoin Market Cap and the RSI of Bitcoin Dominance. The concept of this indicator is to get a good grasp of the bitcoin market flow by combining bitcoin dominance as well as bitcoin market cap.
BTC Cap Dominance (BCD) RSI is defined as:
BCD RSI = (BTC Cap RSI + BTC Dominance RSI) / 2
Case 1 (Bull market):
Both Cap RSI and Dominance RSI values are high
Case 2 (Neutral market):
Cap RSI is high but Dominance RSI is low
Cap RSI is low but Dominance RSI is high
Case 3 (Bear market):
Both Cap RSI and Dominance RSI values are low
(Note) Please note that the market capitalization symbols (CRYPTOCAP:TOTAL and CRYPTOCAP:TOTAL2) of TradingView started in January 2020, so you can check the indicator value from this point on.

BTC Cap Dominance RSI StrategyThis strategy is based on the BTC Cap Dominance RSI indicator, which is a combination of the RSI of Bitcoin Market Cap and the RSI of Bitcoin Dominance. The concept of this strategy is to get a good grasp of the bitcoin market flow by combining bitcoin dominance as well as bitcoin market cap.
BTC Cap Dominance (BCD) RSI is defined as:
BCD RSI = (BTC Cap RSI + BTC Dominance RSI) / 2
Case 1 (Bull market):
Both Cap RSI and Dominance RSI values are high
Case 2 (Neutral market):
Cap RSI is high but Dominance RSI is low
Cap RSI is low but Dominance RSI is high
Case 3 (Bear market):
Both Cap RSI and Dominance RSI values are low
When the BCD RSI value closes the candle above the Bull level, it triggers a long signal and when the value closes below the Bear level, it triggers a short signal.
(Note) Please note that TradingView's market cap symbols (CRYPTOCAP:TOTAL and CRYPTOCAP:TOTAL2) started in January 2020, so strategy backtesting is possible from this point on.
(Note) Since the real-time BCD RSI value does not come out with this strategy, it is recommended to use it together because the current value can be known and the long-short signal can be predicted in advance by using a separate BCD RSI Index together.
If "Use Combination of dominance RSI ?" is not checked in addition to the recommended default value of the strategy, the recommended values are Length (14), Bull level (74), Bear level (25).
_______________________________________________________________________
이 전략은 비트코인 시가총액의 RSI와 비트코인 도미넌스 RSI를 조합하여 만든 BTC Cap Dominance RSI 지표를 기반으로 만들어졌습니다. 이 전략의 컨셉은 비트코인 시가총액뿐만 아니라 비트코인 도미넌스를 조합함으로써 비트코인 시장 흐름을 잘 파악할 수 있도록 하는 것입니다.
BTC Cap Dominance (BCD) RSI는 다음과 같이 정의하였습니다.
BCD RSI = (BTC Cap RSI + BTC Dominance RSI) / 2
Case 1 (강세 장):
Cap RSI와 Dominance RSI 값 모두 높은 경우
Case 2 (횡보 장):
Cap RSI는 높지만 Dominance RSI는 낮은 경우
Cap RSI는 낮지만 Dominance RSI는 높은 경우
Case 3 (약세 장):
Cap RSI와 Dominance RSI 값 모두 낮은 경우
BCD RSI 값이 Bull level 위에서 캔들 마감할 경우 long 신호를 트리거하고 Bear level 아래에서 캔들 마감할 경우 short 신호를 트리거합니다.
(주의) 트레이딩뷰의 시가총액 심볼들 (CRYPTOCAP:TOTAL과 CRYPTOCAP:TOTAL2)이 2020년 1월부터 시작하였으므로 이 시점부터 전략 백테스팅이 가능한 점을 유의하십시오.
(주의) 이 전략은 실시간 BCD RSI 값이 나오지 않기 때문에 별도의 BCD RSI Index를 함께 사용하면 현재 값을 알 수 있어 롱숏 신호를 사전에 예측할 수 있으므로 함께 사용하기를 권장합니다.
전략의 추천 기본값 외에 "Use Combination of dominance RSI ?"를 체크하지 않는 경우 권장하는 값은 Length (14), Bull level (74), Bear level (25) 입니다.

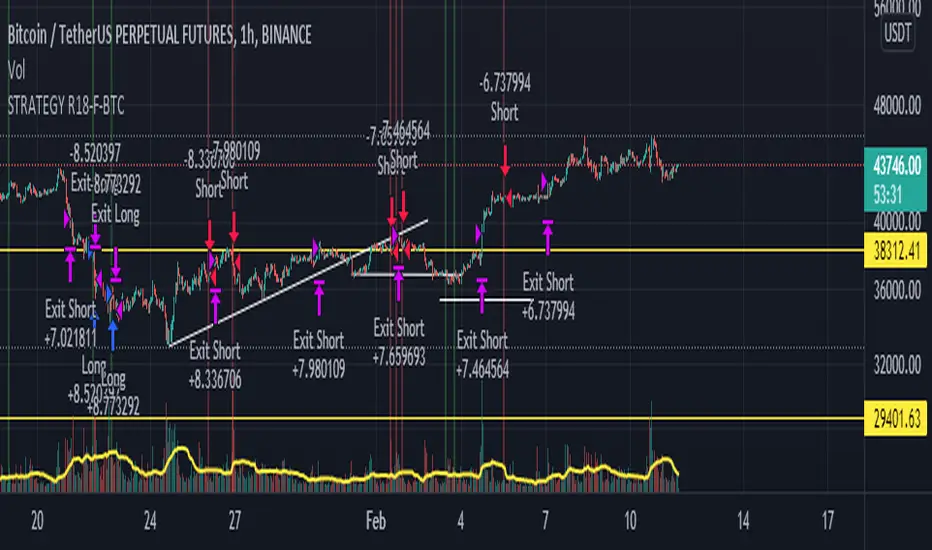
STRATEGY R18-F-BTCHi, I'm @SenatorVonShaft
Just finished the strategy "STRATEGY R18-F-BTC" for trading on #bitcoin and other cryptocurrencies.
As any strategy on TradingView, R18 opens Long/Short positions (with no leverage) on certain price points for assets in the chart. But I intentionally make this strategy for Bitcoin . Strategy is effective with 1h chart and it has %36 winning trade ratio for #bitcoin trade. As strategy uses approximately 1/3 ratio of SL/TP levels, gross profit for 1 year backtest is above %200 (I mean above 3x for only BTC )
Strategy is built on combination of:
- MACD
- RSI
- FIBONACCI levels
- BTCUSDT price itself as indicator (for different crypto assets and BTCUSDTPERP trading. You can select different assets you like for indicator (it's BTCUSDT:Binance by default))
I fine-tuned all levels of indicators above accordingly (it has more than 10 variables that effects strategy itself).
You can find out your own strategy levels by adjusting long/short tp&sl variables as well as initial capital ratio variable.
Reverse option open reverse positions of the strategy
Abz BTC InvestorInvestor indicator:
This indicator is intended to be used on a chart showing Bitcoin's historical price action. By viewing years of Bitcoin's history, it's possible to better see Bitcoin's current price within a long term context of the price rage.
Purpose and possible usage:
I built the indicator to make it easier for me and for friends and family to make better informed decisions about our Bitcoin investments. The indicator shows the historic range of the asset and indicates where Bitcoin is oversold (below the bottom line) and overbought (above the top purple line):
- Above the top purple line, I'll look to take some profits or consider hedging to protect my long term position's growth
- Below the bottom purple line, I'll look to dollar cost average into a long term position
I think the idea for this came from idea listening to the YouTuber Birb talking about how well Bitcoin tracked between the 200 day moving average (bottom navy moving average) and 5x that value (top moving average).
Hope you find it useful.
Best wishes,
Abzorba