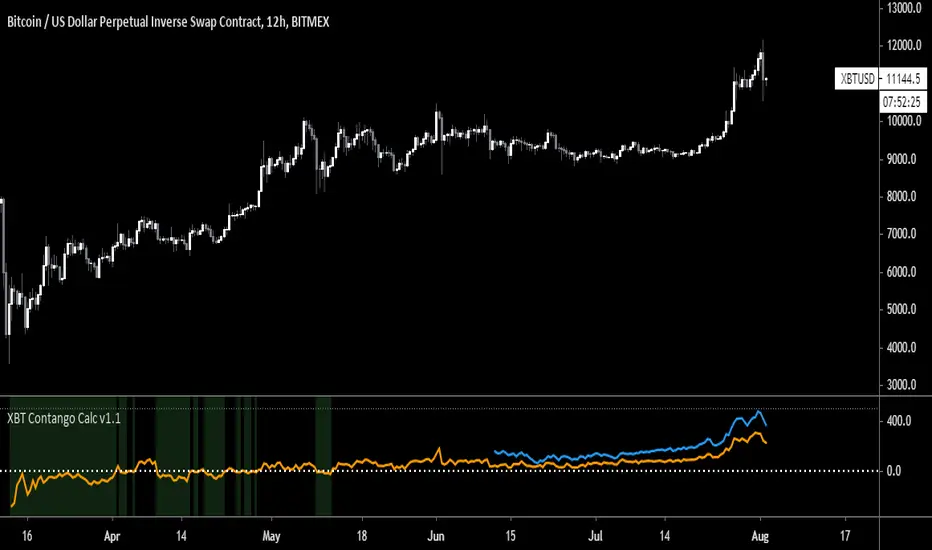
XBT Contango Calculator v1.1
This indicator measures value of basis (or spread) of current Futures contracts compared to spot. The default settings are specifically for Bitmex XBTU19 and XBTZ19 futures contracts. These will need to be updated after expiration. Also, it seems that Tradingview does not keep charts of expired contracts. If anyone knows how to import data from previous expired contracts, please let me know. This historical data could be valuable for evaluating previous XBT futures curves.
Also, VERY important to understand is this indicator only works with Spot Bitcoin charts (XBTUSD, BTCUSD, etc). If you add this to any other asset chart, it would not be useful (unless you changed settings to evaluate a different Futures product).
Contango and Backwardation are important fundamental indicators to keep track of while trading Futures markets. For a better explanation, Ugly Old Goat had done several medium articles on this. Please check out link below for his latest article on the subject...
uglyoldgoat.com
Notes on chart above should explain most of what you need to know on to use this indicator. The zero line is the spot price on the chart, so a positive value means Futures are trading at a premium (or in Contango). You can set a value of extreme Contango which will give an alert as red background (default setting is +$500). Green background will appear when Futures are trading at a discount to spot (Backwardation).
Hope some people get some use out of this. This is my first attempt at coding anything, so any feedback would be greatly appreciated!
BTC Donations: 3CypEdvBcvVHbqzHUt1FDiUG53U7pYWviV
"bitcoin"に関するスクリプトを検索
NVT (original) - Network Value to TransactionsI'm reposting the NVT indicator that was originally available for public use in TradingView.
NVT Signal is a Bitcoin-specific study to get a view on data flowing through the blockchain.
It has been used to predict tops in Bitcoin price.
I've set up this indicator for it to be possible to base the calculations on custom:
Transaction Periods
Overbought levels
Oversold levels
The indicator plots in any BTCUSD spot, futures, BLX index and BTCEUR.
It paints in intraday time frames, but Daily time frame is the correct one to interpret the 'official' read of it.
For that reason, I've enabled by default an option that forces the NVT to display the Daily value even though the time frame could be higher or lower.
Please consider unchecking this setting if you'd like to experiment with another type of reads (i.e. in weekly time frame).
Additionally, it allows the following settings:
Signal Line Plot . Added the possibility to plot a Signal Line based on EMA.
Signal Line Cross . Show/Hide Crosses with the Signal Line.
Alerts based on Signal Line . Predefined Tradingview Alerts on the Cross of the Signal Line.
OverBought Background . Highlight the background based on OB Condition.
OverBought Alert . Predefined Tradingview Alerts based on OB Condition.
OverSold Background . Highlight the background based on OS Condition.
OverSold Alert . Predefined Tradingview Alerts based on OS Condition.
Please check our blog article showing multiple practical ideas about trading the NVT indicator: medium.com
Credit for this idea goes to Willy Woo woobull.com
and Dmitry Kalichkin twitter.com

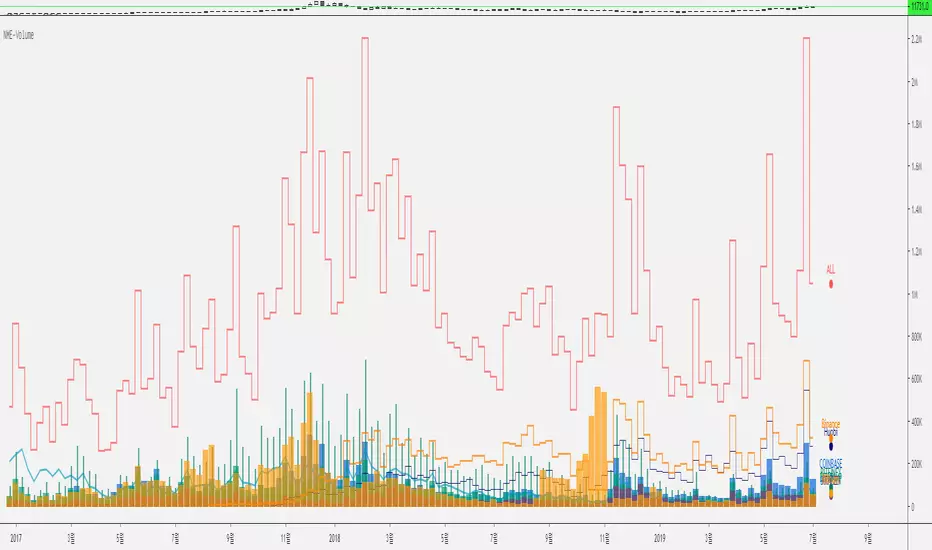
Nexgen Multi-Exchange-Volume V 1.0 by rEPLAYEr1. Hello, Everyone.
2. This is a very simple indicator that sums up the Bitcoin's total trading volume of the major exchanges such as Bitfinex, Binance, Huobi Global, Bitstamp, Kraken, Coinbase, and Bitflyer.
3. This indicator was created to comprehend the fluctuation of the overall market volume.
4. We did not add the BITMEX because it uses leverage-weighted volume and thus is quite different from the actual volume indicator used by other exchanges.
5. It automatically sums up the volumes according to the various time frame.
6. It may be difficult to see the indicator by default setup, so you can customize the display to your aesthetic point of view.
7. We will continue to update to help you find the overall volume flow.
8. Thank you and we wish your succesful investment.
===============================================================
皆さん、こんにちは。
これは非常に単純な指標であり、主要取引所のビットコインの量を合計したものです。
この指標は、Bitfinex、Binance、Huobi Global、Bitstamp、Kraken、Coinbase、Bitflyerなどのいくつかの有名な取引所の取引量の合計であり、市場全体の取引量の変動を調べるために作成されました。
BITMAXを追加しませんでした。 BITMEXの量はレバレッジ加重量であるため、実際の量とは異なります。
タイムゾーンと連動して自動的に変更することができます。
デフォルト設定ではインジケータを見るのが難しい場合があるので、美的観点に合わせて表示をカスタマイズできます。
私達はあなたが全体のボリュームフローを見つけるのを助けるために更新し続けるでしょう。
ありがとうございます。私たちはあなたの成功した投資を願っています。
================================================================
안녕하세요.
넥스젠의 투더문입니다. 저희 훌륭한 개발자인 RE님을 갈아서 또 매우 심플하고 간단하지만 비트코인 거래에 도움이 되는 지표를 만들었습니다.
이 지표는 매우 간단한 볼륨지표로서 주요 거래소의 볼륨을 합산한 것입니다.
비트파이넥스, 바이낸스, 후오비 글로벌(후오비코리아 아님), 크라켄, 코인베이스, 비트플라이어 그리고 빗썸에서 거래되는 BTC의 거래량을 합산한 것입니다.
비트맥스의 경우에는 레버리지가 가중되기 때문에 정확한 거래량으로 보기 어려워 비트맥스는 제외했습니다.
타임프레임을 옮겨가면 해당 타임프레임에 맞게 자동으로 조절되게 해뒀습니다.
디폴트 설정은 그 나름 최대한 보기 좋게 꾸며뒀지만, 불필요한 거래소도 있을 것이고, 본인의 심미적 관점에 따라 보게 꾸밀 수 있게 옵션이 제공됩니다.
감사합니다. 여러분의 성투를 기원합니다.
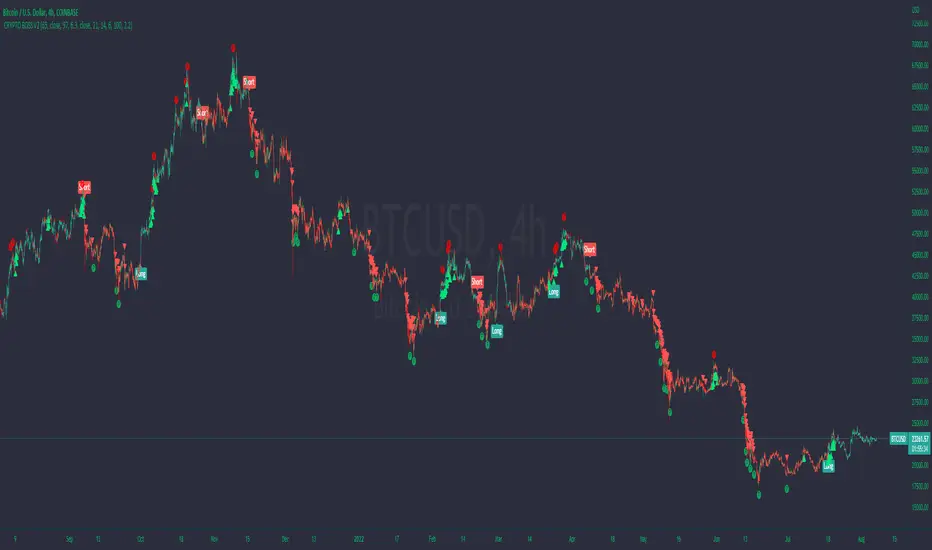
BOSS| Trade Like A Bitcoin and Ethereum WhaleTHE BEST BITCOIN AND ETHEREUM INDICATOR FOR TRADINGVIEW.COM
Quantum Technology – You won’t find any other indicator out there that predicts the probability of the next candle being bullish or bearish .
No Lag, No delay, No repaint!
Quality of Signals – The new Boss Quantum allows you to be in control of the outcome probability. Higher accuracy!
Buy/Long on Long Signal
Sell/Short on Short Signal
SET ALERTS TO ONCE PER BAR CLOSE
//////////////////////////////////////////////////////////////////////
Breakouts, Profit Points, and ReEntry's
This indicator will alert you of when to take profits, when to reenter a trade, and when a breakout occurs.
TAKING PROFITS
When in a long position take long profits on teal circle which, will be above candle.
When in a short position take short profits on purple circle which, will be below candle.
I typically exit 25-50% of position and reenter 25-50% on next candle.
If a Long or Short signal on BOSS quantum is still present the long or short trade is still active.
ReENTRY's
Long ReEntry's
If in a long position and a purple circle appears below candle this indicates a great place to either reenter trade or add more to position.
If a green triangle appears below candle you can either reenter or add more to long position as this signifies a long breakout/ strong upward movement.
Short ReEntry's
If in a short position and a teal circle appears above candle this indicates a great place to either reenter trade or add more to position.
If a red triangle appears below candle you can either reenter short or add more to short position as this signifies a short breakout/ strong downward movement.
Breakout's
Green Triangle
If a green triangle appears below candle you can either reenter or add more to long position as this signifies a long breakout/ strong upward movement.
Red Triangle
If a red triangle appears above candle you can either reenter short or add more to short position as this signifies a short breakout/ strong downward movement.
SET ALERTS TO ONCE PER BAR
Available At: Bosscripts.com
Bitmex Dollar Value CalculatorWith this indicator you can easily calculate either the bitcoin value of a certain amount of dollars or the dollar value of your bitcoin (particularly helpful when trading on bitmex)
Tipjar : 38uGQJDDZDL6wX48x4gYTccPeQ3ZHVYmY4 (btc)

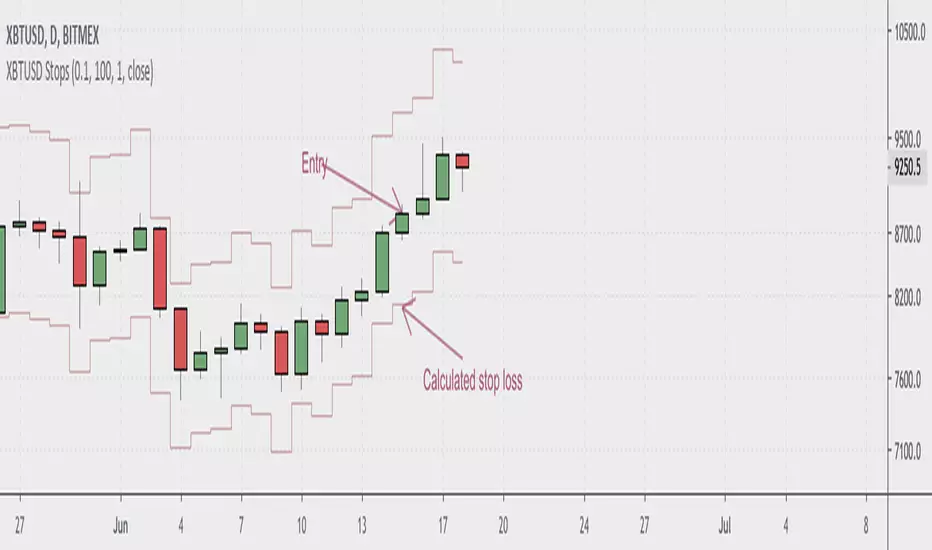
BitMex XBTUSD StopLossShows you where to place your stop loss when trading the Bitcoin swap and futures contracts on BitMex. Enter your account size, position size, and desired risk per trade in the indicator settings. If stop seems too tight, use a smaller position size. Most seamlessly used with cross leverage on BitMex. Make sure to keep an eye on the liquidation level for your trades.
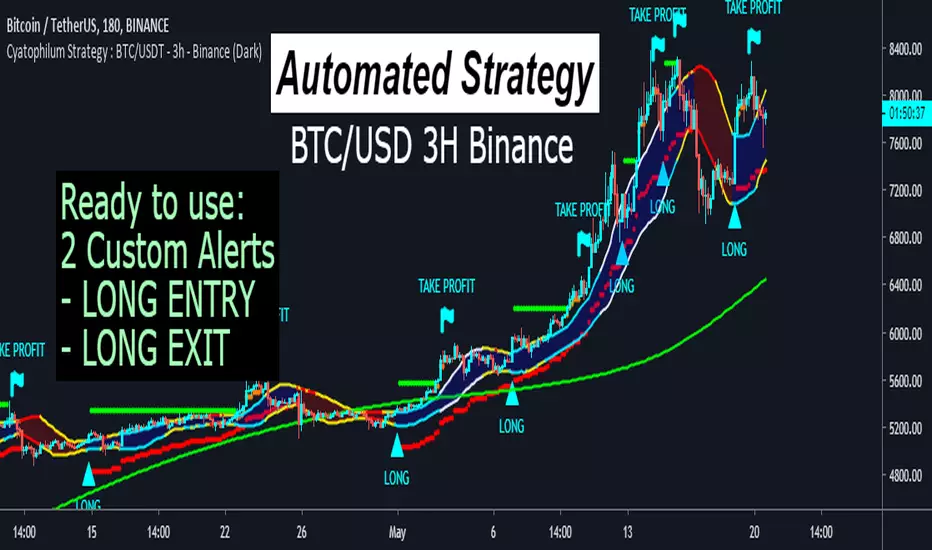
Automated Bitcoin Binance Strategy - RIP HODLERSBuilt upon my latest script
Already configured for BINANCE:BTCUSDT in 3H timeframe.
Backtest results below using 100% equity of 10 000$, 0.05% commission, and only buy and sell trades.
Leave a comment to get your trial
or
Get the indicator today !
Altcoin Profitability Tracker 2Ever wonder which altcoins are performing better than Bitcoin? This script plots the profitability of 15 altcoins and BTCUSD so you can quickly determine where to invest your money.

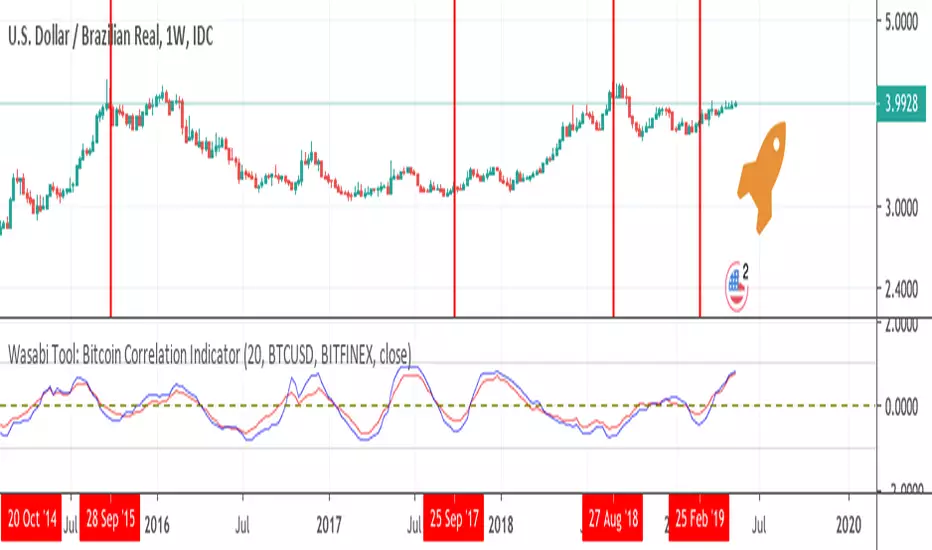
Wasabi Tool: Bitcoin Correlation IndicatorWasabi Tool: Bitcoin Correlation Indicator
This indicator shows Kendall's correlation in red and Pearson's correlation in blue.
* How to use:
As the value is getting near +1, a positive correlation gets stronger.
On the other hand, as the value is getting near -1, a negative correlation gets stronger.
---
Wasabi Tool: Bitcoin Correlation Indicator(Wasabi 전.나.구. 분석툴: 비트코인 상관관계(correlation) 지표) 는
켄달(Kendall) 와 피어선(Pearson) 상관관계 분석을 사용한 비트코인과의 상관관계(correlation)를 지표로 표시합니다.
* 선 의미:
빨간선: 켄달 계수
파산선: 피어선 계수
* 해석:
계수가 1에 가까울수록 양의 상관관계가 강하고
계수가 -1에 가까울수록 음의 상관관계가 강하다.
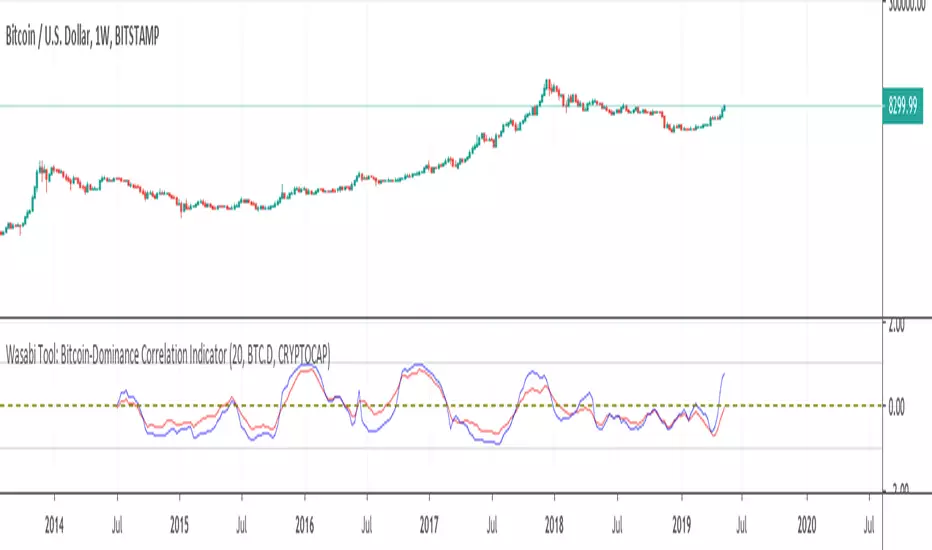
Wasabi Tool: Bitcoin-Dominance Correlation IndicatorWasabi Tool: Bitcoin-Dominance Correlation Indicator
This indicator shows Kendall's correlation in red and Pearson correlation in blue.
* How to use:
As the line is getting near +1, a positive correlation gets stronger.
On the other hand, as the line is getting near -1, a negative correlation gets stronger.
---
Wasabi Tool: Bitcoin-Dominance Correlation Indicator(Wasabi 전.나.구. 분석툴: 비트코인 도미넌스-상관관계(correlation) 지표) 는
켄달(Kendall) 와 피어선(Pearson) 상관관계 분석을 사용한 비트코인과의 상관관계(correlation)를 지표로 표시합니다.
* 선 의미:
빨간선: 켄달 계수
파산선: 피어선 계수
* 해석:
계수가 1에 가까울수록 양의 상관관계가 강하고
계수가 -1에 가까울수록 음의 상관관계가 강하다.
🔗 Blockchain Fundamentals - Thermocap by Cryptorhythms🔗 Blockchain Fundamentals - Thermocap (Marketcap Alternative) by Cryptorhythms
Description
Market capitalization is an indicator for assessing the value of equity in companies. Crypto has inherited the metric from stocks and is having a hard time trying to get rid of it. Problems here are:
Market Cap takes into account all coins distributed so far, not distinguishing lost coins within the circulating supply (or coins intended to be hodled for long periods).
The point is: if a cryptocurrency has a market cap of $1 billion, it doesn’t mean that $1 billion has flown into that asset. One can create a billion coins; sell 2 of them for $2; and thus pump into CoinMarketCap an excess of $999.999.998 in relation to the actual amount that asset has been traded for.
A more appropriate measure of network value was recently put forth by Nic Carter. Remember capital flows in crypto generally do not come in via exchanges (miners notably like to sell OTC). Every buy in an exchange is matched by a sell. Money that comes in = money that goes out.
True inflows (in Bitcoin, at least) are the aggregate of resources spent by miners. And a good proxy for that is the amount these folks are earning back from networks they support in return for their investments. That’s aggregate security spend (or Thermocap): what was actually paid out to miners (coinbase transactions * their price in USD at the time they were mined).
What does it portray?
A more effective measure of wealth in illiquid markets. How much the network has been worth to its maintainers, in cash flows.

Anytime Plot 100EMA/1h for Bitcoin [akubi] Ver.2 常時1時間足100EMAを表示常時1時間足100EMAを表示してくれるインジケーターです。
仮想通貨、特にBTCペアの通貨は1時間の100EMAがレジスタンス&サポートとして意識されています。
仮想通貨をされる方は常時出しておきたいインジケーターの一つだと思います。
===============
以前あったものの改良版です。
・名称の変更
・合成シンボルにも対応
ということで、新規で投稿します。
===============

BTC exchange trade vol / on-chain transaction volThis Bitcoin indicator shows the percentage that the exchange traded volume is from the sum of the exchange traded volume + on-chain transaction volume.
The thin red line is the non-smoothed value calculated from daily volumes.
The thick black line is the 7-day EMA-smoothed value.
The exchange traded volume and the on-chain transaction volume are reported by Quandl and have a 1D resolution - so it is best to use this indicator on the daily time frame.
When the value is high, it shows the the interest of traders is high and they are intensely trading BTC. When the indicator is low, it means that BTC is "dormant": it is used for transfers, but not so much for trading - traders forgot about it for a while - which may be a good time to accumulate if the economy is in a general bull market.

Moving Average 300 by WM - Bitcoin reversal key ?Bonjour à tous, c'est un grand plaisir que nous ajoutons le MA 300 à votre boîte à outils ce qui à mon avis pourrait constituer un support essentiel pour la tendance BTC dans un proche avenir. Nous pensons qu'il serait possible que le Bitcoin puisse mettre un terme à la tendance baissière en l'effleurant :-) Historiquement le Bitcoin n'a jamais descendu sous la barre du MA 200. Je vous souhaite de connaître beaucoup de succès lors de vos prochaines transactions et n'oubliez pas la tendance est votre amis!! Crypto Mercy xx
WM
We are movement

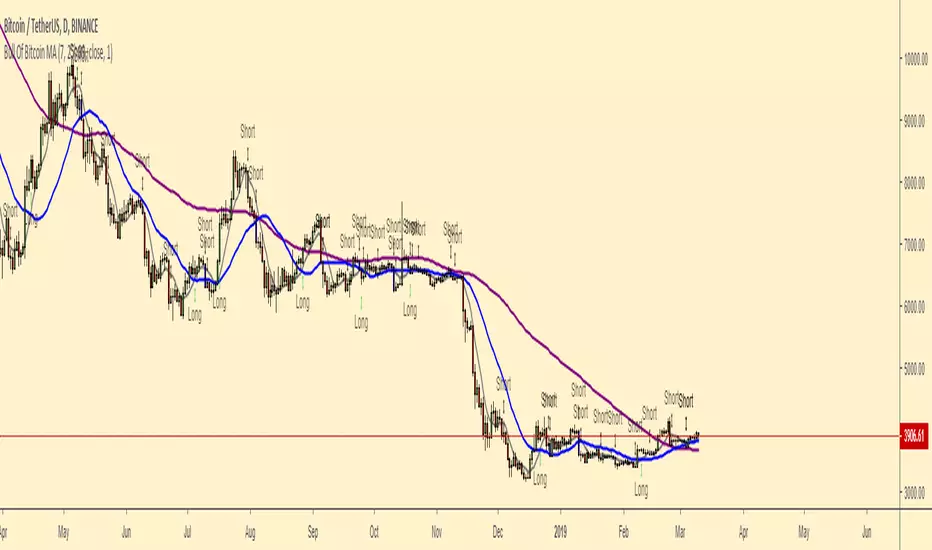
Bull Of Bitcoin MABullOfBitcoin MA
From studies conducted by Bull Of Bitcoin
Coding performed by GM_Hedge_Fund
The study is focused on the interactions of the candles with the 7 and 25 Moving Averages.
The script:
Plots 7 (grey), 25 (blue) and 99 (purple) MA on the chart in overlay
Signals a possible Long Entry when the 7MA crosses the 25MA
Signals a possible Short Sell when the second candle that closes under the 7MA
Signals a possible Short Sell (stronger than the previous one) when the first candle that closes under the 25 MA
Suggestions:
The script is meant to be displayed on a naked chart (no other indicators) with light background to facilitate the reading.
The script is complete with alarms and notifications that can be enabled with the button alarm on the right toolbar.
---------------------------------------------------------------------------------------------------------------------------------------------
If you enjoy please consider to support BullOfBitcoin by joining his Telegram, Twitter and Simon following on Twitter, TradingView and by sharing their script.
Twitter
@Bull0fBitcoin
@simonbakercryto
TradingView
@GM_Hedge_Fund
Major Mayer MultipleAdjusted version of the BTC Mayer Multiple developed by Trace Mayer www.theinvestorspodcast.com
This version includes two novelties. The first one replaces BTC with Total Market Cap from 2016/2017 (depending on your moving averages) to present and the second is that we consider two Moving Averages to produce more detailed lows.

Bull Of Bitcoin - MA's [CP]This is a custom script for Bull Of Bitcoin and gives you the ability to set alerts for the following events:
*1st Bullish Cross
*2nd Bullish Cross
*Bullish Bounce
*1st Bearish Cross
*2nd Bearish Cross
*Bearish Bounce

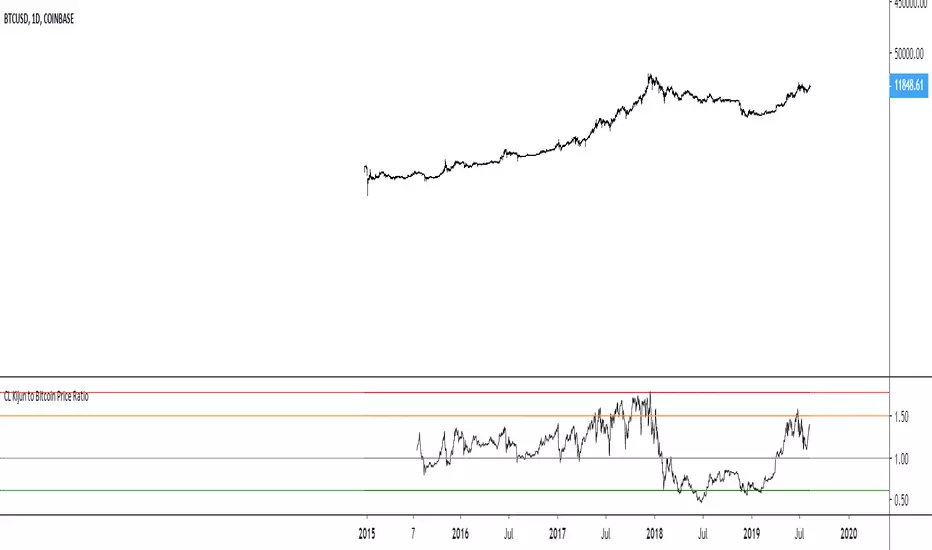
Mining Cash Flow LineTakes QUANDL Bitcoin blockchain difficulty data, three variables (hashrate in THs/sec, power consumption in kWh, and electricity costs in cents/kWh) and calculates the base line for cash flow in US dollars. The default is an AntMiner S15 at 10 cents/kWh.
When price is above this line, miners with the given conditions have positive cash flow (i.e. they make more money mining than their running costs), and when below the line, they would be better off turning their rigs off (if this simple model can be applied to their particular circumstance).
Assumptions:
1. All costs are consolidated into one "electricity cost" variable, including things like rent and wages for mining farms.
2. 12.5 BTC/block emission schedule (update source code upon next halving).
Warnings:
It is likely that actual costs to miners varies in complex ways. This indicator only shows a cash flow calculation for a very simple set of parameters that will generally apply to miners, but not necessarily all of them. (For example, a miner may be locked into a prepaid contract for cheap electricity, or sell exhaust heat in the winter for extra revenue.)
Positive cash flow is also different from ROI, as this model does not take into account the cost of acquiring an ASIC mining rig.

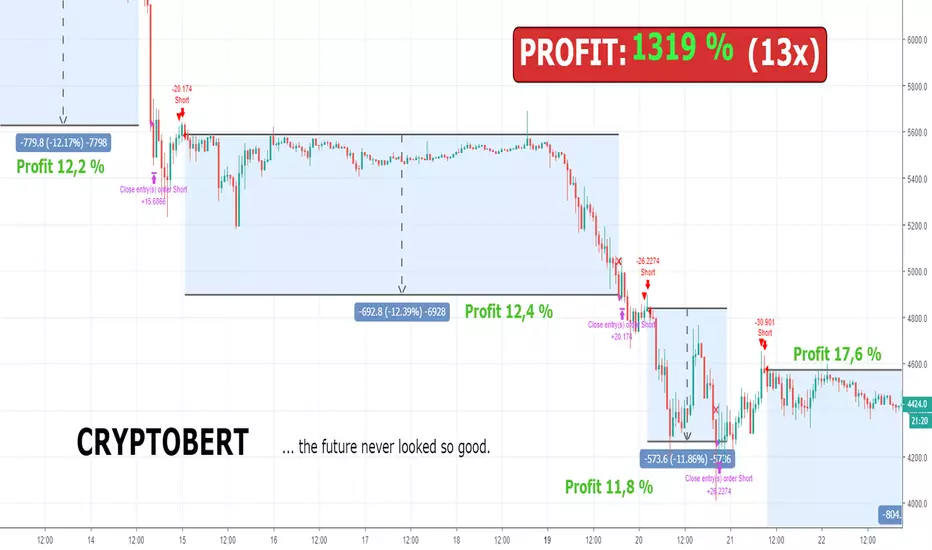
Bert LONG BTC Study (Alerts) - Profit 2018: 1319 % (no leverage)Bert LONG Term BTC study (BITMEX) - script for setting alerts and trading bots
This is a revolutionary strategy for bitcoin (XBT) trading. The strategy is perfectly configured for trading on the Bitmex exchange. No further configuration and setup is required.
The strategy itself recognizes a volatile period or whether the market is in downtrend, uptrend or sideways. Accordingly, it applies the appropriate orders to reach maximum profit.
The strategy can be handled manually, you can receive alerts (popup, email, sms) or can be fully automated by bot (works with: Autoview, Gunbot, Profitview, Jubot and others) without any manual intervention.
What is the minimum and maximum capital I can trade with?
You can trade with 0.0001BTC – 1000BTC. That is one of many advantages of using this strategy on XBT. There is enough liquidity to execute the order for the market price with a big investment amount.
What is the recommended setting?
Timeframe: 45m
Chart: Bitcoin/USD Dollar Perpetual Inverse Swap Contract (XBT)
Leverage: 2x
Orders: Long and Shorts
Why was this strategy created?
You have basically two option how to make money in crypto market. HODL (buy the coin and believe it will rise to the moon) and TRADING (only 3-5% traders are profitable, most of them are full time traders with 5+ years of experience in trading).
If you HODL btc in this year, you are -70 % this year
If you are TRADING, the results depend on how good you are (think about this, if you decide to be a heart surgeon, rocket star or NBA player, do you think you can be? Yes, you can but the chances are very small. The same probability you have that you will be in the 3-5% profitable traders 😊). It takes time, you need experience and still 96% all of you will never be a profitable traders!
If you use Bert BTC long term strategy, you are + 1319 % this year
How well the Bert BTC strategy performs?
Profit in 2018 was 1319 % / 13x (without leverage)
Profit in 2018 was 11 477 % / 115x (with leverage 2)
If you invested (with leverage 2) 1 000 USD you have now 114 766 USD
If you invested (with leverage 2) 10 000 USD you have now 1 147 660 USD
Detailed trades report for 2018 (you can calculate your own profit with specific investments and leverage) – download excel here
Notes:
You will hardly find better strategy on the market which achieves similar results with minimal risk and can operate in any market condition (downtrend, uptrend, sideways).
We guarantee the strategy does not repaint, and we use real candles (not heikin ashi or renko which does not reflect real prices).
We wish you to become financially independent and all your secret wishes to be fulfilled.
And in case if you still want to HODL or you want to be TRADING all the days watching to your monitors, consider to try our strategy at least with a minimum capital invested, you will see that you will not regret in long run. Be patient and the money will come to you!
For access to this strategy visit website: www.cryptobert.io
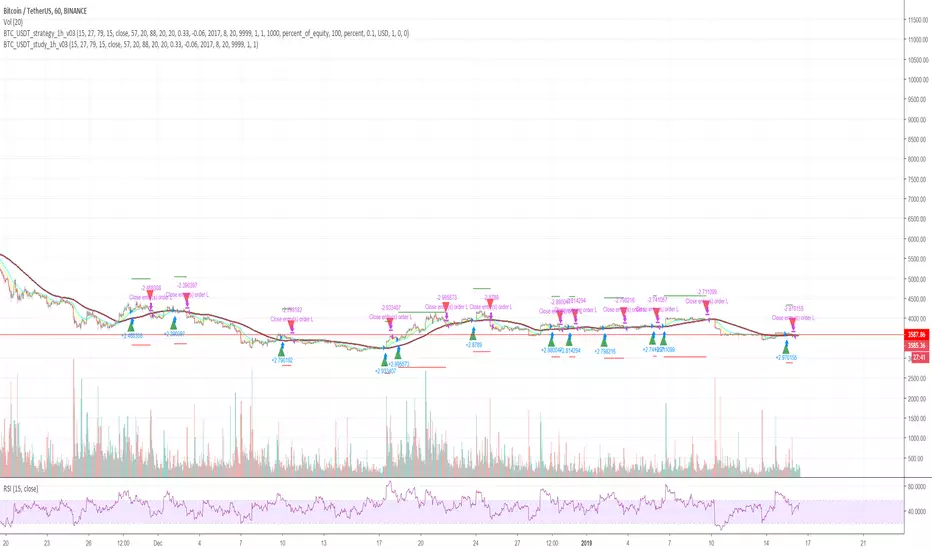
Cryptocurrency trend following LONG only studyThis strategy uses multiple indicators to find optimal time to enter/exit the trade. The default setting is mainly for trading bitcoin/stable coin pair such as USDT etc on 1h timeframe but it can be applied to any pair/any timeframe with some settings adjustments.
Strategy settings description:
ID Name Descrption
1 FastMA - Value for fast exponencial moving average
2 SlowEMA - Value for slow exponencial moving average
3 SMA - Value for simple moving average
4 RSI Length - Length of RSI identificator
5 RSI Source candle - What price of candle is used for RSI calculation (open, close, high, low)
6 RSI Long condition - When buy, RSI indicator must be below this value to prevent of buying already overbought coin
7 RSI Short condition - When sell, RSI indicator must be above this value to prevent of selling already oversold coin
8 RSI close trade condition - Sell once RSI indicator acquires defined value
9 Take Profit (%) - Take profit value in percent
10 Stop Loss (%) - Stop loss value in percent
11 Long price toleration (%) - Price deviation for filtering bounces of simple moving average - price must close defined percents above SMA to open long trade
12 Short price toleration (%) - Price deviation for filtering bounces of simple moving average - price must close defined percents bellow SMA to close long trade
13 From Year - To run strategy in interval
14 From Month - To run strategy in interval
15 From Day - To run strategy in interval
16 To Year - To run strategy in interval
17 To Month - To run strategy in interval
18 To Day - To run strategy in interval
19 Show every signal? - (Study only) Unchecked shows only first signal based on strategy. But if you use take profit/stoploss settings within your bot, you might want to rebuy on next signal. Checked shows signal on each candle.
Notice that there are also false signals, especially when the coin is not trending or is strongly manipulated. Overall strategy is profitable though. You just take some minor loses and wont miss the big move.
You may also consider to compare buy&hold return vs profit from trading this strategy. In downtrend as we have seen recently, profit may not be as high as you expect but it is still much better than just hold and hope.
You can use the strategy script for fine tunning settings and find best settings for yourself
Study script helps you to automate trading with use of alerts perharps with 3commas bot or even trade manually based on email/sms notification setted by tradingview
Make sure that you keep same settings for strategy and study scripts.
If you need any help with settings do not hesitate to ask. I would also appriciate any feedback and ideas how to improve this script.
Here is backtest result from 23.08.2017:
Aggregated Volume BTCAggregates the Bitcoin volume from multiple exchanges into a single indicator.
# Exchanges and Pairs
Included are only exchanges supported by TradingView:
* Binance
* Bitstamp
* Bittrex
* Coinbase
* Gemini
* itBit
* Bitfinex
* Kraken
* Poloniex
* HitBTC
* OKCoin
* BitMEX
Excluded low volume exchanges (not in CMC Top):
* CEX.IO
* Coinfloor
Excluded low volume pairs (not in CMC Top):
* KRAKEN:XBTCAD, COINBASE:BTCUSDC, ITBIT:BTCEUR, ITBIT:BTCSGD, BITFINEX:BTCJPY, BITFINEX:BTCGBP, POLONIEX:BTCUSDC, OKCOIN:BTCUSD, OKCOIN:BTCCNY
Many other top exchanges are not included, because they are not supported by TradingView.
# Inputs
By default the spot exchanges are selected. You can select also the other margin trading and derivatives exchanges.
# Contribute
Feel free to share any ideas and issues you have.
# Open Source
The code is open source @ github.com and uses the commonpine library github.com

Real Volume BTCStudy based and adjusted in real Bitcoin volume. It shows important areas of great activity that will help you make better decisions.
This indicator also shows complete cycles of price action based on volume.
In combination with other indicators, it becomes a powerful tool.
