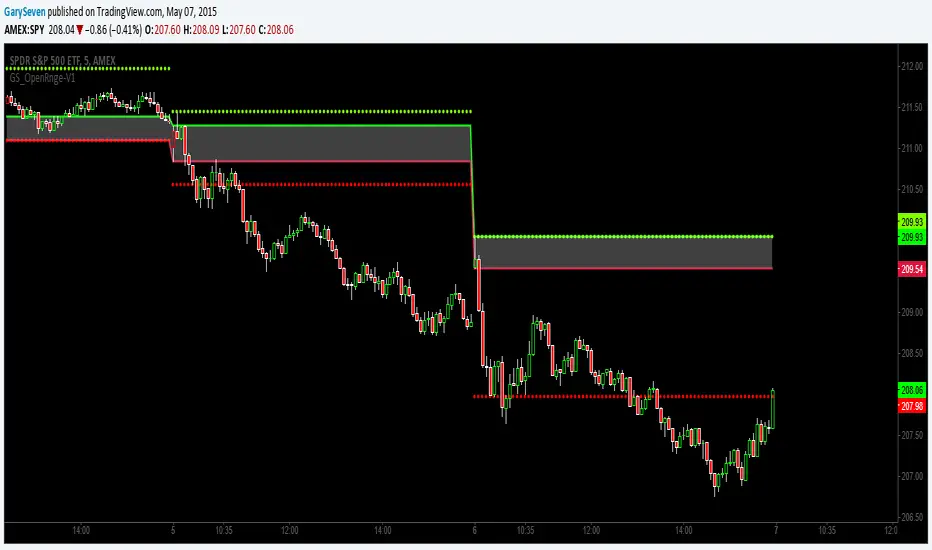
GS_Opening-Range-V1ORB Opening Range Breakout 5 and 3O Minute Indicator
Kudos to Chris Moody for the inspiration to create my first indicator.
The 5 and 30 run together at times but the scalp would be when the equity breaks the 5 go long or short for the scalp and when it breaks the 30 go for the swing trade.
"breakout"に関するスクリプトを検索
Volatility Resonance CandlesVolatility Resonance Candles visualize the dynamic interaction between price acceleration, volatility, and volume energy.
They’re designed to reveal moments when volatility expansion and directional momentum resonate — often preceding strong directional moves or reversals.
🔬 Concept
Traditional candles display direction and range, but they miss the energetic structure of volatility itself.
This indicator introduces a resonance model, where ATR ratio, price acceleration, and volume intensity combine to form a composite signal.
* ATR Resonance: compares short-term vs. long-term volatility
* Acceleration: captures the rate of price change
* Volume Energy: reinforces the move’s significance
When these components align, the candle color “resonates” — brighter, more intense candles signal stronger volatility–momentum coupling.
⚙️ Features
* Adaptive Scaling
Normalizes energy intensity dynamically across a user-defined lookback period, ensuring consistency in changing market conditions.
* Power-Law Transformation
Optional non-linear scaling (gamma) emphasizes higher-energy events while keeping low-intensity noise visually subdued.
* Divergence Mode
When enabled, colors can invert to highlight energy divergence from candle direction (e.g., bearish pressure during bullish closes).
* Customizable Styling
Full control over bullish/bearish base colors, transparency scaling, and threshold sensitivity.
🧠 Interpretation
* Bright / High-Intensity Candles → Strong alignment of volatility and directional energy.
Often signals the resonant phase of a move — acceleration backed by volatility expansion and volume participation.
* Dim / Low-Intensity Candles → Energy dispersion or consolidation.
These typically mark quiet zones, pauses, or inefficient volatility.
* Opposite-Colored Candles (if divergence mode on) → Potential inflection zones or hidden stress in the trend structure.
⚠️ Disclaimer
This script is for educational purposes only.
It does not constitute financial advice, and past performance is not indicative of future results. Always do your own research and test strategies before making trading decisions.

Price Compression Scanner (Chartink Logic)Breakout above range high → BUY
🔹 Breakdown below range low → SELL
🔹 Best with volume expansion
🔹 Works well for swing trades & momentum breakouts
Highs
Highest High of last 10 days (ending 1 day agos) < Highest High of previous 10 days
Highest High of last 10 days < Highest High of earlier 10 days
➡️ Lower highs (falling resistance)
Lows
3. Lowest Low of last 10 days > Lowest Low of previous 10 days
4. Lowest Low of last 10 days > Lowest Low of earlier 10 days

ORB 5 Minute w/FVG and Retracement Breakout strategy creates five minute breakout lines on the 1 minute chart. Highlights any fair value gaps created within ORB and creates an arrow showing when a candle retraces into the fvg.

Break out strategy 0Breakout strategy (for verification)
Not recommended.
If you enter with a high (low) breakout for any period
ブレークアウトストラテジー(検証用)
推奨するものではありません。
任意の期間の高値(安値)ブレークアウトでエントリーした場合

Breakout Condition Indicator - Long - V2 - Mega 86Script used for swing trading - contains certain adjustable metrics that I use for scanning and day or entry

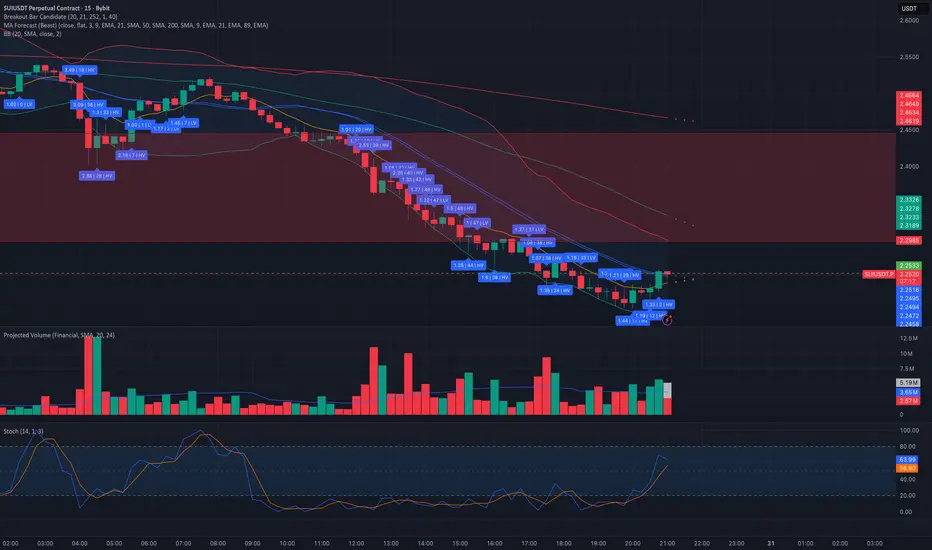
Breakout Bar CandidateShows the values of True Range, LS volatility and whether the volume is above or below average
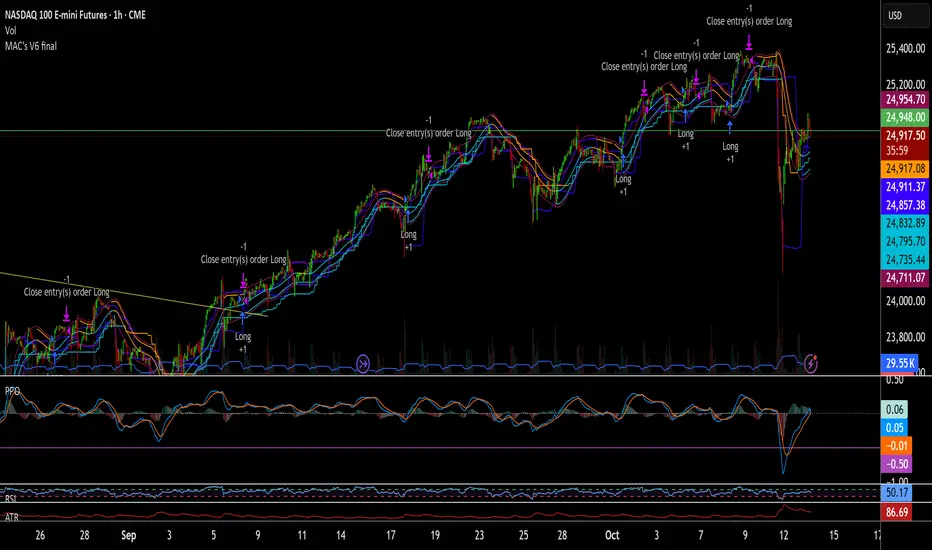
MAC's V6 finalBreakout retest strategy
Works best on a NQ 1 hour chart
Also works on other futures charts
Adjust the initial capital to 100000
and the margin requirement percent to 0
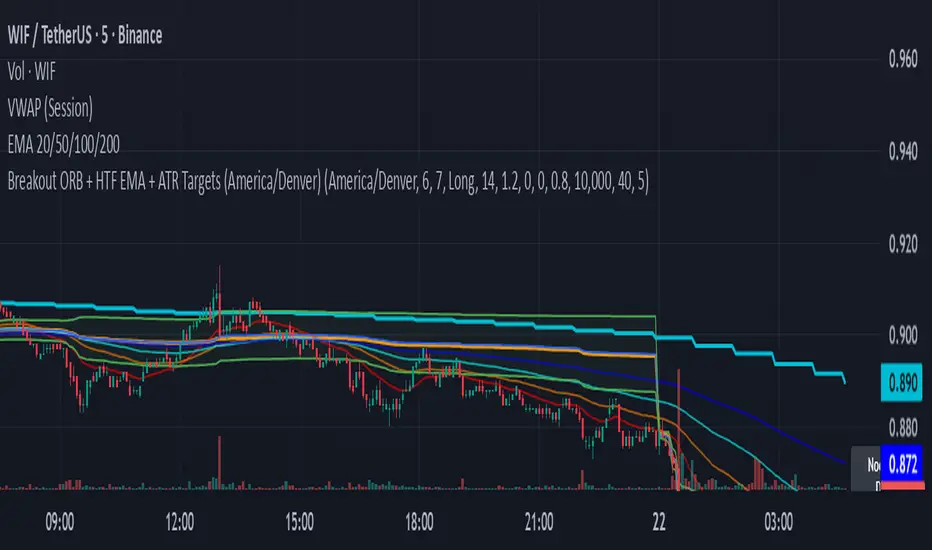
Breakout ORB + HTF EMA + ATR Targets (America/Denver)This is a perfect simple chart for those trading Crypto pairs between the London and US market overlays.
Breakout Retest ScannerStill working on it, but break the previous day high or low, retest and get an alert of some sort.

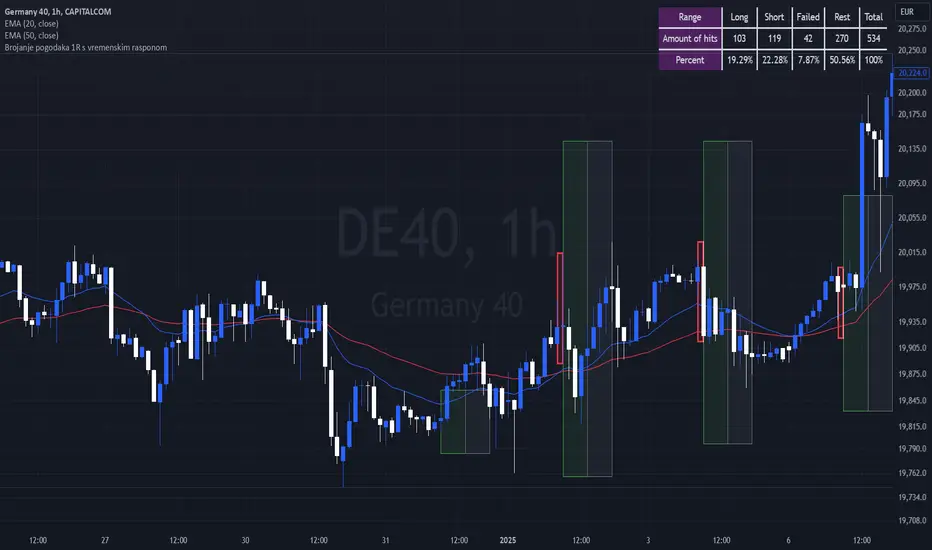
Breakout Josip strategy is focused on analyzing price movements during specific time intervals (from 9:00 AM to 12:00 PM) each day. It tracks the highest and lowest prices in that period and uses them to set targets for potential trades, placing horizontal lines based on these levels. Additionally, you're interested in tracking the success and failure of trades based on whether price breaks certain levels during this time range. The strategy also calculates various metrics like the percentage of successful trades, failed trades, and total trades during a selected time range.
Breakout Candles + RSIHello!
This is my firt script :)
This indicator looks for candles that are significantly larger than the previous X candle.
It is possible to set the following:
Multiplier: deviation from the size of the previous X candle (if set to 3 the size of the actual candle's body /abs(open - close)/ must be larger than the size of the bigger candle from the prevous X candles)
Previous candles: the number of previous candles to size check
Upper RSI limit: if the RSI14 close higher than the specified number, the candle will ignore
Lower RSI limit: if the RSI14 close lower than the specified number, the candle will ignore
Without dojis: if checked, watches candles only that do not have a bottom spike (bullish) or top spike (bearish). Useful for Heikin-Ashi candles
Feel free to left any suggestion!
Thank You!

Breakout Peak Detection - cryptofnqDetect peaks (and valleys) after the indicator has broken out of horizontal bands.
The peaks (and valleys) are connected by lines and the final line is extended to the right.
This can be used with built-in indicator functions or with other chart indicators.
I'm a coder, not a trader. If you find a useful strategy based on my scripts, please drop me a line.

Breakout Volume [racer8]BV determines when volume is high by comparing the previous volume high over n periods to the current volume.
If the current volume exceeds the previous volume high, then the indicator columns will turn red. Enjoy :)
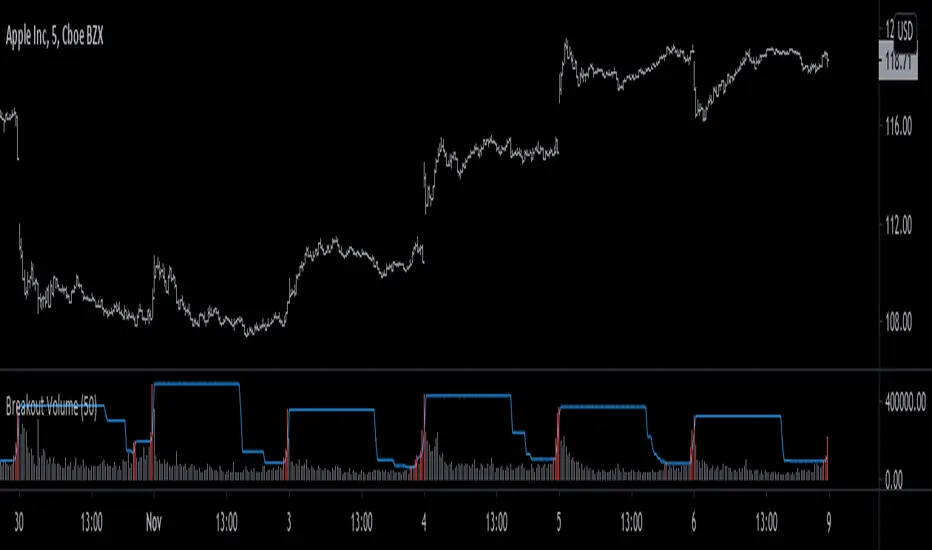
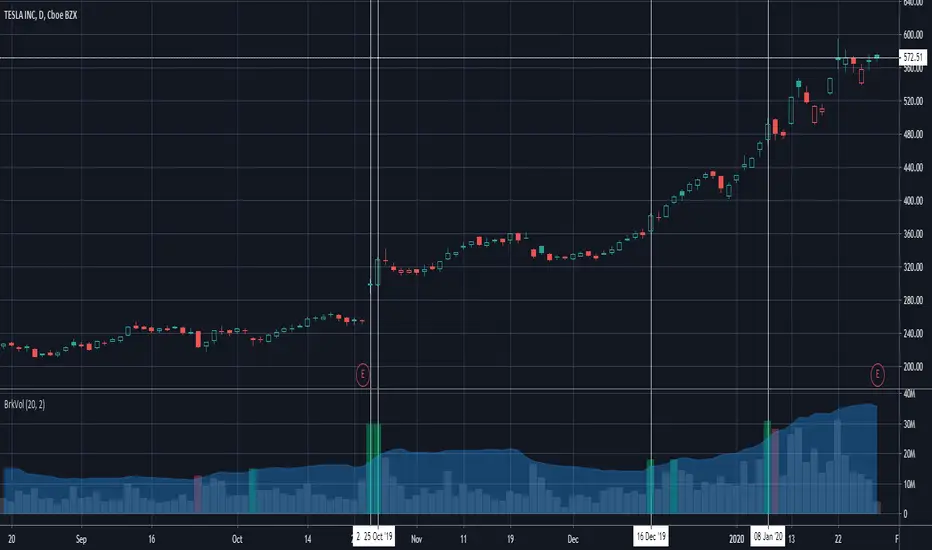
Breakout Volume Can Help Confirm Other SignalsVolume can help confirm signals we might discover using other methods of technical analysis.
This indicator tracks volume intelligently. Its logic spots above-average turnover and then tests against the price change. BrkVol highlights sessions with heavy volume and directional moves. This can help take out the noise and help confirm the trend.
Tesla is a classic example of this, with the stock rallying after showing heavy-volume gains on October 24- 25, December 16 and January 8.
UCS_Ready Set Go2017 - First Code
This is a another way of looking at DMI indicator. Almost similar to any oscillator. You still need to understand the indicator and chart before you can trade with these.
---------------------------------------------------------------------------

Swing IA Cockpit [v2]//@version=5
indicator("Swing IA Cockpit ", overlay=true, max_bars_back=500)
// === INPUTS ===
mode = input.string("Pullback", title="Entry Mode", options= )
corrLen = input.int(60, "Correlation Window Length")
scoreWeightBias = input.float(0.6, title="Weight: Bias", minval=0, maxval=1)
scoreWeightTiming = 1.0 - scoreWeightBias
// === INDICATEURS H1 ===
ema200_H1 = ta.ema(close, 200)
ema50_H1 = ta.ema(close, 50)
rsi_H1 = ta.rsi(close, 14)
donchianHigh = ta.highest(high, 20)
donchianLow = ta.lowest(low, 20)
atr_H1 = ta.atr(14)
avgATR_H1 = ta.sma(atr_H1, 50)
body = math.abs(close - open)
avgBody = ta.sma(body, 20)
// === H4 / D1 ===
close_H4 = request.security(syminfo.tickerid, "240", close)
ema200_H4 = request.security(syminfo.tickerid, "240", ta.ema(close, 200))
rsi_H4 = request.security(syminfo.tickerid, "240", ta.rsi(close, 14))
atr_H4 = request.security(syminfo.tickerid, "240", ta.atr(14))
avgATR_H4 = request.security(syminfo.tickerid, "240", ta.sma(ta.atr(14), 50))
close_D1 = request.security(syminfo.tickerid, "D", close)
ema200_D1 = request.security(syminfo.tickerid, "D", ta.ema(close, 200))
// === CORRÉLATIONS ===
dxy = request.security("TVC:DXY", "60", close)
spx = request.security("SP:SPX", "60", close)
gold = request.security("OANDA:XAUUSD", "60", close)
corrDXY = ta.correlation(close, dxy, corrLen)
corrSPX = ta.correlation(close, spx, corrLen)
corrGold = ta.correlation(close, gold, corrLen)
// === LOGIQUE BIAIS ===
biasLong = close_D1 > ema200_D1 and close_H4 > ema200_H4 and rsi_H4 >= 55
biasShort = close_D1 < ema200_D1 and close_H4 < ema200_H4 and rsi_H4 <= 45
bias = biasLong ? "LONG" : biasShort ? "SHORT" : "NEUTRAL"
// === LOGIQUE TIMING ===
isBreakoutLong = mode == "Breakout" and high > donchianHigh and close > ema200_H1 and rsi_H1 > 50
isBreakoutShort = mode == "Breakout" and low < donchianLow and close < ema200_H1 and rsi_H1 < 50
var float breakoutPrice = na
var int breakoutBar = na
if isBreakoutLong or isBreakoutShort
breakoutPrice := close
breakoutBar := bar_index
validPullbackLong = mode == "Pullback" and not na(breakoutBar) and bar_index <= breakoutBar + 3 and close > ema50_H1 and low <= ema50_H1
validPullbackShort = mode == "Pullback" and not na(breakoutBar) and bar_index <= breakoutBar + 3 and close < ema50_H1 and high >= ema50_H1
timingLong = isBreakoutLong or validPullbackLong
timingShort = isBreakoutShort or validPullbackShort
// === SCORES ===
scoreTrend = (close_D1 > ema200_D1 ? 20 : 0) + (close_H4 > ema200_H4 ? 20 : 0)
scoreMomentumBias = (rsi_H4 >= 55 or rsi_H4 <= 45) ? 20 : 10
scoreCorr = 0
scoreCorr += biasLong and corrDXY < 0 ? 10 : 0
scoreCorr += biasLong and corrSPX > 0 ? 10 : 0
scoreCorr += biasLong and corrGold >= 0 ? 10 : 0
scoreCorr += biasShort and corrDXY > 0 ? 10 : 0
scoreCorr += biasShort and corrSPX < 0 ? 10 : 0
scoreCorr += biasShort and corrGold <= 0 ? 10 : 0
scoreCorr := math.min(scoreCorr, 30)
scoreVolBias = atr_H4 > avgATR_H4 ? 10 : 0
scoreBias = scoreTrend + scoreMomentumBias + scoreCorr + scoreVolBias
scoreStruct = (timingLong or timingShort) ? 40 : 0
scoreMomentumTiming = rsi_H1 > 50 or rsi_H1 < 50 ? 25 : 10
scoreTrendH1 = (close > ema50_H1 and ema50_H1 > ema200_H1) or (close < ema50_H1 and ema50_H1 < ema200_H1) ? 20 : 10
scoreVolTiming = atr_H1 > avgATR_H1 ? 15 : 5
scoreTiming = scoreStruct + scoreMomentumTiming + scoreTrendH1 + scoreVolTiming
scoreTotal = scoreBias * scoreWeightBias + scoreTiming * scoreWeightTiming
scoreLong = biasLong ? scoreTotal : 0
scoreShort = biasShort ? scoreTotal : 0
delta = scoreLong - scoreShort
scoreExtMomentum = (rsi_H4 > 55 ? 10 : 0)
scoreExtVol = atr_H4 > avgATR_H4 ? 10 : 0
scoreExtStructure = body > avgBody ? 10 : 5
scoreExtCorr = (scoreCorr > 15 ? 10 : 5)
scoreExtension = scoreExtMomentum + scoreExtVol + scoreExtStructure + scoreExtCorr
// === VERDICT FINAL ===
verdict = "NO TRADE"
verdict := bias == "NEUTRAL" or math.abs(delta) < 10 or scoreTotal < 70 ? "NO TRADE" :
scoreTotal < 80 ? "WAIT" :
scoreTotal >= 85 and math.abs(delta) >= 20 and scoreExtension >= 60 ? "TRADE A+" :
"TRADE"
// === TABLE COCKPIT ===
var table cockpit = table.new(position.top_right, 2, 9, border_width=1)
if bar_index % 5 == 0
table.cell(cockpit, 0, 0, "Bias", bgcolor=color.gray)
table.cell(cockpit, 1, 0, bias)
table.cell(cockpit, 0, 1, "ScoreBias", bgcolor=color.gray)
table.cell(cockpit, 1, 1, str.tostring(scoreBias))
table.cell(cockpit, 0, 2, "ScoreTiming", bgcolor=color.gray)
table.cell(cockpit, 1, 2, str.tostring(scoreTiming))
table.cell(cockpit, 0, 3, "ScoreTotal", bgcolor=color.gray)
table.cell(cockpit, 1, 3, str.tostring(scoreTotal))
table.cell(cockpit, 0, 4, "ScoreLong", bgcolor=color.gray)
table.cell(cockpit, 1, 4, str.tostring(scoreLong))
table.cell(cockpit, 0, 5, "ScoreShort", bgcolor=color.gray)
table.cell(cockpit, 1, 5, str.tostring(scoreShort))
table.cell(cockpit, 0, 6, "Delta", bgcolor=color.gray)
table.cell(cockpit, 1, 6, str.tostring(delta))
table.cell(cockpit, 0, 7, "Extension", bgcolor=color.gray)
table.cell(cockpit, 1, 7, str.tostring(scoreExtension))
table.cell(cockpit, 0, 8, "Verdict", bgcolor=color.gray)
table.cell(cockpit, 1, 8, verdict, bgcolor=verdict == "TRADE A+" ? color.green : verdict == "TRADE" ? color.lime : verdict == "WAIT" ? color.orange : color.red)
// === ALERTS ===
alertcondition(verdict == "TRADE A+" and bias == "LONG", title="TRADE A+ LONG", message="TRADE A+ signal long")
alertcondition(verdict == "TRADE A+" and bias == "SHORT", title="TRADE A+ SHORT", message="TRADE A+ signal short")
alertcondition(verdict == "NO TRADE", title="NO TRADE / RANGE", message="Marché confus ou neutre — pas de trade")

Cross-Market Regime Scanner [BOSWaves]Cross-Market Regime Scanner - Multi-Asset ADX Positioning with Correlation Network Visualization
Overview
Cross-Market Regime Scanner is a multi-asset regime monitoring system that maps directional strength and trend intensity across correlated instruments through ADX-based coordinate positioning, where asset locations dynamically reflect their current trending versus ranging state and bullish versus bearish bias.
Instead of relying on isolated single-asset trend analysis or static correlation matrices, regime classification, spatial positioning, and intermarket relationship strength are determined through ADX directional movement calculation, percentile-normalized coordinate mapping, and rolling correlation network construction.
This creates dynamic regime boundaries that reflect actual cross-market momentum patterns rather than arbitrary single-instrument levels - visualizing trending assets in right quadrants when ADX strength exceeds thresholds, positioning ranging assets in left quadrants during consolidation, and incorporating correlation web topology to reveal which instruments move together or diverge during regime transitions.
Assets are therefore evaluated relative to ADX-derived regime coordinates and correlation network position rather than conventional isolated technical indicators.
Conceptual Framework
Cross-Market Regime Scanner is founded on the principle that meaningful market insights emerge from simultaneous multi-asset regime awareness rather than sequential single-instrument analysis.
Traditional trend analysis examines assets individually using separate chart windows, which often obscures the broader cross-market regime structure and correlation patterns that drive coordinated moves. This framework replaces isolated-instrument logic with unified spatial positioning informed by actual ADX directional measurements and correlation relationships.
Three core principles guide the design:
Asset positioning should be determined by ADX-based regime coordinates that reflect trending versus ranging state and directional bias simultaneously.
Spatial mapping must normalize ADX values to place assets within consistent quadrant boundaries regardless of instrument volatility characteristics.
Correlation network visualization reveals which assets exhibit coordinated behavior versus divergent regime patterns during market transitions.
This shifts regime analysis from isolated single-chart monitoring into unified multi-asset spatial awareness with correlation context.
Theoretical Foundation
The indicator combines ADX directional movement calculation, coordinate normalization methodology, quadrant-based regime classification, and rolling correlation network construction.
A Wilder's smoothing implementation calculates ADX, +DI, and -DI for each monitored asset using True Range and directional movement components. The ADX value relative to a configurable threshold determines X-axis positioning (ranging versus trending), while the difference between +DI and -DI determines Y-axis positioning (bearish versus bullish). Coordinate normalization caps values within fixed boundaries for consistent quadrant placement. Pairwise correlation calculations over rolling windows populate a network graph where line thickness and opacity reflect correlation strength.
Five internal systems operate in tandem:
Multi-Asset ADX Engine : Computes smoothed ADX, +DI, and -DI values for up to 8 configurable instruments using Wilder's directional movement methodology.
Coordinate Transformation System : Converts ADX strength and directional movement into normalized X/Y coordinates with threshold-relative scaling and boundary capping.
Quadrant Classification Logic : Maps coordinate positions to four distinct regime states—Trending Bullish, Trending Bearish, Ranging Bullish, Ranging Bearish—with color-coded zones.
Historical Trail Rendering : Maintains rolling position history for each asset, drawing gradient-faded trails that visualize recent regime trajectory and velocity.
Correlation Network Calculator : Computes pairwise return correlations across all enabled assets, rendering weighted connection lines in circular web topology with strength-based styling.
This design allows simultaneous cross-market regime awareness rather than reacting sequentially to individual instrument signals.
How It Works
Cross-Market Regime Scanner evaluates markets through a sequence of multi-asset spatial processes:
Data Request Processing : Security function retrieves high, low, and close values for up to 8 configurable symbols with lookahead offset to ensure confirmed bar data.
ADX Calculation Per Asset : True Range computed from high-low-close relationships, directional movement derived from up-moves versus down-moves, smoothed via Wilder's method over configurable period.
Directional Index Derivation : +DI and -DI calculated as smoothed directional movement divided by smoothed True Range, scaled to percentage values.
Coordinate Transformation : X-axis position equals (ADX - threshold) * 2, capped between -50 and +50; Y-axis position equals (+DI - -DI), capped between -50 and +50.
Quadrant Assignment : Positive X indicates trending (ADX > threshold), negative X indicates ranging; positive Y indicates bullish (+DI > -DI), negative Y indicates bearish.
Trail History Management : Configurable-length position history maintains recent coordinates for each asset, rendering gradient-faded lines connecting sequential positions.
Velocity Vector Calculation : 7-bar coordinate change converted to directional arrow overlays showing regime momentum and trajectory.
Return Correlation Processing : Bar-over-bar returns calculated for each asset, pairwise correlations computed over rolling window.
Network Graph Construction : Assets positioned in circular topology, correlation lines drawn between pairs exceeding threshold with thickness/opacity scaled by correlation strength, positive correlations solid green, negative correlations dashed red.
Risk Regime Scoring : Composite score aggregates bullish risk-on assets (equities, crypto, commodities) minus bullish risk-off assets (gold, dollar, VIX), generating overall market risk sentiment with colored candle overlay.
Together, these elements form a continuously updating spatial regime framework anchored in multi-asset momentum reality and correlation structure.
Interpretation
Cross-Market Regime Scanner should be interpreted as unified spatial regime boundaries with correlation context:
Top-Right Quadrant (TREND ▲) : Assets positioned here exhibit ADX above threshold with +DI exceeding -DI - confirmed bullish trending conditions with directional conviction.
Bottom-Right Quadrant (TREND ▼) : Assets positioned here exhibit ADX above threshold with -DI exceeding +DI - confirmed bearish trending conditions with directional conviction.
Top-Left Quadrant (RANGE ▲) : Assets positioned here exhibit ADX below threshold with +DI exceeding -DI - ranging consolidation with bullish bias but insufficient trend strength.
Bottom-Left Quadrant (RANGE ▼) : Assets positioned here exhibit ADX below threshold with -DI exceeding +DI - ranging consolidation with bearish bias but insufficient trend strength.
Position Trails : Gradient-faded lines connecting recent coordinate history reveal regime trajectory - curved paths indicate regime rotation, straight paths indicate sustained directional conviction.
Velocity Arrows : Directional vectors overlaid on current positions show 7-bar regime momentum - arrow length indicates speed of regime change, angle indicates trajectory direction.
Correlation Web : Circular network graph positioned left of main quadrant map displays pairwise asset relationships - solid green lines indicate positive correlation (moving together), dashed red lines indicate negative correlation (diverging moves), line thickness reflects correlation strength magnitude.
Asset Dots : Multi-layer glow effects with color-coded markers identify each asset on both quadrant map and correlation web-symbol labels positioned adjacent to current location.
Regime Summary Bar : Vertical boxes on right edge display condensed regime state for each enabled asset - box background color reflects quadrant classification, border color matches asset identifier.
Risk Regime Candles : Overlay candles on price chart colored by composite risk score - green indicates risk-on dominance (bullish equities/crypto exceeding bullish safe-havens), red indicates risk-off dominance (bullish gold/dollar/VIX exceeding bullish risk assets), gray indicates neutral balance.
Quadrant positioning, trail trajectory, correlation network topology, and velocity vectors outweigh isolated single-asset readings.
Signal Logic & Visual Cues
Cross-Market Regime Scanner presents spatial positioning insights rather than discrete entry signals:
Regime Clustering : Multiple assets congregating in same quadrant suggests broad market regime consensus - all assets in TREND ▲ indicates coordinated bullish momentum across instruments.
Regime Divergence : Assets splitting across opposing quadrants reveals intermarket disagreement - equities in TREND ▲ while safe-havens in TREND ▼ suggests healthy risk-on environment.
Quadrant Transitions : Assets crossing quadrant boundaries mark regime shifts - movement from left (ranging) to right (trending) indicates breakout from consolidation into directional phase.
Trail Curvature Patterns : Sharp curves in position trails signal rapid regime rotation, straight trails indicate sustained directional conviction, loops indicate regime uncertainty with back-and-forth oscillation.
Velocity Acceleration : Long arrows indicate rapid regime change momentum, short arrows indicate stable regime persistence, arrow direction reveals whether asset moving toward trending or ranging state.
Correlation Breakdown Events : Previously strong correlation lines (thick, opaque) suddenly thinning or disappearing indicates relationship decoupling - often precedes major regime transitions.
Correlation Inversion Signals : Assets shifting from positive correlation (solid green) to negative correlation (dashed red) marks structural market regime change - historically correlated assets beginning to diverge.
Risk Score Extremes : Composite score reaching maximum positive (all risk-on bullish, all risk-off bearish) or maximum negative (all risk-on bearish, all risk-off bullish) marks regime conviction extremes.
The primary value lies in simultaneous multi-asset regime awareness and correlation pattern recognition rather than isolated timing signals.
Strategy Integration
Cross-Market Regime Scanner fits within macro-aware and intermarket analysis approaches:
Regime-Filtered Entries : Use quadrant positioning as directional filter for primary trading instrument - favor long setups when asset in TREND ▲ quadrant, short setups in TREND ▼ quadrant.
Correlation Confluence Trading : Enter positions when target asset and correlated instruments occupy same quadrant - multiple assets in TREND ▲ provides conviction for long exposure.
Divergence-Based Reversal Anticipation : Monitor for regime divergence between correlated assets - if historically aligned instruments split to opposite quadrants, anticipate mean-reversion or regime rotation.
Breakout Confirmation via Cross-Asset Validation : Confirm primary instrument breakouts by verifying correlated assets simultaneously transitioning from ranging to trending quadrants.
Risk-On/Risk-Off Positioning : Use composite risk score and safe-haven positioning to determine overall market environment - scale risk exposure based on risk regime dominance.
Velocity-Based Timing : Enter during periods of high regime velocity (long arrows) when momentum carries assets decisively into new quadrants, avoid entries during low velocity regime uncertainty.
Multi-Timeframe Regime Alignment : Apply higher-timeframe regime scanner to establish macro context, use lower-timeframe price action for entry timing within aligned regime structure.
Correlation Web Pattern Recognition : Identify regime transitions early by monitoring correlation network topology changes - previously disconnected assets forming strong correlations suggests regime coalescence.
Technical Implementation Details
Core Engine : Wilder's smoothing-based ADX calculation with separate True Range and directional movement tracking per asset
Coordinate Model : Threshold-relative X-axis scaling (trending versus ranging) with directional movement differential Y-axis (bullish versus bearish)
Normalization System : Boundary capping at ±50 for consistent spatial positioning regardless of instrument volatility
Trail Rendering : Rolling array-based position history with gradient alpha decay and width tapering
Correlation Engine : Return-based pairwise correlation calculation over rolling window with configurable lookback
Network Visualization : Circular topology with trigonometric positioning, weighted line rendering based on correlation magnitude
Risk Scoring : Composite calculation aggregating directional states across classified risk-on and risk-off asset categories
Performance Profile : Optimized for 8 simultaneous security requests with efficient array management and conditional rendering
Optimal Application Parameters
Timeframe Guidance:
1 - 5 min : Micro-regime monitoring for intraday correlation shifts and short-term regime rotations
15 - 60 min : Intraday regime structure with meaningful ADX development and correlation stability
4H - Daily : Swing and position-level macro regime identification with sustained trend classification
Weekly - Monthly : Long-term regime cycle tracking with structural correlation pattern evolution
Suggested Baseline Configuration:
ADX Period : 14
ADX Smoothing : 14
Trend Threshold : 25.0
Trail Length : 15
Correlation Period : 50
Min |Correlation| to Show Line : 0.3
Web Radius : 30
Show Quadrant Colors : Enabled
Show Regime Summary Bar : Enabled
Show Velocity Arrows : Enabled
Show Correlation Web : Enabled
These suggested parameters should be used as a baseline; their effectiveness depends on the selected assets' volatility profiles, correlation characteristics, and preferred spatial sensitivity, so fine-tuning is expected for optimal performance.
Parameter Calibration Notes
Use the following adjustments to refine behavior without altering the core logic:
Assets clustering too tightly : Decrease Trend Threshold (e.g., 20) to spread ranging/trending separation, or increase ADX Period for smoother ADX calculation reducing noise.
Assets spreading too widely : Increase Trend Threshold (e.g., 30-35) to demand stronger ADX confirmation before classifying as trending, tightening quadrant boundaries.
Trail too short to show trajectory : Increase Trail Length (20-25) to visualize longer regime history, revealing sustained directional patterns.
Trail too cluttered : Decrease Trail Length (8-12) for cleaner visualization focusing on recent regime state, reducing visual complexity.
Unstable ADX readings : Increase ADX Period and ADX Smoothing (18-21) for heavier smoothing reducing bar-to-bar regime oscillation.
Sluggish regime detection : Decrease ADX Period (10-12) for faster response to directional changes, accepting increased sensitivity to noise.
Too many correlation lines : Increase Min |Correlation| threshold (0.4-0.6) to display only strongest relationships, decluttering network visualization.
Missing significant correlations : Decrease Min |Correlation| threshold (0.2-0.25) to reveal weaker but potentially meaningful relationships.
Correlation too volatile : Increase Correlation Period (75-100) for more stable correlation measurements, reducing network line flickering.
Correlation too stale : Decrease Correlation Period (30-40) to emphasize recent correlation patterns, capturing regime-dependent relationship changes.
Velocity arrows too sensitive : Modify 7-bar lookback in code to longer period (10-14) for smoother velocity representation, or increase magnitude threshold for arrow display.
Adjustments should be incremental and evaluated across multiple session types rather than isolated market conditions.
Performance Characteristics
High Effectiveness:
Macro-aware trading approaches requiring cross-market regime context for directional bias
Intermarket analysis strategies monitoring correlation breakdowns and regime divergences
Portfolio construction decisions requiring simultaneous multi-asset regime classification
Risk management frameworks using safe-haven positioning and risk-on/risk-off scoring
Trend-following systems benefiting from cross-asset regime confirmation before entry
Mean-reversion strategies identifying regime extremes via clustering patterns and correlation stress
Reduced Effectiveness:
Single-asset focused strategies not incorporating cross-market context in decision logic
High-frequency trading approaches where multi-security request latency impacts execution
Markets with consistently weak correlations where network topology provides limited insight
Extremely low volatility environments where ADX remains persistently below threshold for all assets
Instruments with erratic or unreliable ADX characteristics producing unstable coordinate positioning
Integration Guidelines
Confluence : Combine with BOSWaves structure, volume analysis, or primary instrument technical indicators for entry timing within aligned regime
Quadrant Respect : Trust signals occurring when primary trading asset occupies appropriate quadrant for intended trade direction
Correlation Context : Prioritize setups where target asset exhibits strong correlation with instruments in same regime quadrant
Divergence Awareness : Monitor for safe-haven assets moving opposite to risk assets - regime divergence validates directional conviction
Velocity Confirmation : Favor entries during periods of strong regime velocity indicating decisive momentum rather than regime oscillation
Risk Score Alignment : Scale position sizing and exposure based on composite risk score - larger positions during clear risk-on/risk-off environments
Trail Pattern Recognition : Use trail curvature to identify regime stability (straight) versus rotation (curved) versus uncertainty (looped)
Multi-Timeframe Structure : Apply higher-timeframe regime scanner for macro filter, lower-timeframe for tactical positioning within established regime
Disclaimer
Cross-Market Regime Scanner is a professional-grade multi-asset regime visualization and correlation analysis tool. It uses ADX-based coordinate positioning and rolling correlation calculation but does not predict future regime transitions or guarantee relationship persistence. Results depend on selected assets' characteristics, parameter configuration, correlation stability, and disciplined interpretation. Security request timing may introduce minor latency in real-time data retrieval. BOSWaves recommends deploying this indicator within a broader analytical framework that incorporates price structure, volume context, fundamental macro awareness, and comprehensive risk management.

Moving Average Divergence BandsMoving Average Divergence Bands
Moving Average Divergence Bands (MADB) is a trend-following overlay indicator designed to capture fast-moving trends while filtering out low-quality signals. It was developed with highly volatile markets in mind, particularly altcoins, where rapid entries are important but false breakouts are common.
The indicator builds adaptive price bands using two moving averages of different speeds and applies a statistical filter to allow signals only when market conditions show sufficient momentum. The result is a structure that attempts to combine fast reaction with controlled signal quality.
🚀 Core Idea
The objective of MADB is to create bands that respond quickly to market moves while avoiding entries during low-probability conditions.
This is achieved by combining fast and slower moving averages and activating signals only when price movement shows statistically meaningful deviation from its recent norm. In this way, entries tend to occur during periods with higher potential reward and reduced noise.
🔍 How It Works
The indicator calculates two moving averages:
• A primary moving average using the chosen length
• A secondary moving average using half of that length
Both averages are mathematically combined using exponent-based transformations, producing two divergence-based values. The higher value becomes the upper band, and the lower value becomes the lower band.
To filter signals, the script then computes a Z-score of price relative to its recent average. A trend switch occurs only when:
• Price breaks above or below the adaptive band, and
• The absolute Z-score exceeds the user-defined threshold.
This ensures signals occur only when price movement is statistically significant, reducing entries during low-volatility noise.
⚙️ Key Features
• Fast trend-following bands optimized for volatile markets
• Dual moving-average divergence construction
• Z-score filtering to reduce false signals
• Multiple moving-average types supported
• Adjustable statistical sensitivity
• Visual band and trend coloring styles
🧩 Inputs Overview
• Moving-average length and source
• Moving-average type selection
• Z-score calculation length
• Z-score activation threshold
• Visual style presets for band coloring
📌 Usage Notes
• Designed to identify strong market moves while filtering weak breakouts.
• Particularly suited for volatile markets and altcoin trading environments.
• Band breaks without sufficient Z-score strength will not trigger signals.
• Signals may change intrabar on lower timeframes.
• Best used alongside risk management and confirmation tools.
• No indicator eliminates risk; testing and validation are always recommended.
This script is intended for analytical use only and does not constitute financial advice.

Weighted NIFTY 5D Directional BreadthOverview
This indicator measures market participation quality within the NIFTY index by tracking how many heavily-weighted stocks are contributing to index direction over a rolling 5-day period.
Instead of counting simple up/down closes, it evaluates directional momentum × index weight, making it far more reliable for identifying narrow leadership, distribution, and late-stage rallies.
Why this indicator matters
Indexes can continue making higher highs even when only a few large stocks are doing the lifting.
This tool reveals what price alone hides:
Whether participation is broad or narrowing
When index highs are being driven by fewer contributors
Early warnings of fragility before corrections
How it works
Each selected NIFTY stock is assigned a weight approximating index influence
The indicator checks whether each stock is up or down versus its 5-day close
Directional signals are weighted and aggregated
The result is a single breadth line reflecting true contribution strength
Positive values → weighted participation is supportive
Negative values → weighted drag beneath the index
How to interpret
Index Higher High + Indicator Lower High
→ Narrow leadership, distribution risk
Indicator turns down before price
→ Early loss of momentum
Sustained positive readings
→ Healthy, broad participation
Sustained negative readings
→ Market weakness beneath the surface
This is not a buy/sell signal, but a context and risk-assessment tool.
Best use cases
Identifying late-stage rallies
Confirming or rejecting breakouts
Risk management for index trades
Combining with price structure or momentum indicators
Notes
Designed for Daily and higher timeframes
Uses non-repainting logic
Best used alongside price action and structure
Disclaimer
This indicator is intended for educational and analytical purposes only.
It does not provide financial advice or trade recommendations.

Momentum RSIMomentum RSI (MRSI | MisinkoMaster)
Momentum RSI is an enhanced version of the classic Relative Strength Index (RSI) developed by J. Welles Wilder. This indicator integrates momentum components directly into the RSI calculation, resulting in a faster, smoother oscillator that helps traders identify trend strength and value zones with greater precision.
Unlike the traditional RSI, which relies on a fixed smoothing approach, the Momentum RSI dynamically incorporates momentum derived from differences between moving averages of RSI values over different lookback periods. This improves signal responsiveness while reducing noise, providing clearer insights for both trend-following and mean-reversion trading strategies.
🔍 Concept & Idea
Momentum RSI aims to improve the original RSI by adding momentum elements that speed up its reaction to price changes without sacrificing smoothness. This hybrid approach helps:
Capture early signals in trending markets
Reduce false signals during sideways or choppy conditions
Highlight overbought and oversold zones more effectively
Provide additional momentum context for more informed trading decisions
By combining RSI with momentum derived from moving average differences, the indicator balances sensitivity and stability for a versatile application across different asset classes and timeframes.
⚙️ How It Works
The Momentum RSI calculation involves several key steps:
Standard RSI Calculation:
The indicator first calculates the classic RSI using user-defined length and smoothing parameters. Users can customize the RSI source price and the smoothing moving average (MA) type applied (options include RMA, SMA, EMA, WMA, DEMA, TEMA, HMA, ALMA).
Momentum Derivation:
Two versions of the RSI are computed with different smoothing lengths—a base RSI and a longer smoothed RSI. The difference between their moving averages represents a momentum component that measures the short-term trend strength.
Additional Momentum:
The difference between shorter-length and longer-length RSI calculations adds another momentum layer, reflecting momentum shifts over different timescales.
Momentum Integration:
These momentum components are combined and added to the previous RSI value, resulting in a momentum-enhanced RSI value (mrsi) that oscillates between 0 and 100.
Trend Detection:
Customizable upper and lower thresholds define long and short signal zones, allowing users to interpret when the market is trending bullish or bearish.
Overbought/Oversold Zones:
Additional thresholds highlight extreme value zones for potential mean-reversion trades.
🧩 Inputs Overview
RSI Length - Controls the primary RSI calculation length (default 20).
Source - Selects the price source for the RSI calculation (default: close).
Smoothing Length - Length used to smooth RSI values with the chosen MA type (default 12).
MA Type - Moving average method used for smoothing (options: RMA, SMA, EMA, WMA, DEMA, TEMA, HMA, ALMA).
ALMA Offset - Offset parameter for ALMA smoothing (applicable only if ALMA is selected).
ALMA Sigma - Sigma parameter for ALMA smoothing (applicable only if ALMA is selected).
Upper Threshold - RSI level above which a bullish (long) signal is triggered (default 55).
Lower Threshold - RSI level below which a bearish (short) signal is triggered (default 45).
Overbought Threshold - RSI level indicating overbought conditions (default 85).
Oversold Threshold - RSI level indicating oversold conditions (default 15).
📌 Usage Notes
Versatile Application: Use Momentum RSI for both trend-following and mean-reversion strategies.
Signal Clarity: The momentum integration reduces noise, helping avoid false breakouts and improving entry timing.
Customization: Adjust smoothing lengths and MA types to match the characteristics of your trading style or the specific asset.
Visual Aids: Background colors, candle coloring, and shape markers facilitate quick interpretation of momentum strength and trend changes.
Threshold Sensitivity: Fine-tune thresholds to balance between early signals and signal reliability.
Intrabar Updates: Signals may update on lower timeframes for responsive trading.
Combine with Other Tools: For best results, use Momentum RSI alongside volume, price action, or other confirmation indicators.
Backtest Before Live Trading: Always validate settings on historical data to ensure suitability for your trading instrument and timeframe.
⚠️ Disclaimer
This script is intended for educational and analytical purposes only and does not constitute financial advice. Trading involves risk, and users should perform their own due diligence before making any trading decisions.
