WaveTrend Dynamic (Lazy Bear Style)█ OVERVIEW
The WaveTrend Dynamic indicator (in the style of Lazy Bear) is an advanced tool based on the Exponential Smoothing Average (ESA), which adapts to the volatility and price of a financial instrument. It is more flexible than the classic WaveTrend but shares a similar concept of bands around a main oscillator line.
The indicator uses dynamic bands calculated as distances from the ESA, with their width adjustable via the "level" parameter. This allows it to be tailored to various markets, timeframes, and volatility conditions, making it easier to identify trends, reversal points, and buy/sell signals.
█ CONCEPTS
The WaveTrend Dynamic combines oscillator functions with trend analysis. Below, we explain the key components in a simple way, understandable even for beginner users.
Core Calculations
The indicator relies on the adaptive ESA and a few straightforward steps:
1 — ESA (Adaptive Average): Calculated as a smoothed average of the price (from high, low, and close, or HLC3) using the ESA Length parameter (default: 10). This number determines how many past candles are considered in the calculation. The ESA quickly responds to price changes, helping to track trends.
2 — Deviation (D): Measures how much the price deviates from the ESA, factoring in market volatility. This allows the indicator to adapt to different instruments.
3 — Price Distance Indicator (CI): Shows how far the price is from the ESA relative to market volatility. This forms the basis for the main indicator line, reacting to price movements.
4 — WT1 (WaveTrend 1): The main line, smoothing the Price Distance Indicator (CI) with the Average Length parameter (default: 21). It reflects the direction of price movement and momentum.
5 — WT2 (WaveTrend 2): A signal line that further smooths WT1 (with a period of 4). It helps confirm signals through crossovers with WT1.
6 — Bands (UpperBand and LowerBand): These form a dynamic channel around the ESA. Their width depends on the level parameter (default: 100). Wider bands result in fewer but more reliable signals. In the original WaveTrend, the oscillator bands use lower values, such as 50 or 60. To achieve classic oscillator signals (more frequent WT1/WT2 crossovers outside the bands), set the level to 50–60.
Trend Identification
The indicator identifies two types of trends:
• Major Trend: Determined by the position of WT1 relative to the ESA. When WT1 is above the ESA, it indicates a bullish trend. When below, it signals a bearish trend. Line and fill colors reflect this trend.
• Mini-Trend: Based on WT1 and WT2 crossovers. When the lines cross, they change to the same color, signaling short-term changes or reversal points. This is ideal for quick trading decisions.
Visuals and Effects
• WT1 and WT2 Lines: Scaled to price and displayed on the price chart for easier analysis.
• Fills: Between the bands (UpperBand/LowerBand) and between WT1/WT2, with a "wave" effect that adjusts transparency based on the trend (green for bullish, red for bearish).
• Signals: Three types—return-to-band, WT1/WT2 crossovers outside the bands, and crossovers inside the bands. Signals are displayed as triangles with different colors for buy and sell.
█ FEATURES
Detailed features of the indicator, aligned with the order of settings in the script:
• Basic Parameters: ESA Length — controls ESA smoothing; Average Length — affects WT1 responsiveness; level (WT Level) — adjusts band width for signal filtering.
• Display Elements: Options to show/hide ESA, bands, WT1/WT2; customizable colors for lines, fills, and the wave effect.
• Signals: Three signal groups (return-to-band, crossovers outside bands, crossovers inside bands) with display and color customization options.
█ HOW TO USE
1 — Add the indicator to your TradingView chart and adjust parameters: — Increase ESA Length and Average Length for low-volatility markets (e.g., stocks), or decrease for cryptocurrencies or forex. — Set level to 50–60 for classic WaveTrend signals with WT1/WT2 crossovers outside bands. The default value of 100 creates wider bands and fewer signals.
2 — Analyze trends: — Major trend (WT1 vs. ESA) shows the overall market direction. — Mini-trends (WT1/WT2 crossovers) help time short-term entries.
3 — Use signals: — Return-to-band: Buy at the lower band, sell at the upper band (mean-reversion). — Crossovers outside bands: Indicate strong momentum (with a lower level, e.g., 50). — Crossovers inside bands: Signal weaker trend changes.
4 — Combine with other tools: Use with volume, RSI, or support/resistance for better decisions. Test on historical data to optimize settings.
"crossover债券是什么"に関するスクリプトを検索

Multi-Timeframe MACD Strategy ver 1.0Multi-Timeframe MACD Strategy: Enhanced Trend Trading with Customizable Entry and Trailing Stop
This strategy utilizes the Moving Average Convergence Divergence (MACD) indicator across multiple timeframes to identify strong trends, generate precise entry and exit signals, and manage risk with an optional trailing stop loss. By combining the insights of both the current chart's timeframe and a user-defined higher timeframe, this strategy aims to improve trade accuracy, reduce exposure to false signals, and capture larger market moves.
Key Features:
Dual Timeframe Analysis: Calculates and analyzes the MACD on both the current chart's timeframe and a user-selected higher timeframe (e.g., Daily MACD on a 1-hour chart). This provides a broader market context, helping to confirm trends and filter out short-term noise.
Configurable MACD: Fine-tune the MACD calculation with adjustable Fast Length, Slow Length, and Signal Length parameters. Optimize the indicator's sensitivity to match your trading style and the volatility of the asset.
Flexible Entry Options: Choose between three distinct entry types:
Crossover: Enters trades when the MACD line crosses above (long) or below (short) the Signal line.
Zero Cross: Enters trades when the MACD line crosses above (long) or below (short) the zero line.
Both: Combines both Crossover and Zero Cross signals, providing more potential entry opportunities.
Independent Timeframe Control: Display and trade based on the current timeframe MACD, the higher timeframe MACD, or both. This allows you to focus on the information most relevant to your analysis.
Optional Trailing Stop Loss: Implements a configurable trailing stop loss to protect profits and limit potential losses. The trailing stop is adjusted dynamically as the price moves in your favor, based on a user-defined percentage.
No Repainting: Employs lookahead=barmerge.lookahead_off in the request.security() function to prevent data leakage and ensure accurate backtesting and real-time signals.
Clear Visual Signals (Optional): Includes optional plotting of the MACD and Signal lines for both timeframes, with distinct colors for easy visual identification. These plots are for visual confirmation and are not required for the strategy's logic.
Suitable for Various Trading Styles: Adaptable to swing trading, day trading, and trend-following strategies across diverse markets (stocks, forex, cryptocurrencies, etc.).
Fully Customizable: All parameters are adjustable, including timeframes, MACD Settings, Entry signal type and trailing stop settings.
How it Works:
MACD Calculation: The strategy calculates the MACD (using the standard formula) for both the current chart's timeframe and the specified higher timeframe.
Trend Identification: The relationship between the MACD line, Signal line, and zero line is used to determine the current trend for each timeframe.
Entry Signals: Buy/sell signals are generated based on the selected "Entry Type":
Crossover: A long signal is generated when the MACD line crosses above the Signal line, and both timeframes are in agreement (if both are enabled). A short signal is generated when the MACD line crosses below the Signal line, and both timeframes are in agreement.
Zero Cross: A long signal is generated when the MACD line crosses above the zero line, and both timeframes agree. A short signal is generated when the MACD line crosses below the zero line and both timeframes agree.
Both: Combines Crossover and Zero Cross signals.
Trailing Stop Loss (Optional): If enabled, a trailing stop loss is set at a specified percentage below (for long positions) or above (for short positions) the entry price. The stop-loss is automatically adjusted as the price moves favorably.
Exit Signals:
Without Trailing Stop: Positions are closed when the MACD signals reverse according to the selected "Entry Type" (e.g., a long position is closed when the MACD line crosses below the Signal line if using "Crossover" entries).
With Trailing Stop: Positions are closed if the price hits the trailing stop loss.
Backtesting and Optimization: The strategy automatically backtests on the chart's historical data, allowing you to assess its performance and optimize parameters for different assets and timeframes.
Example Use Cases:
Confirming Trend Strength: A trader on a 1-hour chart sees a bullish MACD crossover on the current timeframe. They check the MTF MACD strategy and see that the Daily MACD is also bullish, confirming the strength of the uptrend.
Filtering Noise: A trader using a 15-minute chart wants to avoid false signals from short-term volatility. They use the strategy with a 4-hour higher timeframe to filter out noise and only trade in the direction of the dominant trend.
Dynamic Risk Management: A trader enters a long position and enables the trailing stop loss. As the price rises, the trailing stop is automatically adjusted upwards, protecting profits. The trade is exited either when the MACD reverses or when the price hits the trailing stop.
Disclaimer:
The MACD is a lagging indicator and can produce false signals, especially in ranging markets. This strategy is for educational and informational purposes only and should not be considered financial advice. Backtest and optimize the strategy thoroughly, combine it with other technical analysis tools, and always implement sound risk management practices before using it with real capital. Past performance is not indicative of future results. Conduct your own due diligence and consider your risk tolerance before making any trading decisions.

BooBee Digital - Enhanced Buy & Sell Alerts Suite
BooBee Digital - Enhanced Buy & Sell Alerts Suite
Introduction:
The “BooBee Digital - Enhanced Buy & Sell Alerts Suite” is a comprehensive trading tool designed to provide traders with precise buy and sell signals by integrating the Average True Range (ATR) trailing stop technique and the Volume Weighted Average Price (VWAP) indicator. This script is tailored to help traders make informed decisions by considering both market volatility and trading volume.
How It Works:
1. ATR Calculation:
• Purpose: Measures market volatility to set dynamic stop levels.
• Details: The Average True Range (ATR) is calculated over a user-defined period. The ATR value reflects the average range of price movements over the specified period, which is crucial for assessing market volatility.
2. ATR Trailing Stop:
• Purpose: Identifies potential trend reversals by setting trailing stops based on market volatility.
• Details: The ATR trailing stop is dynamically adjusted using the ATR value and a user-defined sensitivity factor. This trailing stop level helps identify trend reversals by moving in accordance with price fluctuations.
3. VWAP Calculation:
• Purpose: Provides a volume-weighted average price to benchmark fair value.
• Details: The VWAP is calculated by taking the sum of the product of price and volume, divided by the total volume. This indicator gives traders a reference point for the average price at which the asset has traded throughout the day, considering trading volume.
4. EMA Crossover:
• Purpose: Adds a confirmation layer for buy and sell signals.
• Details: A 1-period Exponential Moving Average (EMA) is used to identify short-term price movements. Buy and sell signals are generated based on the crossover of the EMA and the ATR trailing stop, adding an extra layer of confirmation for trade entries and exits.
Signal Generation:
Buy Signal:
• Generated when the price is above the ATR trailing stop and there is a bullish crossover of the EMA and ATR trailing stop.
• Indicator: Green label below the bar with “Buy” text.
Sell Signal:
• Generated when the price is below the ATR trailing stop and there is a bearish crossover of the EMA and ATR trailing stop.
• Indicator: Red label above the bar with “Sell” text.
VWAP Line:
• The VWAP line is plotted on the chart to help traders identify significant price levels based on trading volume.
• Indicator: Blue line representing the VWAP.
How to Use:
• Chart Type: The script is designed for use on standard chart types such as Candlestick and OHLC. It does not support non-standard chart types like Heikin Ashi, Renko, Kagi, Point & Figure, and Range, as they may produce unrealistic results.
• Clean Chart: Ensure your chart is clean and free of other indicators to avoid confusion. The signals and colors plotted by the script should be easily identifiable.
• Trade Confirmation: Use the buy and sell signals generated by the script in conjunction with other analysis methods to confirm trades.
Key Concepts:
• ATR Trailing Stop: This technique sets dynamic stop levels based on market volatility, helping to identify trend reversals.
• VWAP: This indicator provides a benchmark for the average price considering trading volume, helping traders identify fair value.
• EMA Crossover: This adds a layer of confirmation for buy and sell signals, improving the accuracy of trade entries and exits.

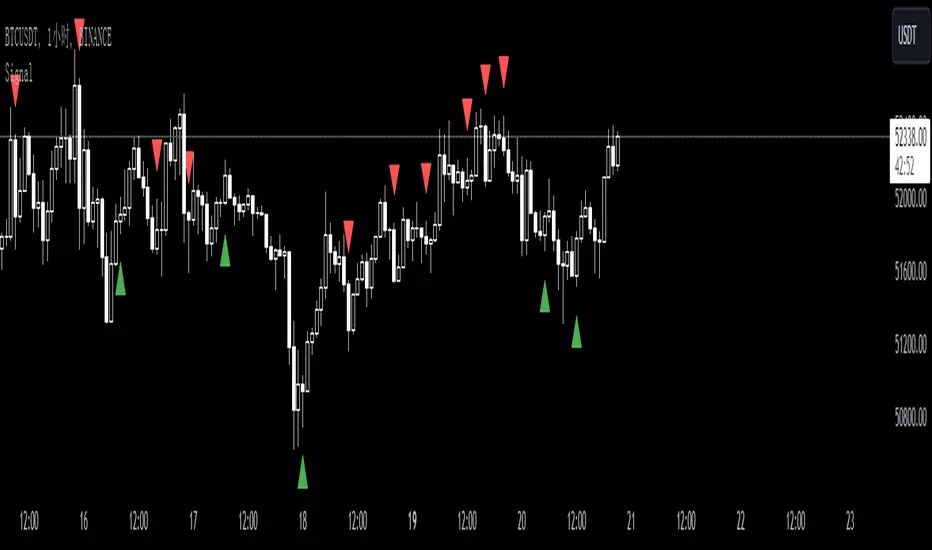
SignalThis custom TradingView indicator, named "Signal," is designed to generate buy and sell signals based on the Stochastic Oscillator, a momentum indicator that compares a particular closing price of an asset to a range of its prices over a certain period of time. The indicator is set to overlay on the price chart, providing visual cues for potential trading opportunities.
Key features of the "Signal" indicator include:
1. **Dynamic Period Adjustment**: The indicator automatically adjusts its settings based on the chart's time frame. For a 1-hour (60 minutes) chart, the stochastic length is set to 15, while for a 15-minute chart, the length is set to 10.
2. **Stochastic Calculation**: It calculates the %K line as a smoothed moving average (SMA) of the stochastic ratio, and the %D line as an SMA of the %K line, with both lines smoothed over a period derived from the dynamic length setting.
3. **Signal Detection**: The indicator identifies bullish crossovers (golden crosses) when the %K line crosses above the %D line and the average of both lines is below 50. Conversely, it detects bearish crossovers (death crosses) when the %K line crosses below the %D line and the average is above 50.
4. **Signal Confirmation**: Signals are confirmed using historical data with an offset of 1 bar to ensure that the crossover is evaluated after the close of the candlestick, thus avoiding repainting issues.
5. **Visual Indicators**: Buy signals are represented by green upward-pointing triangles placed below the bars, while sell signals are indicated by red downward-pointing triangles above the bars.
6. **Alerts**: The indicator includes alert conditions for both golden crosses and death crosses, notifying users when a potential buy or sell signal has been identified based on the stochastic crossover.
This indicator can be a valuable tool for traders who follow stochastic momentum signals and prefer to have dynamic adjustments based on the chart's time frame. It is important to note that, as with all trading indicators, the "Signal" indicator should be used in conjunction with other forms of analysis to confirm trading signals and manage risk effectively.
Currency Strength v3.0Currency Strength v3.0
Summary
The Currency Strength indicator is a powerful tool designed to gauge the relative strength of major and emerging market currencies. By plotting the True Strength Index (TSI) of various currency indices, it provides a clear visual representation of which currencies are gaining momentum and which are losing it. This indicator automatically detects the currency pair on your chart and highlights the corresponding strength lines, simplifying analysis and helping you quickly identify potential trading opportunities based on currency dynamics.
Key Features
Comprehensive Currency Analysis: Tracks the strength of 19 currencies, including major pairs and several emerging market currencies.
Automatic Pair Detection: Intelligently identifies the base and quote currency of the active chart, automatically highlighting the relevant strength lines.
Dynamic Coloring: The base currency is consistently colored blue, and the quote currency is colored gold, making it easy to distinguish between the two at a glance.
Non-Repainting TSI Calculation: Uses the True Strength Index (TSI) for smooth and reliable momentum readings that do not repaint.
Customizable Settings: Allows for adjustment of the fast and slow periods for the TSI calculation to fit your specific trading style.
Clean Interface: Features a minimalist legend table that only displays the currencies relevant to your current chart, keeping your workspace uncluttered.
How It Works
The indicator pulls data from major currency indices (like DXY for the US Dollar and EXY for the Euro). For currencies that don't have a dedicated index, it uses their USD pair (e.g., USDCNY) and inverts the calculation to derive the currency's strength relative to the dollar. It then applies the True Strength Index (TSI) to this data. The TSI is a momentum oscillator that is less volatile than other oscillators, providing a more reliable measure of strength. The resulting values are plotted on the chart, allowing you to see how different currencies are performing against each other in real-time.
How to Use
Trend Confirmation: When the base currency's line is rising and above the zero line, and the quote currency's line is falling, it can confirm a bullish trend for the pair. The opposite would suggest a bearish trend.
Identifying Divergences: Look for divergences between the currency strength lines and the price action of the pair. For example, if the price is making higher highs but the base currency's strength is making lower highs, it could signal a potential reversal.
Crossovers: A crossover of the base and quote currency lines can signal a shift in momentum. A bullish signal occurs when the base currency line crosses above the quote currency line. A bearish signal occurs when it crosses below.
Overbought/Oversold Levels: The horizontal dashed lines at 0.5 and -0.5 can be used as general guides for overbought and oversold conditions, respectively. Strength moving beyond these levels may indicate an unsustainable move that is due for a correction.
Settings
Fast Period: The short-term period for the TSI calculation. Default is 7.
Slow Period: The long-term period for the TSI calculation. Default is 15.
Index Source: The price source used for the calculations (e.g., Close, Open). Default is Close.
Base Currency Color: The color for the base currency line. Default is Royal Blue.
Quote Currency Color: The color for the quote currency line. Default is Goldenrod.
Disclaimer
This indicator is intended for educational and analytical purposes only. It is not financial advice. Trading involves substantial risk, and past performance is not indicative of future results. Always conduct your own research and risk management before making any trading decisions.

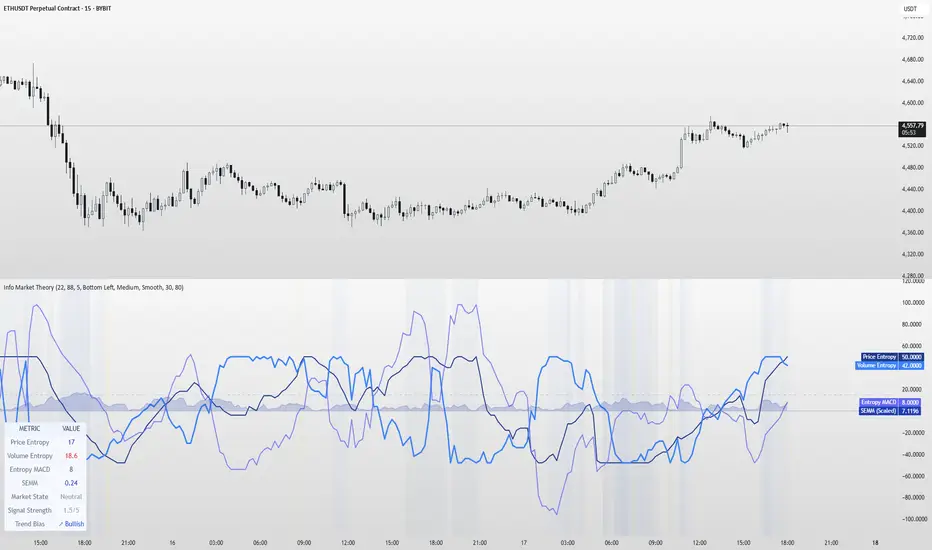
Information Theory Market AnalysisINFORMATION THEORY MARKET ANALYSIS
OVERVIEW
This indicator applies mathematical concepts from information theory to analyze market behavior, measuring the randomness and predictability of price and volume movements through entropy calculations. Unlike traditional technical indicators, it provides insight into market structure and regime changes.
KEY COMPONENTS
Four Main Signals:
• Price Entropy (Deep Blue): Measures randomness in price movements
• Volume Entropy (Bright Blue): Analyzes volume pattern predictability
• Entropy MACD (Purple): Shows relationship between price and volume entropy
• SEMM (Royal Blue): Stochastic Entropy Market Monitor - overall market randomness gauge
Market State Detection:
The indicator identifies seven distinct market states:
• Strong Trending (SEMM < 0.1)
• Weak Trending (0.1-0.2)
• Neutral (0.2-0.3)
• Moderate Random (0.3-0.5)
• High Randomness (0.5-0.8)
• Very Random (0.8-1.0)
• Chaotic (>1.0)
KEY FEATURES
Advanced Analytics:
• Signal Strength Confluence: 0-5 scale measuring alignment of multiple factors
• Entropy Crossovers: Detects shifts between accumulation and distribution phases
• Extreme Readings: Identifies statistical outliers for potential reversals
• Trend Bias Analysis: Directional momentum assessment
Information Dashboard:
• Real-time entropy values and market state
• Signal strength indicator with visual highlighting
• Trend bias with directional arrows
• Color-coded alerts for extreme conditions
Customizable Display:
• Adjustable SEMM scaling (5x to 100x) for optimal visibility
• Multiple line styles: Smooth, Stepped, Dotted
• 9 table positions with 3 size options
• Professional blue color scheme with transparency controls
Comprehensive Alert System - 15 Alert Types Including:
• Extreme entropy readings (price/volume)
• Crossover signals (dominance shifts)
• Market state changes (trending ↔ random)
• High confluence signals (3+ factors aligned)
HOW TO USE
Reading the Signals:
• Entropy Values > ±25: Strong structural signals
• Entropy Values > ±40: Extreme readings, potential reversals
• SEMM < 0.2: Trending market favors directional strategies
• SEMM > 0.5: Random market favors range/scalping strategies
Signal Confluence:
Look for multiple factors aligning:
• Signal Strength ≥ 3.0 for higher probability setups
• Background highlighting indicates confluence
• Table shows real-time strength assessment
Timeframe Optimization:
• Short-term (1m-15m): Entropy Length 14-22, Sensitivity 3-5
• Swing Trading (1H-4H): Default settings optimal
• Position Trading (Daily+): Entropy Length 34-55, Sensitivity 8-12
EDUCATIONAL APPLICATIONS
Market Structure Analysis:
• Understand when markets are trending vs. ranging
• Identify accumulation and distribution phases
• Recognize extreme market conditions
• Measure information content in price movements
Information Theory Concepts:
• Binary entropy calculations applied to financial data
• Probability distribution analysis of returns
• Statistical ranking and percentile analysis
• Momentum-adjusted randomness measurement
TECHNICAL DETAILS
Calculations:
• Uses binary entropy formula: -
• Percentile ranking across multiple timeframes
• Volume-weighted probability distributions
• RSI-adjusted momentum entropy (SEMM)
Customization Options:
• Entropy Length: 5-100 bars (default: 22)
• Average Length: 10-200 bars (default: 88)
• Sensitivity: 1.0-20.0 (default: 5.0, lower = more sensitive)
• SEMM Scaling: 5.0-100.0x (default: 30.0)
IMPORTANT NOTES
Risk Considerations:
• Indicator measures probabilities, not certainties
• High SEMM values (>0.5) suggest increased market randomness
• Extreme readings may persist longer than expected
• Always combine with proper risk management
Educational Purpose:
This indicator is designed for:
• Market structure analysis and education
• Understanding information theory applications in finance
• Developing probabilistic thinking about markets
• Research and analytical purposes
Performance Tips:
• Allow 200+ bars for proper initialization
• Adjust scaling and transparency for optimal visibility
• Use confluence signals for higher probability analysis
• Consider multiple timeframes for comprehensive analysis
DISCLAIMER
This indicator is for educational and analytical purposes. It does not constitute financial advice. Past performance does not guarantee future results. Always conduct your own research and consider your risk tolerance before making trading decisions.
Version: 5.0
Category: Oscillators, Volume, Market Structure
Best For: All timeframes, trending and ranging markets
Complexity: Intermediate to Advanced
Candle Breakout Oscillator [LuxAlgo]The Candle Breakout Oscillator tool allows traders to identify the strength and weakness of the three main market states: bullish, bearish, and choppy.
Know who controls the market at any given moment with an oscillator display with values ranging from 0 to 100 for the three main plots and upper and lower thresholds of 80 and 20 by default.
🔶 USAGE
The Candle Breakout Oscillator represents the three main market states, with values ranging from 0 to 100. By default, the upper and lower thresholds are set at 80 and 20, and when a value exceeds these thresholds, a colored area is displayed for the trader's convenience.
This tool is based on pure price action breakouts. In this context, we understand a breakout as a close above the last candle's high or low, which is representative of market strength. All other close positions in relation to the last candle's limits are considered weakness.
So, when the bullish plot (in green) is at the top of the oscillator (values above 80), it means that the bullish breakouts (close below the last candle low) are at their maximum value over the calculation window, indicating an uptrend. The same interpretation can be made for the bearish plot (in red), indicating a downtrend when high.
On the other hand, weakness is indicated when values are below the lower threshold (20), indicating that breakouts are at their minimum over the last 100 candles. Below are some examples of the possible main interpretations:
There are three main things to look for in this oscillator:
Value reaches extreme
Value leaves extreme
Bullish/Bearish crossovers
As we can see on the chart, before the first crossover happens the bears come out of strength (top) and the bulls come out of weakness (bottom), then after the crossover the bulls reach strength (top) and the bears weakness (bottom), this process is repeated in reverse for the second crossover.
The other main feature of the oscillator is its ability to identify periods of sideways trends when the sideways values have upper readings above 80, and trending behavior when the sideways values have lower readings below 20. As we just saw in the case of bullish vs. bearish, sideways values signal a change in behavior when reaching or leaving the extremes of the oscillator.
🔶 DETAILS
🔹 Data Smoothing
The tool offers up to 10 different smoothing methods. In the chart above, we can see the raw data (smoothing: None) and the RMA, TEMA, or Hull moving averages.
🔹 Data Weighting
Users can add different weighting methods to the data. As we can see in the image above, users can choose between None, Volume, or Price (as in Price Delta for each breakout).
🔶 SETTINGS
Window: Execution window, 100 candles by default
🔹 Data
Smoothing Method: Choose between none or ten moving averages
Smoothing Length: Length for the moving average
Weighting Method: Choose between None, Volume, or Price
🔹 Thresholds
Top: 80 by default
Bottom: 20 by default

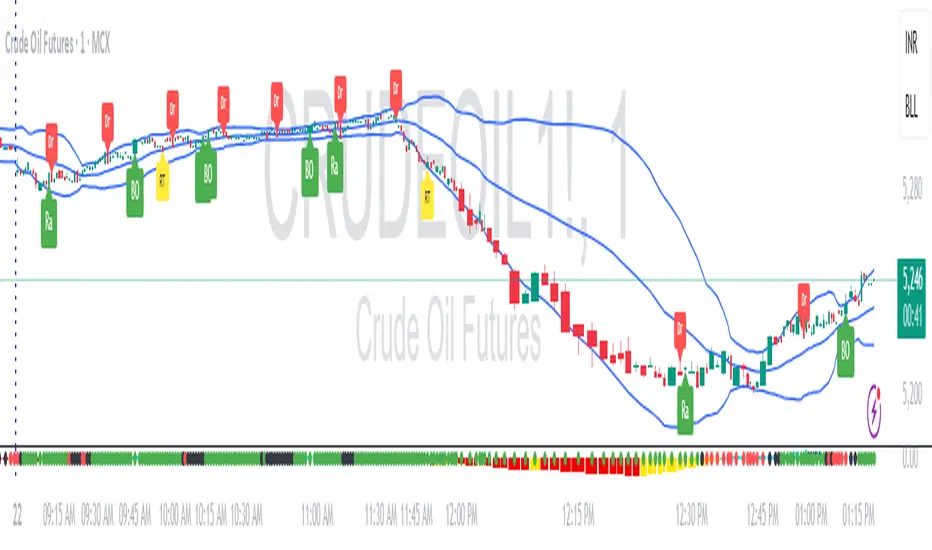
RDBRB Strategy with Filters + Cooldowns + LabelsRDBRB Strategy with Filters + Cooldowns
This script implements the RDBRB (Rally-Drop-Base-Retest-Breakout) strategy, a classic price action setup designed to identify structured trade opportunities using volume, volatility bands, and trend alignment. It’s ideal for traders looking for clean, rule-based entries across any timeframe.
🧠 Core Components
Rally & Drop Detection
Identifies short-term momentum shifts using moving average crossovers:
✅ Ra = Rally (bullish crossover)
🔻 Dr = Drop (bearish crossunder)
Base Formation
A statistical base is defined using a moving average with a standard deviation envelope (Upper/Lower BB). This forms the foundation for breakout or retest setups.
Retest Zone (RT)
When price returns to the lower band (but stays below the base), it suggests a potential re-accumulation or reaction zone before a breakout.
Breakout Confirmation (BO)
A breakout is validated when:
Price crosses above the upper band
Volume exceeds the 20-bar average by a threshold multiplier
RSI is above a bullish momentum level
Price is trending above the longer-term EMA
⏱️ Smart Cooldown Logic
Each signal (Rally, Drop, Retest, Breakout) has an independent cooldown timer to prevent multiple triggers within a short range, filtering out noise and duplicate signals:
Customizable cooldown periods via input settings
Ensures signals are meaningful and not clustered
💡 Visual Markers
All signals are shown as small, color-coded labels:
Ra : Green label below bar
Dr : Red label above bar
RT : Yellow label below bar
BO : Green breakout label below bar
Bands and base are plotted for structure reference.
🛠️ Customizable Settings
Cooldown periods for each signal type
MA lengths, volume and RSI thresholds
Trend filter and base calculation inputs
This script is ideal for price action traders who want a clean, structured method to trade consolidations and trend continuations while avoiding over-signaling. Use it on any timeframe and combine with higher-timeframe confirmation for best results.
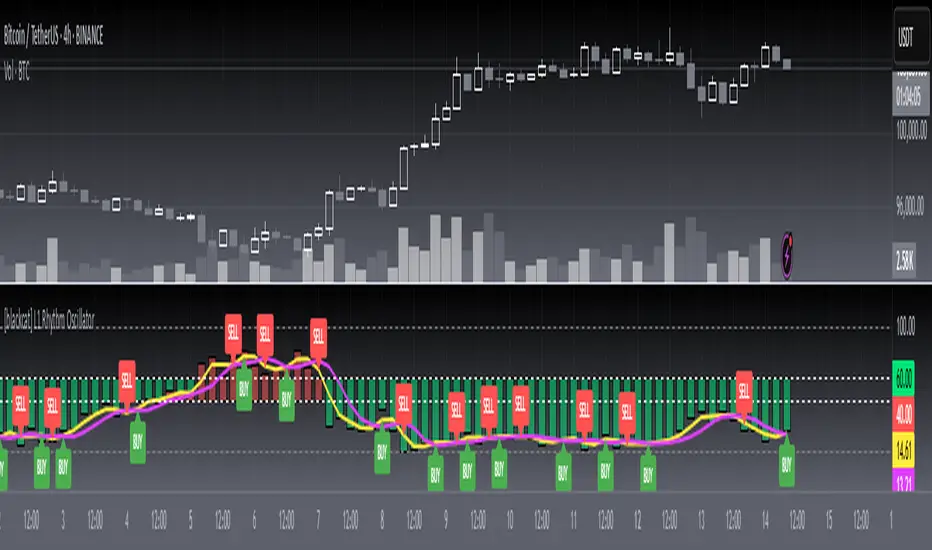
[blackcat] L1 Rhythm OscillatorOVERVIEW 📊💡
The L1 Rhythm Oscillator is an advanced oscillator designed to identify potential entry points in financial markets using a combination of Williams %R indicators and Time-Varying Moving Averages (TVMAs). This script provides traders with clear buy and sell signals that help them capitalize on trends while minimizing risk.
FEATURES 💡🌟
Williams %R Analysis:
Base Indicator (WR0): Measures overbought/oversold conditions within a specified period.
Smoothed Indicators (WR1 & WR2): Further refined versions of WR0 to filter out noise and highlight significant trends.
Dynamic Bands:
Bull Band: Shaded area between WR0 and the bullish threshold when WR0 falls below the defined level.
Bear Band: Shaded area between WR0 and the bearish threshold when WR0 exceeds the defined level.
Trading Signals:
Buy Signal: Generated when WR1 crosses above WR2, indicating a potential upward trend reversal.
Sell Signal: Triggered when WR1 crosses below WR2, suggesting a downward trend shift.
Thresholds:
Bull Threshold (default 60%): Marks levels where the asset is considered relatively undervalued.
Bear Threshold (default 40%): Indicates regions where the asset might be overvalued.
Visual Enhancements:
Colored Bands: Clearly distinguish between bullish and bearish areas.
Horizontal Lines: Provide quick reference points for overbought/oversold levels.
Labels: Display "BUY" and "SELL" markers at key signal locations.
HOW TO USE ⚙️📈
Add the Indicator to Your Chart:
Open your preferred asset's chart on TradingView.
Click on “Indicators” and search for “ L1 Rhythm Oscillator.”
Add the indicator to your chart.
Customize Parameters:
Adjust these inputs according to your trading strategy:
WR Period: Sets the lookback window for calculating Williams %R.
Bull Threshold: Defines the upper limit for bullish territory.
Bear Threshold: Establishes the lower boundary for bearish territory.
TVMA Length: Controls the sensitivity of the moving average used in calculations.
Interpret Visual Elements:
Yellow Line (WR1): The first smoothed version of the base Williams %R.
Fuchsia Line (WR2): The second smoothed line derived from WR1 via TVMA.
Lime-Shaded Area: Represents Bull Band where prices are potentially undervalued.
Red-Shaded Area: Symbolizes Bear Band indicating possible overvaluation.
Horizontal Lines:
Value 0% represents perfect overbought condition.
Value 100% indicates extreme oversold state.
Bull/Bear thresholds provide additional context for interpreting market sentiment.
Act on Crossovers:
Look for instances where WR1 crosses through WR2:
When WR1 moves above WR2 → Potential BUY opportunity.
When WR1 dips below WR2 → Likely SELL scenario.
Consider Contextual Factors:
Combine the oscillator signals with other technical indicators like MACD, RSI, or volume analysis for more robust decision-making.
Be aware of broader market trends and news events that could impact price movements.
Manage Risk:
Always use proper stop-loss orders to protect against adverse price movements.
Consider position sizing based on available capital and risk tolerance.
LIMITATIONS ⚠️🔍
Historical Data Dependency: Like most oscillators, this tool relies on past data patterns which may not always predict future behavior accurately.
False Signals: No single indicator can guarantee correct predictions; false positives/negatives can arise during volatile periods.
Overfitting Risks: Customized settings might work well historically but fail under different market conditions without careful validation.
Complexity: Multiple layers of smoothing and crossover logic require understanding to interpret correctly.
NOTES 🔍📝
Parameter Optimization: Experiment with various combinations of WR Period, Bull/Bear Thresholds, and TVMA Length to find what works best for specific assets and timeframes.
Regular Review: Continuously monitor the performance of the indicator versus actual outcomes, adjusting parameters as needed.
Educational Resources: Deepen your knowledge about oscillator strategies, particularly focusing on how they detect reversals and momentum shifts.
Consistency Key: For successful implementation, maintain consistent rules regarding trade entries/exits regardless of short-term fluctuations.
Eze Profit - VWAP + MACD Combined SignalThe Eze Profit - VWAP + MACD Combined Signal is an advanced trading tool designed to help traders align price trends with momentum confirmation for better decision-making. By combining Volume-Weighted Average Price (VWAP) and Moving Average Convergence Divergence (MACD), this indicator provides clear entry and exit signals, allowing traders to follow trends and take advantage of momentum shifts.
How It Works:
VWAP:
VWAP represents the average price of an asset, weighted by volume, over a specific period.
It acts as a dynamic support/resistance level and trend filter. Price above VWAP indicates bullish conditions, while price below VWAP suggests bearish conditions.
MACD:
MACD measures momentum through the difference between fast and slow exponential moving averages (EMAs).
Signals are generated when the MACD line crosses its signal line:
Bullish Crossover: Indicates increasing upward momentum.
Bearish Crossunder: Indicates increasing downward momentum.
Combined Logic:
Long Signal: Triggered when price is above VWAP, and MACD exhibits a bullish crossover.
Short Signal: Triggered when price is below VWAP, and MACD exhibits a bearish crossunder.
The script tracks the trader's "in-position" state to prevent redundant signals and ensure clarity.
How to Use:
Use this script to identify potential long and short trading opportunities:
Buy Signal: Enter a long position when the price moves above VWAP and MACD confirms bullish momentum.
Sell Signal: Exit or short when the price drops below VWAP and MACD confirms bearish momentum.
Combine with additional tools like support/resistance, volume analysis, or candlestick patterns for confirmation.
Features:
VWAP Trend Filter: Dynamically adjusts to the trading session to identify overall trend direction.
MACD Momentum Confirmation: Detects key momentum shifts with configurable settings for fast, slow, and signal lengths.
Position State Tracking: Avoids signal redundancy by monitoring open positions.
Buy/Sell Visualizations: Plots Buy/Sell signals directly on the chart for ease of use.
Alerts: Notifies traders in real-time when a long or short signal is triggered.
Customizable Settings:
MACD Fast Length, Slow Length, and Signal Smoothing parameters.
VWAP timeframe resolution to adapt to different trading styles (e.g., intraday or daily).
Credits:
This script is based on standard VWAP and MACD calculations provided by TradingView’s library and has been enhanced with unique logic for combined signal generation.
Notes:
This indicator is intended for educational purposes and should not be considered financial advice. Use it as part of a broader trading strategy alongside other tools for optimal results.

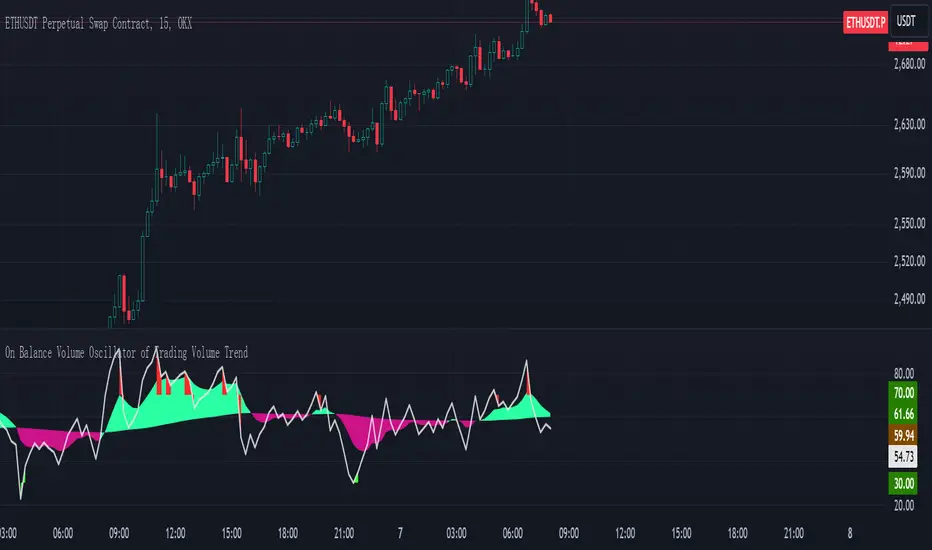
On Balance Volume Oscillator of Trading Volume TrendOn Balance Volume Oscillator of Trading Volume Trend
Introduction
This indicator, the "On Balance Volume Oscillator of Trading Volume Trend," is a technical analysis tool designed to provide insights into market momentum and potential trend reversals by combining the On Balance Volume (OBV) and Relative Strength Index (RSI) indicators.
Calculation and Methodology
* OBV Calculation: The indicator first calculates the On Balance Volume, which is a cumulative total of the volume of up days minus the volume of down days. This provides a running tally of buying and selling pressure.
* RSI of OBV: The RSI is then applied to the OBV values to smooth the data and identify overbought or oversold conditions.
* Exponential Moving Averages (EMAs): Two EMAs are calculated on the RSI of OBV. A shorter-term EMA (9-period in this case) and a longer-term EMA (100-period) are used to generate signals.
Interpretation and Usage
* EMA Crossovers: When the shorter-term EMA crosses above the longer-term EMA, it suggests increasing bullish momentum. Conversely, a downward crossover indicates weakening bullish momentum or increasing bearish pressure.
* RSI Divergences: Divergences between the price and the indicator can signal potential trend reversals. For example, if the price is making new highs but the indicator is failing to do so, it could be a bearish divergence.
* Overbought/Oversold Conditions: When the RSI of OBV is above 70, it suggests the market may be overbought and a potential correction could be imminent. Conversely, when it is below 30, it suggests the market may be oversold.
Visual Representation
The indicator is plotted on a chart with multiple lines and filled areas:
* Two EMAs: The shorter-term EMA and longer-term EMA are plotted to show the trend of the OBV.
* Filled Areas: The area between the two EMAs is filled with a color to indicate the strength of the trend. The color changes based on whether the shorter-term EMA is above or below the longer-term EMA.
* RSI Bands: Horizontal lines at 30 and 70 mark the overbought and oversold levels for the RSI of OBV.
Summary
The On Balance Volume Oscillator of Trading Volume Trend provides a comprehensive view of market momentum and can be a valuable tool for traders. By combining the OBV and RSI, this indicator helps identify potential trend reversals, overbought and oversold conditions, and the strength of the current trend.
Note: This indicator should be used in conjunction with other technical analysis tools and fundamental analysis to make informed trading decisions.
VWAP Bands [UAlgo]The "VWAP Bands " indicator is designed to provide traders with valuable insights into market trends and potential support/resistance levels using Volume Weighted Average Price (VWAP) bands. This indicator integrates the core concepts of VWAP with additional trend analysis features, making it a versatile tool for both range trading and trend-following strategies.
The VWAP bands are plotted based on the standard deviation multipliers, creating upper and lower bands around the VWAP. These bands serve as dynamic support and resistance levels. When the price approaches these bands, traders can anticipate potential reversals or continuations of the current trend. Additionally, the indicator provides visual cues for trend strength and potential trend changes, helping traders make informed decisions in various market conditions.
🔶 Settings
Source (Data Source): The data source for VWAP calculations. The default setting is the typical price (HLC3), which is the average of the high, low, and close prices.
Length: The number of bars used in the VWAP calculation. This determines the lookback period for the indicator.
Standard Deviation Multiplier: The multiplier applied to the standard deviation to create the primary upper and lower VWAP bands. This setting controls the distance of the bands from the VWAP.
Secondary Standard Deviation Multiplier: The multiplier applied to the standard deviation to create the secondary upper and lower VWAP bands, providing additional levels of support and resistance.
Display Trend: A toggle to enable or disable the display of the trend analysis feature. When enabled, the indicator highlights trend strength and potential trend changes.
Display Trend Crossovers: A toggle to enable or disable the display of trend crossover signals. When enabled, the indicator plots shapes to indicate where trend switches are likely occurring.
🔶 Calculations
The calculations behind the "VWAP Bands " indicator begin with determining the Volume Weighted Average Price (VWAP), which provides a comprehensive view of the average price of an asset, weighted by trading volume. This gives a more accurate representation of the asset's true average price over a specified period.
The first step in this process involves summing the trading volume over a chosen period, typically represented by the length parameter. Simultaneously, the product of the price (usually an average of the high, low, and close prices) and the trading volume is calculated and summed. By dividing this cumulative price-volume product by the total volume, we obtain the VWAP value. This VWAP serves as the central anchor around which the price action oscillates.
To enhance the utility of VWAP, we introduce standard deviation calculations. Standard deviation measures the extent of price dispersion from the VWAP, providing insight into price volatility. By calculating the variance (which involves the squared deviations of price) and then taking its square root, we derive the standard deviation. This helps in understanding how far prices typically stray from the VWAP.
With the VWAP and standard deviation in hand, we then establish upper and lower bands by adding and subtracting multiples of the standard deviation from the VWAP. These bands act as dynamic support and resistance levels, adapting to changes in market volatility. The primary bands, set by the first standard deviation multiplier, are augmented by secondary bands defined by a larger multiplier, offering additional layers of potential support and resistance.
It also integrates trend analysis, highlighting areas where the price action suggests a strong or weak trend. This is achieved by overlaying colored zones above and below the bands, indicating the strength and direction of the trend. When the price crosses these bands, it signals potential trend changes, aiding traders in making timely decisions.
🔶 Disclaimer
The "VWAP Bands " indicator is provided for educational and informational purposes only. It is not intended as financial advice and should not be construed as such.
Trading involves significant risk and may not be suitable for all investors. Before using this indicator or making any investment decisions, it is important to conduct thorough research and consider your financial situation.

Buy/Sell Aggregated Delta Pressure - InFinitoModified & Updated script from MARKET VOLUME by Ricardo M Arjona @XeL_Arjona that Includes Aggregated Volume , Delta Buy/Sell Pressure
Aggregation code originally from Crypt0rus
***The indicator can be used for any coin/symbol to aggregate volume , but it has to be set up manually***
***The indicator can be used with specific symbol data only by disabling the aggregation option, which allows for it to be used on any symbol***
- Calculated based on Aggregated Volume instead of by symbol volume . Using aggregated data makes it more accurate and allows to compare volume flow between different kinds of markets (Spot, Futures , Perpetuals, Futures+Perpetuals and All Volume ).
- As well, in order to make the data as accurate as possible, the data from each exchange aggregated is normalized to report always in terms of 1 BTC . In case this indicator is used for another symbol, the calculations can be adjusted manually to make it always report data in terms of 1 contract/coin.
- Buy/Sell Pressure: Smoothens the buy and sell volume into a signal for each. Which makes it easier to identify Buy and Sell Volume Flow.
- Buy/Sell Delta Pressure: Calculates the difference between Buy & Sell Pressure and plots a Delta signal that shows who is in control currently.
- Buy/Sell + Delta Pressure: Displays both Buy & Sell Pressure and Delta pressure. This can help to visualize who is in control but also how much pressure there is on each side.
- A Moving Average can be plotted to the Delta pressure. This, with confluence, can give great entries/exits
Things to look for:
- Divergences: If price keeps moving in one direction but the pressure to that side decreases it can be inferred that the move might slow down soon or revert. As well if pressure to one side increases but price does not react to it, it signals that the other side is stronger.
- MA/Zero Crossovers: Delta Pressure Crossover of its moving average or the 0 Line can indicate direction changes prematurely

Buyer vs Seller Control CompanionBuyer vs Seller Control Companion (Overlay)
Crossover signal overlay based on candlestick wick analysis moving averages
Overview:
This companion indicator displays crossover signals directly on the price chart based on the same buyer vs seller control calculations. It identifies moments when the relationship between buying and selling pressure shifts by analyzing where prices close relative to their intraday ranges.
Calculation Method:
The indicator uses identical calculations to the main Buyer vs Seller Control indicator:
Visual Components:
Lime Triangle Up: Appears below price bars when buyer control SMA crosses above seller control SMA
Fuchsia Triangle Down: Appears above price bars when seller control SMA crosses above buyer control SMA
Signal Logic:
Crossover events are detected when one moving average crosses above or below the other. These crossovers indicate potential shifts in the balance between buying and selling pressure as measured by candlestick closing positions relative to their wicks.
Arrow Placement:
Upward Triangle: Positioned below the bar when buyer control moving average exceeds seller control moving average
Downward Triangle: Positioned above the bar when seller control moving average exceeds buyer control moving average
Size: Small triangular shapes to avoid cluttering the price chart
Timing: Arrows appear only on bars where actual crossovers occur
Settings:
Moving Average Period: Adjustable from 1-200 periods (default: 20)
Technical Notes:
This overlay version works on any timeframe
Arrows only appear when crossovers actually occur, not on every bar
The indicator uses the same mathematical foundation as the main oscillator version
Signal frequency depends on the chosen moving average period
Shorter periods generate more frequent crossovers, longer periods generate fewer
Relationship to Main Indicator:
This companion overlay displays the exact crossover points that can be observed in the main Buyer vs Seller Control indicator. It provides the same information but presents it directly on the price chart for convenient reference without switching between indicator panes.
This overlay serves as a visual reference tool for crossover events detected in the underlying buyer vs seller control analysis.

AVGO Advanced Day Trading Strategy📈 Overview
The AVGO Advanced Day Trading Strategy is a comprehensive, multi-timeframe trading system designed for active day traders seeking consistent performance with robust risk management. Originally optimized for AVGO (Broadcom), this strategy adapts well to other liquid stocks and can be customized for various trading styles.
🎯 Key Features
Multiple Entry Methods
EMA Crossover: Classic trend-following signals using fast (9) and medium (16) EMAs
MACD + RSI Confluence: Momentum-based entries combining MACD crossovers with RSI positioning
Price Momentum: Consecutive price action patterns with EMA and RSI confirmation
Hybrid System: Advanced multi-trigger approach combining all methodologies
Advanced Technical Arsenal
When enabled, the strategy analyzes 8+ additional indicators for confluence:
Volume Price Trend (VPT): Measures volume-weighted price momentum
On-Balance Volume (OBV): Tracks cumulative volume flow
Accumulation/Distribution Line: Identifies institutional money flow
Williams %R: Momentum oscillator for entry timing
Rate of Change Suite: Multi-timeframe momentum analysis (5, 14, 18 periods)
Commodity Channel Index (CCI): Cyclical turning points
Average Directional Index (ADX): Trend strength measurement
Parabolic SAR: Dynamic support/resistance levels
🛡️ Risk Management System
Position Sizing
Risk-based position sizing (default 1% per trade)
Maximum position limits (default 25% of equity)
Daily loss limits with automatic position closure
Multiple Profit Targets
Target 1: 1.5% gain (50% position exit)
Target 2: 2.5% gain (30% position exit)
Target 3: 3.6% gain (20% position exit)
Configurable exit percentages and target levels
Stop Loss Protection
ATR-based or percentage-based stop losses
Optional trailing stops
Dynamic stop adjustment based on market volatility
📊 Technical Specifications
Primary Indicators
EMAs: 9 (Fast), 16 (Medium), 50 (Long)
VWAP: Volume-weighted average price filter
RSI: 6-period momentum oscillator
MACD: 8/13/5 configuration for faster signals
Volume Confirmation
Volume filter requiring 1.6x average volume
19-period volume moving average baseline
Optional volume confirmation bypass
Market Structure Analysis
Bollinger Bands (20-period, 2.0 multiplier)
Squeeze detection for breakout opportunities
Fractal and pivot point analysis
⏰ Trading Hours & Filters
Time Management
Configurable trading hours (default: 9:30 AM - 3:30 PM EST)
Weekend and holiday filtering
Session-based trade management
Market Condition Filters
Trend alignment requirements
VWAP positioning filters
Volatility-based entry conditions
📱 Visual Features
Information Dashboard
Real-time display of:
Current entry method and signals
Bullish/bearish signal counts
RSI and MACD status
Trend direction and strength
Position status and P&L
Volume and time filter status
Chart Visualization
EMA plots with customizable colors
Entry signal markers
Target and stop level lines
Background color coding for trends
Optional Bollinger Bands and SAR display
🔔 Alert System
Entry Alerts
Customizable alerts for long and short entries
Method-specific alert messages
Signal confluence notifications
Advanced Alerts
Strong confluence threshold alerts
Custom alert messages with signal counts
Risk management alerts
⚙️ Customization Options
Strategy Parameters
Enable/disable long or short trades
Adjustable risk parameters
Multiple entry method selection
Advanced indicator on/off toggle
Visual Customization
Color schemes for all indicators
Dashboard position and size options
Show/hide various chart elements
Background color preferences
📋 Default Settings
Initial Capital: $100,000
Commission: 0.1%
Default Position Size: 10% of equity
Risk Per Trade: 1.0%
RSI Length: 6 periods
MACD: 8/13/5 configuration
Stop Loss: 1.1% or ATR-based
🎯 Best Use Cases
Day Trading: Designed for intraday opportunities
Swing Trading: Adaptable for longer-term positions
Momentum Trading: Excellent for trending markets
Risk-Conscious Trading: Built-in risk management protocols
⚠️ Important Notes
Paper Trading Recommended: Test thoroughly before live trading
Market Conditions: Performance varies with market volatility
Customization: Adjust parameters based on your risk tolerance
Educational Purpose: Use as a learning tool and customize for your needs
🏆 Performance Features
Detailed performance metrics
Trade-by-trade analysis capability
Customizable risk/reward ratios
Comprehensive backtesting support
This strategy is for educational purposes. Past performance does not guarantee future results. Always practice proper risk management and consider your financial situation before trading.

Interval Price AlertsInterval Price Alerts
A versatile indicator that creates horizontal price levels with customizable alerts. Perfect for tracking multiple price levels simultaneously without having to create individual horizontal lines manually.
Features:
• Create evenly spaced price levels between a start and end price
• Customizable price interval spacing
• Optional price labels with flexible positioning
• Alert capabilities for both price crossovers and crossunders
• Highly customizable visual settings
Settings Groups:
1. Price Settings
• Start Price: The lower boundary for price levels
• End Price: The upper boundary for price levels
• Price Interval: The spacing between price levels
2. Line Style
• Line Color: Choose any color for the price level lines
• Line Style: Choose between Solid, Dashed, or Dotted lines
• Line Width: Adjustable from 2-4 pixels (optimized for opacity)
• Line Opacity: Control the transparency of lines (0-100%)
3. Label Style
• Show Price Labels: Toggle price labels on/off
• Label Color: Customize label text color
• Label Size: Choose from Tiny, Small, Normal, or Large
• Label Position: Place labels on Left or Right side
• Label Background: Set the background color
• Background Opacity: Control label background transparency
• Text Opacity: Adjust label text transparency
4. Alert Settings
• Alert on Crossover: Enable/disable upward price cross alerts
• Alert on Crossunder: Enable/disable downward price cross alerts
Usage Tips:
• Great for marking key price levels, support/resistance zones
• Useful for tracking multiple entry/exit points
• Perfect for scalping when you need to monitor multiple price levels
• Ideal for pre-market planning and level setting
Notes:
• Line width starts at 2 for optimal opacity rendering
• Labels can be fully customized or hidden completely
• Alert messages include the symbol and price level crossed

MACD Positive & Negative AlertThe MACD (Moving Average Convergence Divergence) is a momentum and trend-following indicator that helps traders identify the strength and direction of a trend, spot potential reversals, and fine-tune entry/exit timing.
Core Components
- MACD Line:
The difference between the 12-period and 26-period EMA (Exponential Moving Averages). This line highlights shifts in momentum and identifies the prevailing trend direction.
- Signal Line:
A 9-period EMA of the MACD line, acting as a trigger for buy/sell signals. When the MACD line crosses above the signal line, it suggests a bullish signal; when it crosses below, it suggests a bearish one.
- Histogram:
Shows the difference between the MACD line and the signal line as a bar graph. The histogram helps traders gauge the strength of the momentum and can warn of possible reversals. A rapidly growing histogram means strengthening momentum, while a shrinking one indicates weakening momentum.
Main Uses
- Trend Identification:
A positive MACD value typically signals a bullish trend, while a negative value signals a bearish trend.
- Momentum Analysis:
Divergences between MACD and price can warn of upcoming reversals. Increasing MACD histogram bars confirm strong momentum; shrinking bars suggest consolidation or reversal.
- Signal Generation:
Crossovers between the MACD line and the signal line generate trade signals—bullish (buy) if the MACD moves above the signal, bearish (sell) if it falls below l.
Example Interpretation
- MACD Crossover:
If the MACD line crosses above the signal line, it's often considered a buy signal; a cross below is a sell signal.
- Zero Line Cross:
If the MACD histogram moves from below zero to above, this is considered a bullish momentum shift; above zero to below is a bearish move.
The MACD is most effective in trending markets and should ideally be used alongside additional indicators for robust trading decisions.

Trend Fusion: ADX&EMA+Ichimoku (Custom)SAME AS THE ORIGINAL (WITHOUT BOTTOM PART)
Trend Fusion: ADX & EMA+Ichimoku is an innovative indicator designed to provide traders with comprehensive insights into market trends. Combining the power of the Average Directional Index (ADX) with Exponential Moving Averages (EMA) and the Ichimoku Cloud, this indicator offers a sophisticated approach to trend analysis.
This indicator stands out for its unique integration of multiple trend-following indicators, offering traders a holistic view of market dynamics. Unlike traditional trend indicators that focus solely on price movements, Trend Fusion incorporates the ADX, EMA, and Ichimoku Cloud to provide a more nuanced understanding of trend strength and direction. By combining these indicators, traders can make more informed decisions and enhance their trading strategies.
How it works:
Trend Fusion generates buy and sell signals based on the convergence of these indicators. A combination of strong ADX readings, EMA crossovers, and alignment with the Ichimoku Cloud confirms trend direction and provides entry and exit points for traders.
Average Directional Index (ADX): Measures the strength of the prevailing trend by analyzing price movements. A rising ADX indicates a strengthening trend, while a falling ADX suggests weakening momentum.
Exponential Moving Averages (EMA): Detects potential trend reversals through crossover signals. A bullish crossover (fast EMA crossing above slow EMA) suggests an uptrend, while a bearish crossover indicates a downtrend.
Ichimoku Cloud: Provides support and resistance levels along with trend direction. Price movements above the cloud indicate bullish sentiment, while movements below the cloud suggest bearish sentiment.
How to useColour codes:
Green Candles: Represent a strong uptrend, indicating robust buying momentum. The intensity of green color deepens with increasing trend strength.
Red Candles: Indicate a strong downtrend, signaling significant selling pressure in the market. The intensity of red color deepens with increasing trend strength.
Yellow Candles: Suggest a weak trend, characterized by indecision and lack of clear direction. The intensity of yellow color varies based on the strength of the trend, with lighter shades indicating weaker trends and darker shades suggesting slightly stronger trends.
Trend Strength: Monitor the ADX to gauge the strength of the prevailing trend. Higher ADX values indicate stronger trends, while lower values suggest weaker trends.
Trend Direction: Confirm trend direction using EMA crossovers and Ichimoku Cloud signals. Look for bullish crossovers and price movements above the cloud for uptrends, and bearish crossovers and movements below the cloud for downtrends.
Entry and Exit Signals: Enter trades when all components align, signaling a strong trend. Use EMA crossovers and cloud confirmations to identify potential entry points, and consider exiting trades when these signals reverse.
The ADX calculation and signal logic are based on the ADX script by PineCoders, with modifications to integrate it into this indicator.
The EMA crossover logic is adapted from the GDAX EMA Cross script by stefano98.
The Ichimoku Cloud calculation and plotting are adapted from the Ichimoku Cloud script by lonesometheblue.
Trading involves risk, and past performance is not indicative of future results. It is recommended to use this indicator alongside other technical analysis tools and risk management strategies.

Trend Fusion: ADX&EMA+IchimokuTrend Fusion: ADX & EMA+Ichimoku is an innovative indicator designed to provide traders with comprehensive insights into market trends. Combining the power of the Average Directional Index (ADX) with Exponential Moving Averages (EMA) and the Ichimoku Cloud, this indicator offers a sophisticated approach to trend analysis.
This indicator stands out for its unique integration of multiple trend-following indicators, offering traders a holistic view of market dynamics. Unlike traditional trend indicators that focus solely on price movements, Trend Fusion incorporates the ADX, EMA, and Ichimoku Cloud to provide a more nuanced understanding of trend strength and direction. By combining these indicators, traders can make more informed decisions and enhance their trading strategies.
How it works:
Trend Fusion generates buy and sell signals based on the convergence of these indicators. A combination of strong ADX readings, EMA crossovers, and alignment with the Ichimoku Cloud confirms trend direction and provides entry and exit points for traders.
Average Directional Index (ADX): Measures the strength of the prevailing trend by analyzing price movements. A rising ADX indicates a strengthening trend, while a falling ADX suggests weakening momentum.
Exponential Moving Averages (EMA): Detects potential trend reversals through crossover signals. A bullish crossover (fast EMA crossing above slow EMA) suggests an uptrend, while a bearish crossover indicates a downtrend.
Ichimoku Cloud: Provides support and resistance levels along with trend direction. Price movements above the cloud indicate bullish sentiment, while movements below the cloud suggest bearish sentiment.
How to use
Colour codes:
Green Candles: Represent a strong uptrend, indicating robust buying momentum. The intensity of green color deepens with increasing trend strength.
Red Candles: Indicate a strong downtrend, signaling significant selling pressure in the market. The intensity of red color deepens with increasing trend strength.
Yellow Candles: Suggest a weak trend, characterized by indecision and lack of clear direction. The intensity of yellow color varies based on the strength of the trend, with lighter shades indicating weaker trends and darker shades suggesting slightly stronger trends.
Trend Strength: Monitor the ADX to gauge the strength of the prevailing trend. Higher ADX values indicate stronger trends, while lower values suggest weaker trends.
Trend Direction: Confirm trend direction using EMA crossovers and Ichimoku Cloud signals. Look for bullish crossovers and price movements above the cloud for uptrends, and bearish crossovers and movements below the cloud for downtrends.
Entry and Exit Signals: Enter trades when all components align, signaling a strong trend. Use EMA crossovers and cloud confirmations to identify potential entry points, and consider exiting trades when these signals reverse.
The ADX calculation and signal logic are based on the ADX script by PineCoders, with modifications to integrate it into this indicator.
The EMA crossover logic is adapted from the GDAX EMA Cross script by stefano98.
The Ichimoku Cloud calculation and plotting are adapted from the Ichimoku Cloud script by lonesometheblue.
Trading involves risk, and past performance is not indicative of future results. It is recommended to use this indicator alongside other technical analysis tools and risk management strategies.

Ichimoku Slope Filtered Signals [UAlgo]
🔶Description:
The "Ichimoku Slope Filtered Signals" indicator is designed to provide trading signals based on the Ichimoku Cloud indicator while incorporating a slope filter. The Ichimoku Cloud is a comprehensive indicator that defines support and resistance, identifies trend direction, and provides trading signals. This script enhances the traditional Ichimoku Cloud signals by incorporating a slope filter, which helps to confirm the strength and direction of the trend.
🔶Key Features:
Ichimoku Cloud Parameters: Users can customize parameters such as Tenkan, Kijun, and Senkou Span lengths, along with multipliers, to adjust the sensitivity of the Ichimoku Cloud.
Slope Filter Settings: Users can specify the number of bars to measure the slope and the lookback period for trend measurement. Additionally, there are options to filter Ichimoku signals based on slope thresholds.
Normalized Slope: The indicator calculates the normalized slope of the selected data series (in this case, Tenkan-sen) and plots it alongside the Ichimoku Cloud.
Signal Generation: Trading signals are generated based on crossovers and crossunders of the Tenkan-sen and Kijun-sen lines of the Ichimoku Cloud. These signals can be further filtered based on the normalized slope of the selected data series.
🔶 Usage:
Customization: Traders can customize the parameters of the Ichimoku Cloud and slope filter according to their trading strategy and risk tolerance.
Interpretation of Signals:
Crossover: A buy signal is generated when the Tenkan-sen line crosses above the Kijun-sen line. This signal can be further filtered based on the normalized slope.
Crossunder: A sell signal is generated when the Tenkan-sen line crosses below the Kijun-sen line. Similar to the buy signal, this can also be filtered based on the normalized slope.
Trend Confirmation: The normalized slope provides additional confirmation of the strength and direction of the trend. A positive slope indicates an upward trend, while a negative slope indicates a downward trend.
Example:
Disclaimer:
Not Financial Advice: This script is provided for educational purposes only and should not be considered financial advice. Traders should conduct their own research and/or consult with a qualified financial advisor before making any investment decisions based on this script.
Risk of Loss: Trading in financial markets involves risk of loss, and past performance is not indicative of future results. Users of this script should be aware of the risks involved in trading and should only trade with capital they can afford to lose.
No Guarantees: There is no guarantee of success or profitability when using this script. Market conditions can change rapidly, and trading results may vary.
Use at Own Risk: The author of this script (UAlgo) does not assume any responsibility for losses incurred as a result of using this script. Traders use this script at their own risk and discretion.
Terms of Use: This script is subject to the terms of the Mozilla Public License 2.0. Users are encouraged to review the license terms before using or distributing the script.

Implied Orderblock Breaker (Zeiierman)█ Overview
The Implied Order Block Breaker (Zeiierman) is a tool designed to identify enhanced order blocks with imbalances. These enhanced order blocks represent areas where there is a rapid price movement. Essentially, this indicator uses order blocks and suggests that a swift price movement away from these levels, breaking the current market structure, could indicate an area that the market has not correctly valued. This technique offers traders a unique method to identify potential market inefficiencies and imbalances, serving as a guide for potential price revisits.
The indicator doesn't scan for imbalances in the traditional sense — where there's an absence of trades between two price levels — but instead, it identifies quick movements away from key levels that suggest where an imbalance might exist. Relying on crossovers and cross-unders in conjunction with pivot points and examining the high/low within the same period provides an innovative method for traders to spot these potentially undervalued or overvalued areas in the market. These inferred imbalances can be crucial for traders looking for price levels where the market might make significant moves.
█ How It Works
Bullish
Crossover: The closing price of a bar crosses above a pivot high, which is an indication that buyers are in control and pushing the price upwards.
New Low Within Period: There is a lower low within the same period as the pivot high. This suggests that after setting a high, the market pulled back to set a new low, potentially leaving a price gap on the way up as the price quickly recovers.
Bearish
Crossunder: The closing price of a bar crosses under a pivot low, indicating that sellers are taking control and driving the price down.
New High Within Period: There is a higher high within the same period as the pivot low. This condition suggests that the market rallied to a new high before falling back below the pivot low, potentially leaving a gap on the way down.
█ How to Use
The enhanced order blocks are often revisited, and the price may aim to 'fill' the potential imbalance created by the rapid price movement, thereby presenting traders with potential entry or exit points. This approach aligns with the idea that imbalances are frequently revisited by the market, and when combined with the context of Order Blocks, it provides even more confluence.
Example
Here, if the price drops rapidly after setting a new high—crossing under the pivot low—it may skip over certain price levels, creating a 'gap' that signifies an area where the price might have been overvalued (imbalance), which the market may revisit for a potential price correction or revaluation.
█ Settings
Period: Determines the number of bars used for identifying pivot highs and lows. A higher value gives more significant but less frequent signals, while a lower value increases sensitivity but might give more false positives.
Pivot Surrounding: Specifies the number of candles to analyze around a pivot point. Increasing this value broadens the analysis range, potentially capturing more setups but possibly including less significant ones.
-----------------
Disclaimer
The information contained in my Scripts/Indicators/Ideas/Algos/Systems does not constitute financial advice or a solicitation to buy or sell any securities of any type. I will not accept liability for any loss or damage, including without limitation any loss of profit, which may arise directly or indirectly from the use of or reliance on such information.
All investments involve risk, and the past performance of a security, industry, sector, market, financial product, trading strategy, backtest, or individual's trading does not guarantee future results or returns. Investors are fully responsible for any investment decisions they make. Such decisions should be based solely on an evaluation of their financial circumstances, investment objectives, risk tolerance, and liquidity needs.
My Scripts/Indicators/Ideas/Algos/Systems are only for educational purposes!

ema cross by himanshu and sunilCombined EMA & SuperTrend Indicator
The "Combined EMA & SuperTrend Indicator" is a powerful technical analysis tool designed to assist traders in identifying trends and potential entry/exit points in the markets. This indicator combines two popular indicators: Exponential Moving Averages (EMAs) and the SuperTrend indicator, providing a comprehensive view of market conditions.
Key Features:
EMA Visualization: The indicator plots both short-term and long-term Exponential Moving Averages (EMAs) on the chart. The EMAs help traders identify the underlying trend and potential reversals.
SuperTrend Indicator: The SuperTrend indicator is used to identify trends and potential stop-loss levels. The indicator adapts to changing market conditions by factoring in the Average True Range (ATR) and a user-defined factor.
Alerts: The indicator generates alerts for specific conditions, such as crossovers of the EMAs and SuperTrend direction changes. This helps traders stay informed about potential trading opportunities.
How to Use:
EMA Crossovers: Pay attention to the crossovers of the short-term and long-term EMAs. When the short-term EMA crosses above the long-term EMA, it may indicate a potential bullish trend. Conversely, when the short-term EMA crosses below the long-term EMA, it may suggest a bearish trend.
SuperTrend Direction: Watch the color of the SuperTrend line. A green line indicates an uptrend, while a red line suggests a downtrend. This can help you confirm the overall trend direction.
Alerts: Take advantage of the built-in alerts to receive notifications when significant events occur, such as EMA crossovers or SuperTrend direction changes. This can help you stay informed even when you're not actively monitoring the chart.
Usage:
Apply the "Combined EMA & SuperTrend Indicator" to any chart on TradingView to visualize the EMAs and SuperTrend lines.
Configure the EMA periods, ATR length, and SuperTrend factor according to your trading style and preferences.
Utilize the generated alerts to promptly react to potential trading opportunities.
Note: This indicator is intended for educational and informational purposes. Always perform thorough analysis and consider risk management practices before making trading decisions.
Disclaimer: This indicator does not guarantee profitable trades. Past performance is not indicative of future results. Trading involves risk, and you should only trade with funds you can afford to lose.

Multi-Symbol Trend DashboardMulti-Symbol Trend Dashboard - MA Cross Trend Monitor
Short Description
A customizable dashboard that displays trend direction across multiple symbols and timeframes using moving average crossovers.
Full Description
Overview
This Multi-Symbol Trend Dashboard allows you to monitor trend direction across 7 different symbols and 5 timeframes simultaneously in a single view. The dashboard uses moving average crossovers to determine trend direction, displaying bullish trends in green and bearish trends in red.
Key Features
Multi-Symbol Monitoring : Track up to 7 different trading instruments at once
Multi-Timeframe Analysis: View 5 different timeframes simultaneously for each instrument
Customizable Moving Averages: Choose between SMA, EMA, or WMA with adjustable periods
Visual Clarity: Color-coded cells provide immediate trend identification
Flexible Positioning: Place the dashboard anywhere on your chart
Customizable Appearance: Adjust sizes, colors, and text formatting
How It Works
The dashboard calculates a fast MA and slow MA for each symbol-timeframe combination. When the fast MA is above the slow MA, the cell shows green (bullish). When the fast MA is below the slow MA, the cell shows red (bearish).
Use Cases
Get a bird's-eye view of market trends across multiple instruments
Identify potential trading opportunities where multiple timeframes align
Monitor your watchlist without switching between charts
Spot divergences between related instruments
Track market breadth across sectors or related instruments
Notes and Limitations
Limited to 7 symbols and 5 timeframes due to TradingView's security request limits
Uses simple MA crossover as trend determination method
Dashboard is most effective when displayed on a dedicated chart
Performance may vary on lower-end devices due to multiple security requests
Settings Explanation
MA Settings: Configure the periods and types of moving averages
Display Settings: Adjust dashboard positioning and visual elements
Trading Instruments: Select which symbols to monitor (defaults to major forex pairs)
Timeframes: Choose which timeframes to display (default: M15, H1, H4, D1, W1)
Colors: Customize the color scheme for bullish/bearish indications and headers
This dashboard provides a straightforward way to maintain situational awareness across multiple markets and timeframes, helping traders identify potential setups and market conditions at a glance.
