Dynamic Momentum Oscillator (DMO) [Angel Algo]Dynamic Momentum Oscillator (DMO)
OVERVIEW: The Dynamic Momentum Oscillator (DMO) is a technical indicator designed to measure the momentum of price movements in financial markets. It combines momentum calculation with dynamic range assessment to provide insights into potential trend reversals and overbought/oversold conditions.
DMO is different from classic momentum oscillators like the RSI or Stochastic Oscillator because it looks at the momentum in relation to how much the price is moving. This helps it give signals that better match what's happening in the market, especially when the market's volatility is changing.
HOW TO USE:
Interpretation:
Thresholds: Horizontal lines mark user-defined threshold levels for overbought (OB) and oversold (OS) conditions, aiding in identifying potential trend pullbacks and reversals.
DMO Line: The primary line on the indicator plot. It reflects momentum in relation to the dynamic price range. Positive values indicate bullish momentum, while negative values indicate bearish momentum.
Filled Area: The area between the DMO line and the zero line is filled with color to enhance visualization of momentum shifts.
Trading Signals:
Thresholds: Monitor for potential trend reversals when the DMO crosses above the overbought threshold or below the oversold threshold.
Crossovers: Look for buy signals when the DMO line crosses above the zero and sell signals when it crosses below.
Filled Area: The green color indicates bullish momentum, red indicates bearish momentum and gray color indicates neutral conditions.
Signals: Circles appear on the chart when the DMO crosses the overbought or oversold thresholds, indicating conditions for potential trend pullbacks or reversals.
SETTINGS:
Length: Adjust the length parameter to vary the number of periods considered in the momentum calculation.
Smoothing: Enable or disable smoothing of the DMO line using the provided option.
Thresholds: Customize the overbought and oversold threshold levels to suit specific market conditions and trading preferences.
Disclaimer: The DMO indicator serves as part of a comprehensive trading strategy and should not be solely relied upon for trading decisions. Past performance is not indicative of future results, and trading involves inherent risks.
"crossover债券是什么"に関するスクリプトを検索

Multi-Band Breakout IndicatorThe Multi-Band Breakout Indicator was created to help identify potential breakout opportunities in the market. It combines multiple bands (ATR-Based and Donchian) and moving averages to provide valuable insights into the underlying trend and potential breakouts. By understanding the calculations, interpretation, parameter adjustments, potential applications, and limitations of the indicator, traders can effectively incorporate it into their trading strategy.
Calculation:
The indicator utilizes several calculations to plot the bands and moving averages. The length parameter determines the period used for the Average True Range (ATR), which measures volatility. A higher length captures a longer-term view of price movement, while a lower length focuses on shorter-term volatility. The multiplier parameter adjusts the distance of the upper and lower bands from the ATR. A higher multiplier expands the bands, accommodating greater price volatility, while a lower multiplier tightens the bands, reflecting lower volatility. The MA Length parameter determines the period for the moving averages used to calculate the trend and trend moving average. A higher MA Length creates a smoother trend line, filtering out shorter-term fluctuations, while a lower MA Length provides a more sensitive trend line.
The Donchian calculations in the Multi-Band Breakout Indicator play a significant role in identifying potential breakout opportunities and providing additional confirmation for trading signals. In this indicator, the Donchian calculations are applied to the trend line, which represents the average of the upper and lower bands. To calculate the Donchian levels, the indicator uses the Donchian Length parameter, which determines the period over which the highest high and lowest low are calculated. A longer Donchian Length captures a broader price range, while a shorter length focuses on more recent price action. By incorporating the Donchian calculations into the Multi-Band Breakout Indicator, traders gain an additional layer of confirmation for breakout signals.
Interpretation:
The Multi-Band Breakout Indicator offers valuable interpretation for traders. The upper and lower bands represent dynamic levels of resistance and support, respectively. These bands reflect the potential price range within which the asset is expected to trade. The trend line is the average of these bands and provides a central reference point for the overall trend. When the price moves above the upper band, it suggests a potential overbought condition and a higher probability of a pullback. Conversely, when the price falls below the lower band, it indicates a potential oversold condition and an increased likelihood of a bounce. The trend moving average further smooths the trend line, making it easier to identify the prevailing direction.
The crossover of the trend line (representing the average of the upper and lower bands) and the trend moving average holds a significant benefit for traders. This crossover serves as a powerful signal for potential trend changes and breakout opportunities in the market. When the trend line crosses above the trend moving average, it suggests a shift in momentum towards the upside, indicating a potential bullish trend. This provides traders with an early indication of a possible upward movement in prices. Conversely, when the trend line crosses below the trend moving average, it indicates a shift in momentum towards the downside, signaling a potential bearish trend. This crossover acts as an early warning for potential downward price movement. By identifying these crossovers, traders can capture the initial stages of a new trend, enabling them to enter trades at favorable entry points and potentially maximize their profit potential.
Breakout Signals:
For bullish breakouts, the indicator looks for a bullish crossover between the trend line and the trend moving average. This crossover suggests a shift in momentum towards the upside. Additionally, it checks if the current price has broken above the upper band and the previous Donchian high. This confirms that the price is surpassing a previous resistance level, indicating further upward movement.
For bearish breakouts, the indicator looks for a bearish crossunder between the trend line and the trend moving average. This crossunder indicates a shift in momentum towards the downside. It also checks if the current price has broken below the lower band and the previous Donchian low. This confirms that the price is breaking through a previous support level, signaling potential downward movement.
When a bullish or bearish breakout is detected, it suggests a potential trading opportunity. Traders may consider initiating positions in the direction of the breakout, anticipating further price movement in that direction. However, it's important to remember that breakouts alone do not guarantee a successful trade. Other factors, such as market conditions, volume, and confirmation from additional indicators, should be taken into account. Risk management techniques should also be implemented to manage potential losses.
Coloration:
The coloration in the Multi-Band Breakout Indicator is used to visually represent different aspects of the indicator and provide valuable insights to traders. Let's break down the coloration components:
-- Trend/Basis Color : The tColor variable determines the color of the bars based on the relationship between the trend line (trend) and the closing price (close), as well as the relationship between the trend line and the trend moving average (trendMA). If the trend line is above the closing price and the trend moving average is also above the closing price, the bars are colored fuchsia, indicating a potential bullish trend. If the trend line is below the closing price and the trend moving average is also below the closing price, the bars are colored lime, indicating a potential bearish trend. If neither of these conditions is met, the bars are colored yellow, representing a neutral or indecisive market condition.
-- Moving Average Color : The maColor variable determines the color of the filled area between the trend line and the trend moving average. If the trend line is above the trend moving average, the area is filled with a lime color with 70% opacity, indicating a potential bullish trend. Conversely, if the trend line is below the trend moving average, the area is filled with a fuchsia color with 70% opacity, indicating a potential bearish trend. This coloration helps traders visually identify the relationship between the trend line and the trend moving average.
-- highColor and lowColor : The highColor and lowColor variables determine the colors of the high Donchian band (hhigh) and the low Donchian band (llow), respectively. These bands represent dynamic levels of resistance and support. If the highest point in the previous Donchian period (hhigh) is above the upper band, the highColor is set to olive with 90% opacity, indicating a potential resistance level. On the other hand, if the lowest point in the previous Donchian period (llow) is below the lower band, the lowColor is set to red with 90% opacity, suggesting a potential support level. These colorations help traders quickly identify important price levels and assess their significance in relation to the bands.
By incorporating coloration, the Multi-Band Breakout Indicator provides visual cues to traders, making it easier to interpret the relationships between various components and assisting in identifying potential trend changes and breakout opportunities. Traders can use these color cues to quickly assess the prevailing market conditions and make informed trading decisions.
Adjusting Parameters:
The Multi-Band Breakout Indicator offers flexibility through parameter adjustments. Traders can customize the indicator based on their preferences and trading style. The length parameter controls the sensitivity to price changes, with higher values capturing longer-term trends, while lower values focus on shorter-term price movements. By adjusting the parameters, such as the ATR length, multiplier, Donchian length, and MA length, traders can customize the indicator to suit different timeframes and trading strategies. For shorter timeframes, smaller values for these parameters may be more suitable, while longer timeframes may require larger values.
Potential Applications:
The Multi-Band Breakout Indicator can be applied in various trading strategies. It helps identify potential breakout opportunities, allowing traders to enter trades in the direction of the breakout. Traders can use the indicator to initiate trades when the price moves above the upper band or below the lower band, confirming a potential breakout and providing a signal to enter a trade. Additionally, the indicator can be combined with other technical analysis tools, such as support and resistance levels, candlestick patterns, or trend indicators, to increase the probability of successful trades. By incorporating the Multi-Band Breakout Indicator into their trading approach, traders can gain a better understanding of market trends and capture potential profit opportunities.
Limitations:
While the Multi-Band Breakout Indicator is a useful tool, it has some limitations that traders should consider. The indicator performs best in trending markets where price movements are relatively strong and sustained. During ranging or choppy market conditions, the indicator may generate false signals, leading to potential losses. It is crucial to use the indicator in conjunction with other analysis techniques and risk management strategies to enhance its effectiveness. Additionally, traders should consider external factors such as market news, economic events, and overall market sentiment when interpreting the signals generated by the indicator.
By combining multiple bands and moving averages, this indicator offers valuable insights into the underlying trend and helps traders make informed trading decisions. With customization options and careful interpretation, this indicator can be a valuable addition to any trader's toolkit, assisting in identifying potential breakouts, capturing profitable trades, and enhancing overall trading performance.

SAR MACDSAR MACD is an idea of implementing Directional MACD with Parabolic SAR to exactly detect and confirm Trend. This p-SAR MACD consist of a HYBRID MACD which acts as MACD TREND oscillator, MACD Oscillator, PSAR Indicator combined with MA line. thus Fake MACD Signals can be eliminated using this SAR MACD. Sideways can be detected using Threshold Levels must be adjusted based on timeframe.
Indicators Hybrid model contains:
1.MACD (12,26,9) Standard with MA Crossovers
2.MACD Trend
3.Parabolic SAR with 0.02
4.Threshold level - indicates Sideways
How to use.
Histogram:
-> HIST MODE: normal MACD indicator
MA Line Color is based on PSAR Direction Blue-Up/ Pink -Down
A crossover upside with a Blue MA line denotes Up confirmation
A Crossover downwards with a red MA line denotes Down Confirmation
Additionally Histogram above zero line and below zero line are to be confirmed
-> MACD MODE: MACD Trend indicator
MA Line Color is based on PSAR Direction Blue-Up/ Pink -Down
A crossover upside with a Blue MA line denotes Up confirmation
A Crossover downwards with a red MA line denotes Down Confirmation
Additionally Histogram above zero line and below zero denotes long term Trend
-> Histogram Color: Indicates candles direction
Yellow indicates Unconfirmed Direction
Green Indicates up direction
Red Indicates Down Direction
Buy Condition:
MA Color - Blue
Histogram- Above Zero
Histogram/Candle -Green
MA Crossover is must
Sell Condition:
MA Color - Red
Histogram- Below Zero
Histogram/Candle -Red
MA Cross under is must
Warning: Must not be used as a standalone indicator. Use for confirmation of your Buy Sell Signals and Entry only.

GT 5.1 Strategy═════════════════════════════════════════════════════════════════════════
█ OVERVIEW
People often look an indicator in their technical analysis to enter a position. We may also need to look at the signals of one or more indicators to verify the signals given by some indicators. In this context, I developed a strategy to test whether it really works by choosing some of the indicators that capture trend changes with the same characteristics. Also, since the subject is to catch the trend change, I thought it would be right to include an indicator using the heikin ashi logic. By averaging and smoothing the market noise, Heiken Ashi makes it easier to detect the direction of the trend helps to see possible reversal points on the chart. However, it should be noted that Heiken Ashi is a lagging indicator.
I picked 5 different indicators (but their purpose are similar) and combined them to produce buy and sell signals based on your choice(not repaint). First of all let's get some information about our indicators. So you will understand me why i picked these indicators and what is the meaning of their signals.
1 — Coral Trend Indicator by LazyBear
Coral Trend Indicator is a linear combination of moving averages, all obtained by a triple or higher order exponential smoothing. The indicator comes with a trend indication which is based on the normalized slope of the plot. the usage of this indicator is simple. When the color of the line is green that means the market is in uptrend. But when the color is red that means the market is in downtrend.
As you see the original indicator it is simple to find is it in uptrend or downtrend.
So i added a code to find when the color of the line change. When it turns green to red my script giving sell signals, when it turns red to green it gives buy signals.
I hide the candles to show you more clearly what is happening when you choose only Coral Strategy. But sometimes it is not enough only using itself. Even if green dots turn to red it continues in uptrend. So we need a to look another indicator to approve our signal.
2 — SSL channel by ErwinBeckers
Known as the SSL , the Semaphore Signal Level channel is an indicator that combines moving averages to provide you with a clear visual signal of price movement dynamics. In short, it's designed to show you when a price trend is forming. This indicator creates a band by calculating the high and low values according to the determined period. Simply if you decide 10 as period, it calculates a 10-period moving average on the latest 10 highs. Calculate a 10-period moving average on the latest 10 lows. If the price falls below the low band, the downtrend begins, if the price closes above the high band, the uptrend begins. Lets look the original form of indicator and learn how it using.
If the red line is below and the green band is above, it means that we are in uptrend, and if it is on the opposite side, it means that we are in downtrend. Therefore, it would be logical to enter a position where the trend has changed. So i added a code to find when the crossover has occured.
As you see in my strategy, it gives you signals when the trend has changed. But sometimes it is not enough only using this indicator itself. So lets look 2 indicator together in one chart.
Look circle SSL is saying it is in downtrend but Coral is saying it has entered in uptrend. if we just look to coral signal it can misleads us. So it can be better to look another indicator for validating our signals.
3 — Heikin Ashi RSI Oscillator by JayRogers
The Heikin-Ashi technique is used by technical traders to identify a given trend more easily. Heikin-Ashi has a smoother look because it is essentially taking an average of the movement. There is a tendency with Heikin-Ashi for the candles to stay red during a downtrend and green during an uptrend, whereas normal candlesticks alternate color even if the price is moving dominantly in one direction. This indicator actually recalculates the RSI indicator with the logic of heikin ashi. Due to smoothing, the bars are formed with a slight lag, reflecting the trend rather than the exact price movement. So lets look the original version to understand more clearly. If red bars turn to green bars it means uptrend may begin, if green bars turn to red it means downtrend may begin.
As you see HARSI giving lots of signal some of them is really good but some of them are not very well. Because it gives so much signals Now i will change time period and lets look same chart again.
Now results are better because of heikin ashi's logic. it is not suitable for day traders, it gives more accurate result when using the time period is longer. But it can be useful to use this indicator in short time periods using with other indicators. So you may catch the trend changes more accurately.
4 — MACD DEMA by ToFFF
This indicator uses a double EMA and MACD algorithm to analyze the direction of the trend. Though it might seem a tough task to manage the trades with the help of MACD DEMA once you know how the proper way to interpret the signal lines, it will be an easy task.
This indicator also smoothens the signal lines with the time series algorithm which eventually makes the higher time frame important. So, expecting better results in the lower time frame can result in big losses as the data reading from the MACD DEMA will not be accurate. In order to understand the function of this indicator, you have to know the functions of the EMA also.
The exponential moving average tends to give more priority to the recent price changes. So, expecting better results when the volatility is very high is a very risky approach to trade the market. Moreover, the MACD has some lagging issues compared to the EMA, so it is super important to use a trading method that focuses on the higher time frame only. What does MACD 12 26 Close 9 mean? When the DEMA-9 crosses above the MACD(12,26), this is considered a bearish signal. It means the trend in the stock – its magnitude and/or momentum – is starting to shift course. When the MACD(12,26) crosses above the DEMA-9, this is considered a bullish signal. Lets see this indicator on Chart.
When the blue line crossover red line it is good time to buy. As you see from the chart i put arrows where the crossover are appeared.
When the red line crossover blue line it is good time to sell or exit from position.
5 — WaveTrend Oscillator by LazyBear
This is a technical indicator that creates high and low bands between two values. It then creates a trend indicator that draws waves with highs and lows within these boundaries. WaveTrend is a widely used indicator for finding direction of an asset.
Calculation period: number of candles used to calculate WaveTrend, defaults to 10. Averaging period: number of candles used to average WaveTrend, defaults to 21.
As you see in chart when the lines crossover occured my strategy gives buy or sell signals.
═════════════════════════════════════════════════════════════════════════
█ HOW TO USE
I hope you understand how the indicators I mentioned above work and what they are used for. Now, I will explain in detail how to use the strategy I have created.
When you enter the settings section, you will see 5 types of indicators. If you want to use the signals of the indicators, simply tick the box next to the indicators. Also, under each option there is an area where you can set the "lookback". This setting is a field that will make the signals overlap when you select more than one option. If you are going to trade with only one option, you should make sure that this field is 0. Otherwise, it may continue to generate as many signals as you choose.
Lets see in chart for easy understanding.
As you see chart, if i chose only HARSI with lookback 0 (HARSI and CORAL should be 1 minumum because of algorithm-we looking 1 bar before, others 0 because we are looking crossovers), it will give signals only when harsı bar's color changed. But when i changed Lookback as 7 it will be like this in chart.
Now i will choose 2 indicator with settings of their lookback 0.
As you see it will give signals when both of them occurs same time. But HARSI is an indicator giving very early signal so we can enter position 5-6 bars after the first bar color change. So i will change HARSI Lookback settings as 7. Lets look what happens when we use lookback option.
So it wil be useful to change lookback settings to find best signals in each time period and in each symbol. But it shouldnt be too high. Because you can be late to catch trend's starting.
this is an image of MACD and WAVE trend used and lookback option are both 6.
Now lets see an example with 3 options are chosen with lookback option 11-1-5
Now lets talk about indicators settings. After strategy options you will see each indicators settings, you can change their settings as you desired. So each indicators signal will be changed according to your adjustment.
I left strategy options with default settings. You can change it manually as if you want.
═════════════════════════════════════════════════════════════════════════
█ LIMITATIONS: Don't rely on non-standard charts results. For example Heikin Ashi is a technical analysis method used with the traditional candlestick chart.Heikin Ashi vs. Candlestick Chart: The decisive visual difference between Heikin Ashi and the traditional chart is that Heikin Ashi flattens the traditional candlestick chart using a modified formula.
The primary advantage of Heikin Ashi is that it makes the chart more reader-friendly and helps users identify and analyze trends .
Because Heikin Ashi provides averaged price information rather than real-time price and reacts slowly to volatility — not suitable for scalpers and high-frequency traders. I added HARSI indicator as a supportive signal because it is useful with using CORAL and SSL channel indicators. If you change your candle types to Heikin Ashi , your profit will change in good way but dont rely on it.
═════════════════════════════════════════════════════════════════════════
█ THANKS:
Special thanks to authors of the scripts that i used.
@LazyBear and @ErwinBeckers and @JayRogers and @ToFFF
═════════════════════════════════════════════════════════════════════════
█ DISCLAIMER
Any trade decisions you make are entirely your own responsibility.

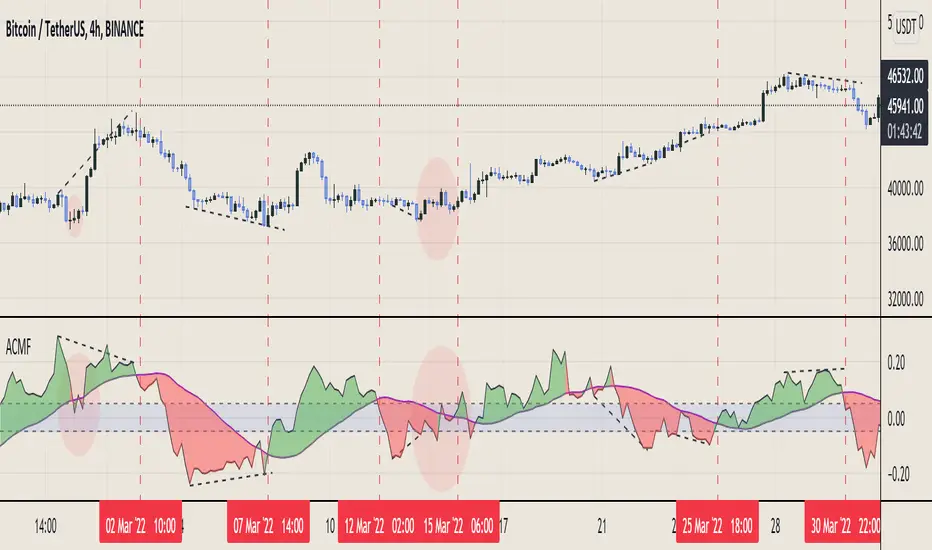
Aggregated Chaikin Money Flow - InFinitoModified Version of In-Built Chaikin Money Flow Indicator. Aggregated Volume is used for it's calculation + a couple of other features.
Aggregation code originally from Crypt0rus
***The indicator can be used for any coin/symbol to aggregate volume , but it has to be set up manually***
***The indicator can be used with specific symbol data only by disabling the aggregation option, which allows for it to be used on any symbol***
- Calculated based on Aggregated Volume instead of by symbol volume. Using aggregated data makes it more accurate and allows to compare volume flow between different kinds of markets (Spot, Futures , Perpetuals, Futures+Perpetuals and All Volume ).
- As well, in order to make the data as accurate as possible, the data from each exchange aggregated is normalized to report always in terms of 1 BTC. In case this indicator is used for another symbol, the calculations can be adjusted manually to make it always report data in terms of 1 contract/coin.
- Added Moving Average ( SMA , EMA , WMA , RMA, VWMA) that can be plotted to the CMF
- Changed 0 line to a small range which tends to be more relevant than the 0 line. This range can be manually modified
Things to look for:
- Divergences: Can be a very good reversal signal
- MA crossovers: Can be a very good confluent Buy/Sell signal
- Center range retests: CMF is normally defined as bullish above 0 and bearish below 0. In this case it is above or below the middle range. Even if the start of the move was missed. The retest of the middle range can give very good entries.
- Confluence of the latter
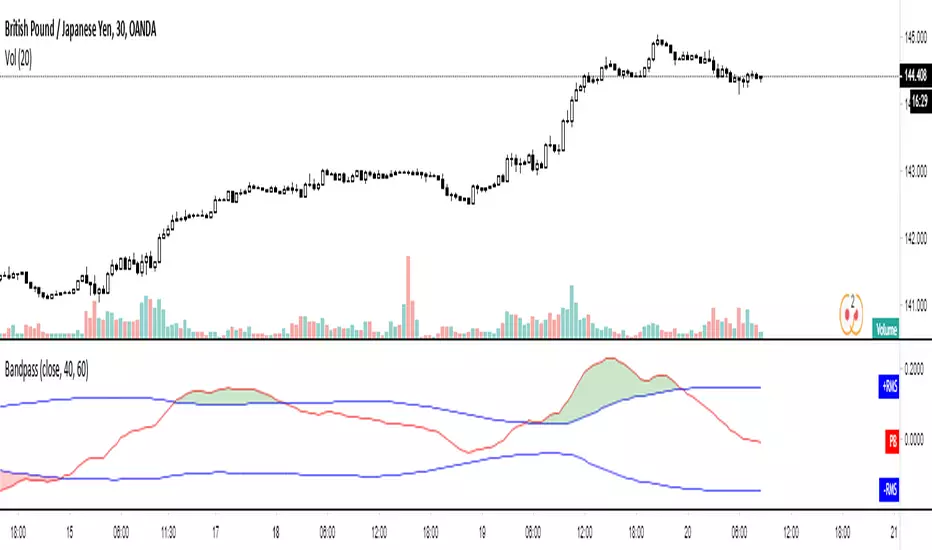
Bandpass Cycle Indicator [Ehlers]This indicator is NOT used for entry and exit conditions when trading. Instead, it's purpose is to tell you what the state of the market is: trending or cyclical.
>WHO IS THIS FOR?
This is especially useful for strategies that use scalping or martingale betting to turn a profit. You don't want to be caught in a bullish trend with several open short orders. Algo traders welcome.
>HOW DOES IT WORK?
I'm glad you asked. It's based on Ehlers' work regarding signal filtering. Essentially, it uses a bandpass filter to reduce noise that is inherent in the market and display the underlying frequency.
First, we get rid of the high-frequency noise - think jitters, long wicks, etc... price action that usually effects EMAs and other MAs. We don't want any of that.
Next, we get rid of low-frequency noise - this is a little more difficult to picture, but we're essentially ignoring cycles (Elliot waves) from other longer time frames. We don't care if the Daily bars are just about to reverse if it doesn't affect our scalping strategy.
Finally, we find the root mean square (RMS) of the high and low points of our newly created signal (red) and plot them (black). These will act as triggers to tell us if a market is in cycle or trending.
>HOW DO YOU READ IT?
Background colors:
-Blue is cycle - you're safe.
-Red is trending down
-Green is trending up
Crossovers:
-Red above Upper Black: Uptrend
-Red below Lower Black: Downtrend
-Red in the middle: Cycle
>IS IT PREDICTIVE?
Momentum tends to pick up quickly and decline quickly, so if you'll often see a small Red or Green strip before a large price movement.
After long periods of cyclic movement (or consolidation), there isn't much momentum in the system, so any small price action will be considered a trend -> these small movements are picked up by other human traders and bots. Trading volume increases more and more until you have a swing in one direction.
So yes, it can be predictive due to the nature of signals and oscillation. Maybe not necessarily predictive of which direction price will go, but when volatility is about to increase.
Ehlers MESA Adaptive Moving Average [LazyBear]Another one to add to Ehlers collection.
The MESA Adaptive Moving Average (MAMA) adapts to price movement based on the rate of change of phase as measured by the Hilbert Transform Discriminator. This method features a fast attack average and a slow decay average so that composite average rapidly ratchets behind price changes and holds the average value until the next ratchet occurs. Consider FAMA (Following AMA) as the signal.
Here are some of the options:
Fill MAMA/FAMA region (ribbon mode):
Mark Crossovers:
The above options (along with the bar colors) allow this to be used as a standalone system.
BTW, John Ehlers calls MAMA, "Mother of all Adaptive Moving Averages", lemme know what you think :)
More info:
- MESA Adaptive Moving Average, Stocks and Commodities Magazine, August 2001
- MAMA: www.mesasoftware.com
List of my public indicators: bit.ly
List of my app-store indicators: blog.tradingview.com

Mickey's EMAMickey’s EMA is a lightweight, overlay indicator that combines two Exponential Moving Averages (EMAs) with automatic entry, stop-loss and target visual signals—plus dynamic JSON alerts for seamless webhook integration. It’s designed for both day-traders and swing-traders who want clear, on-chart cues and fully-customizable risk parameters.
🔍 Overview
Dual EMAs (fast & slow) to capture trend changes.
Automated “BUY” / “SELL” markers at every EMA crossover.
Customizable Stop-Loss % and Target % levels, plotted as ❌ and 🎯 bubbles.
“SL Hit (Custom)” if the opposite EMA crossover occurs before price touches your stop level.
JSON-formatted alerts containing ticker, instrument type, timeframe, trend (“CE” for bullish, “PE” for bearish), and price—ready for webhooks.
⚙️ Inputs
| Setting | Default | Description |
| ------------------------ | ------- | ----------------------------------------------- |
| **Fast EMA Length** | 20 | Period for the faster EMA. |
| **Slow EMA Length** | 200 | Period for the slower EMA. |
| **Price Source** | Close | Data series to calculate EMAs on. |
| **Custom Stop Loss %** | 0.1% | Stop-loss level as a percentage of entry price. |
| **Target %** | 0.5% | Profit-target level as a percentage of entry. |
| **Show Entry/SL/Target** | ON | Toggle all entry, SL and target visuals. |
📊 What It Plots
Fast EMA (blue) & Slow EMA (white) overlayed on price.
BUY 🟢 label below bar when Fast EMA crosses above Slow EMA.
SELL 🔴 label above bar when Fast EMA crosses below Slow EMA.
❌ (Custom) bubble at entry price if an opposite EMA crossover occurs before price hits your custom stop-loss.
❌ bubble at the stop-loss price when price actually breaches the stop level.
🎯 bubble at target price when price first reaches your profit-target level.
🔔 Alerts & Webhooks
On-screen alert conditions “Mickey’s EMA → BUY” and “Mickey’s EMA → SELL” appear in the Create-Alert dialog.
Dynamic JSON payload sent via alert() when a crossover fires, e.g.:
{
"script": "AAPL",
"scriptType": "equity",
"instrumentType": "NASDAQ",
"timeframe": "5",
"trend": "CE",
"price": 174.25
}
Use these alerts to integrate with bots, chat systems, manual, or any webhook-driven workflow.
🚀 Why Use Mickey’s EMA?
Clarity & Precision: All signals appear exactly at the EMA or price-level of interest.
Custom Risk Management: Define your own stop-loss and target percentages.
Seamless Automation: Dynamic JSON alerts mean zero manual setup for webhooks.
Versatile: Equally effective on intraday charts or daily/weekly timeframes.
Add Mickey’s EMA to your TradingView chart today and get instant, aesthetically-pleasing guidance on trend entries, risk exits, and profit targets—all in one elegant overlay.

Custom EMA High/Low & SMA - [GSK-VIZAG-AP-INDIA] Custom EMA High/Low & SMA -
1. Overview
This indicator overlays a dynamic combination of Exponential Moving Averages (EMA) and Simple Moving Average (SMA) to identify momentum shifts and potential entry/exit zones. It highlights bullish or bearish conditions using color-coded SMA logic and provides visual Buy/Sell signals based on smart crossover and state-based logic.
2. Purpose / Use Case
Designed for traders who want to visually identify momentum breakouts, trend reversals, or pullback opportunities, this tool helps:
Spot high-probability buy/sell zones
Confirm price strength relative to volatility bands (EMA High/Low)
Time entries based on clean visual cues
It works well in trend-following strategies, particularly in intraday or swing setups across any liquid market (indices, stocks, crypto, etc.).
3. Key Features & Logic
✅ EMA High/Low Channel: Acts as dynamic support/resistance boundaries using 20-period EMAs on high and low prices.
✅ Timeframe-Specific SMA: A 33-period SMA calculated from a user-defined timeframe (default: 10-minute) for flexible multi-timeframe analysis.
✅ Signal Generation:
Buy: When SMA drops below EMA Low and close is above EMA High.
Sell: When SMA rises above EMA High and price closes below both EMAs.
Optionally, signals also fire based on SMA color changes (green = bullish, red = bearish).
✅ Strict or Loose Signal Logic: Choose between precise crossovers or broader state-based conditions.
✅ Debugging Tools: Optional markers for granular insight into condition logic.
4. User Inputs & Settings
Input Description
EMA High Length Period for EMA of high prices (default: 20)
EMA Low Length Period for EMA of low prices (default: 20)
SMA Length Period for Simple Moving Average (default: 33)
SMA Timeframe Timeframe for SMA (default: “10”)
Show Buy/Sell Arrows Enable visual arrow signals for Buy/Sell
Strict Signal Logic ON = crossover-based signals; OFF = state logic
Plot Signals on SMA Color Change Enable signals on SMA color shifts (Green/Red)
Show Debug Markers Plot small markers to debug condition logic
5. Visual Elements Explained
🔵 EMA High Line – Blue line marking dynamic resistance
🔴 EMA Low Line – Red line marking dynamic support
🟡 SMA Line – Color-coded based on position:
Green if SMA < EMA Low (Bullish)
Red if SMA > EMA High (Bearish)
Yellow otherwise (Neutral)
✅ BUY / SELL Labels – Displayed below or above candles on valid signals
🛠️ Debug Circles/Triangles – Help visually understand the signal logic when enabled
6. Usage Tips
Best used on 5–30 min timeframes for intraday setups or 1H+ for swing trades.
Confirm signals with volume, price action, or other confluences (like support/resistance).
Use strict mode for more accurate entries, and non-strict mode for broader trend views.
Ideal for identifying pullbacks into trend, or early reversals after volatility squeezes.
7. What Makes It Unique
Multi-timeframe SMA integrated with EMA High/Low bands
Dual signal logic (crossover + color shift)
Visually intuitive and beginner-friendly
Minimal clutter with dynamic signal labeling
Debug mode for transparency and learning
8. Alerts & Automation
The indicator includes built-in alert conditions for:
📈 Buy Alert: Triggered when a bullish condition is detected.
🔻 Sell Alert: Triggered when bearish confirmation is detected.
These alerts can be used with TradingView's alert system for real-time notifications or bot integrations.
9. Technical Concepts Used
EMA (Exponential Moving Average): Reacts faster to recent price, ideal for trend channels
SMA (Simple Moving Average): Smoother average for detecting general trend direction
Crossover Logic: Checks when SMA crosses over or under EMA levels
Color Coding: Visual signal enhancement based on relative positioning
Multi-Timeframe Analysis: SMA calculated on a custom timeframe, powerful for confirmation
10. Disclaimer
This script is for educational and informational purposes only. It is not financial advice. Always backtest thoroughly and validate on demo accounts before applying to live markets. Trading involves risk, and past performance does not guarantee future results.
11. Author Signature
📌 Indicator Name: Custom EMA High/Low & SMA -
👤 Author: GSK-VIZAG-AP-INDIA

MFI + RSI + EMA Dynamic SignalsThe MFI + RSI + EMA Dynamic Signals is a designed to combine with widened criteria to capture more trading opportunities, it balances momentum, trend, and flexibility, making it suitable for trading on timeframes like 15-minute to 4-hour charts.
How It Works
The indicator uses three technical components with relaxed criteria to produce signals:
Money Flow Index (MFI) for Momentum Extremes:
The MFI, calculated over a 14-period length, measures buying and selling pressure using price and volume. A buy signal can trigger when MFI crosses above the oversold level (default: 30, widened from 20), indicating potential buying pressure, while a sell signal can occur when MFI crosses below the overbought level (default: 70, widened from 80), suggesting selling pressure.
Relative Strength Index (RSI) for Momentum Confirmation:
The RSI, calculated over a 14-period length, confirms momentum strength. Bullish momentum is confirmed when RSI is above a buy threshold (default: 45, relaxed from 50), and bearish momentum when below a sell threshold (default: 55, relaxed from 50), allowing more signals near neutral momentum levels.
Exponential Moving Average (EMA) for Trend Sensitivity:
The indicator uses a fast EMA (default: 9 periods) and a slow EMA (default: 21 periods) to detect trend direction and crossovers. Signals can trigger when the fast EMA crosses the slow EMA, or when the fast EMA is within a proximity threshold (default: 0.5%) of the slow EMA, capturing early trend changes and increasing signal frequency.
Signal Generation
Signals are generated using the previous bar’s values to prevent repainting, with widened criteria for more frequent triggers:
Buy Signal: Either the MFI crosses above the oversold level or the fast EMA crosses above the slow EMA, and either RSI confirms bullish momentum (above 45) or the EMAs are near a crossover (within 0.5%). Displayed as a green upward triangle below the bar.
Sell Signal: Either the MFI crosses below the overbought level or the fast EMA crosses below the slow EMA, and either RSI confirms bearish momentum (below 55) or the EMAs are near a crossover (within 0.5%). Displayed as a red downward triangle above the bar.

US30 HMA Signal v2.8Indicator Description – US30 HMA Signal v2.8
Overview:
The US30 HMA Signal indicator is designed to generate Buy and Sell signals based on the crossover of three Hull Moving Averages (HMAs). The indicator focuses on identifying momentum shifts and directional bias using the 9, 21, and 50 HMA structures, optimised for the US30 (Dow Jones) index.
⸻
Indicator Components:
1. Hull Moving Averages (HMAs):
• 9 HMA (Green): Fastest HMA, responds quickly to price changes.
• 21 HMA (Amber): Medium-term HMA, acts as a transitional filter.
• 50 HMA (Red): Slowest HMA, defines the broader trend direction.
⸻
Logic and Signal Conditions:
1. Session Filter:
• Signals are only generated during the US session, defined as starting at 13:30 BST.
2. Directional Bias:
• Bullish Bias: Occurs when both the 9 HMA and 21 HMA are above the 50 HMA.
• Bearish Bias: Occurs when both the 9 HMA and 21 HMA are below the 50 HMA.
3. Crossover Logic:
• Buy Signal: Prints when the 9 HMA crosses above the 21 HMA while the directional bias is bullish.
• Sell Signal: Prints when the 9 HMA crosses below the 21 HMA while the directional bias is bearish.
4. Minimum Bar Spacing:
• To avoid signal clustering, a minimum bar spacing of 5 bars is implemented between consecutive signals.
⸻
Plotting:
• Buy Signal: Displays as a green label below the candle with the text “BUY.”
• Sell Signal: Displays as a red label above the candle with the text “SELL.”
⸻
Purpose and Usage:
• The indicator is designed for traders looking to capture momentum shifts in the US30 index using HMA crossovers.
• It is best applied on the 5-minute timeframe to balance signal frequency and reliability.
• The strict session filter ensures signals are only generated during the most volatile period, aligning with US market activity.
RSI + Stochastic + WMA StrategyThis script is designed for TradingView and serves as a trading strategy (not just a visual indicator). It's intended for backtesting, strategy optimization, or live trading signal generation using a combination of popular technical indicators.
📊 Indicators Used in the Strategy:
Indicator Description
RSI (Relative Strength Index) Measures momentum; identifies overbought (>70) or oversold (<30) conditions.
Stochastic Oscillator (%K & %D) Detects momentum reversal points via crossovers. Useful for timing entries.
WMA (Weighted Moving Average) Identifies the trend direction (used as a trend filter).
📈 Trading Logic / Strategy Rules:
📌 Long Entry Condition (Buy Signal):
All 3 conditions must be true:
RSI is Oversold → RSI < 30
Stochastic Crossover Upward → %K crosses above %D
Price is above WMA → Confirms uptrend direction
👉 Interpretation: Market was oversold, momentum is turning up, and price confirms uptrend — bullish entry.
📌 Short Entry Condition (Sell Signal):
All 3 conditions must be true:
RSI is Overbought → RSI > 70
Stochastic Crossover Downward → %K crosses below %D
Price is below WMA → Confirms downtrend direction
👉 Interpretation: Market is overbought, momentum is turning down, and price confirms downtrend — bearish entry.
🔄 Strategy Execution (Backtesting Logic):
The script uses:
pinescript
Copy
Edit
strategy.entry("LONG", strategy.long)
strategy.entry("SHORT", strategy.short)
These are Pine Script functions to place buy and sell orders automatically when the above conditions are met. This allows you to:
Backtest the strategy
Measure win/loss ratio, drawdown, and profitability
Optimize indicator settings using TradingView Strategy Tester
📊 Visual Aids (Charts):
Plots WMA Line: Orange line for trend direction
Overbought/Oversold Zones: Horizontal lines at 70 (red) and 30 (green) for RSI visualization
⚡ Strategy Type Summary:
Category Setting
Strategy Type Momentum Reversal + Trend Filter
Timeframe Flexible (Works best on 1H, 4H, Daily)
Trading Style Swing/Intraday
Risk Profile Medium to High (due to momentum triggers)
Uses Leverage Possible (adjust risk accordingly)

Wave Trend -V2Wave Trend -V2 is here to give you a serious edge.
This upgraded version of the popular LazyBear script takes wave trend analysis to the next level.
Here's the deal:
Multi-Timeframe Analysis: Beyond Short-Term Noise:
Novice traders often focus solely on the current timeframe (let's say, the 5-minute chart).
Wave Trend -V2 breaks free from this limitation by analyzing price action across multiple timeframes (1-minute to 1-week).
---This holistic view helps you:
Identify larger trends: Are we in a bullish uptrend on the daily chart, even if the hourly chart is showing some short-term weakness? Wave Trend -V2 helps you see the bigger picture.
Avoid false breakouts: Short-term price spikes can create false signals. By looking at higher timeframes, you can filter out these "noise" and focus on sustainable trends.
---Pressure Analysis: Gauging Market Strength:
Wave Trend -V2 goes beyond simple trend identification.
It incorporates "pressure" analysis to gauge the strength and direction of the current market trend.
This helps you:
Enter trades with confidence: When the trend is strong and the pressure is high, you can enter trades with greater conviction.
Minimize risk: If the pressure is waning or conflicting signals arise, you can avoid entering trades or adjust your risk parameters accordingly.
Impact Point Analysis: Predicting Future Price Moves:
Wave Trend -V2 analyzes the price impact of the last four wave trend crossovers.
Let's say the last impact point was "X", the previous one "X-1", the one before that "X-2", and so on.
The indicator calculates the average price movement between these points using the following simplified formula:
Average Impact = (X - X-1) + (X-1 - X-2) + (X-2 - X-3) / 3
This average provides a valuable estimate of the potential price movement of the next crossover.
Multiple Take Profit Levels: Setting Strategic Targets:
Wave Trend -V2 offers three dynamic take profit levels (TP1, TP2, TP3).
TP1: Based on the estimated average impact.
TP2: Twice the estimated average impact.
TP3: Three times the estimated average impact.
This allows you to set your profit targets strategically, maximizing potential gains while managing risk effectively.
Why don't use the Estmated impact point to stop the trade?
In order to eliminated the WHIPSAW effect! There is no other way...
Wave Trend -V2 is designed for traders who seek a deeper understanding of trend dynamics and desire a more sophisticated approach to trading. By combining multi-timeframe analysis, pressure assessment, and advanced impact point calculations, this indicator empowers you to make more informed trading decisions and potentially improve your trading outcomes.
The indicator work best with combination of other trend type indicators.
Please dont forget that indicators are not miracle medicines , it cannot give you exact results , market was always volative , use at your own discretion.
DIN: Dynamic Trend NavigatorDIN: Dynamic Trend Navigator
Overview
The Dynamic Trend Navigator script is designed to help traders identify and capitalize on market trends using a combination of Weighted Moving Averages (WMA), Volume Weighted Average Price (VWAP), and Anchored VWAP (AVWAP). The script provides customizable settings and flexible alerts for various crossover conditions, enhancing its utility for different trading strategies.
Key Features
- **1st and 2nd WMA**: Allows users to set and visualize two Weighted Moving Averages. These can be customized to any period, providing flexibility in trend identification.
- **VWAP and AVWAP**: Incorporates both VWAP and AVWAP, offering insights into price levels adjusted by volume.
- **ATR and ADX Indicators**: Includes the Average True Range (ATR) and Average Directional Index (ADX) to help assess market volatility and trend strength.
- **Flexible Alerts**: Configurable buy and sell alerts for any crossover condition, making it versatile for various trading strategies.
How to Use the Script
1. **Set the WMA Periods**: Customize the periods for the 1st and 2nd WMAs to suit your trading strategy.
2. **Enable VWAP and AVWAP**: Choose whether to include VWAP and AVWAP in your analysis by enabling the respective settings.
3. **Configure Alerts**: Set up alerts for the desired crossover conditions (WMA, VWAP, AVWAP) to receive notifications for potential trading opportunities.
4. **Monitor Signals**: Watch for buy and sell signals indicated by triangle shapes on the chart, which appear at the selected crossover points.
When to Use
- **Best Time to Use**: The script is most effective in trending markets where price movements are well-defined. It helps traders stay on the right side of the trend and avoid false signals during periods of low volatility.
- **When Not to Use**: Avoid using the script in choppy or sideways markets where price action lacks direction. The script may generate false signals in such conditions, leading to potential losses.
Benefits of VWAP and AVWAP
- **VWAP**: The Volume Weighted Average Price provides a price benchmark that adjusts for volume, helping traders identify fair value levels. It is particularly useful for intraday trading and gauging market sentiment.
- **AVWAP**: The Anchored VWAP allows traders to set a starting point for VWAP calculations, providing flexibility in analyzing price levels over specific periods or events. This helps in identifying key support and resistance levels based on volume.
Unique Aspects
- **Customizability**: The script offers extensive customization options for WMA periods, VWAP, AVWAP, and alert conditions, making it adaptable to various trading strategies.
- **Combining Indicators**: By integrating WMAs, VWAP, AVWAP, ATR, and ADX, the script provides a comprehensive view of market conditions, enhancing decision-making.
- **Real-Time Alerts**: The flexible alert system ensures traders receive timely notifications for potential trade setups, improving responsiveness to market changes.
Examples
- **Example 1**: A trader sets the 1st WMA to 8 and the 2nd WMA to 100, enabling the VWAP. When the 1st WMA crosses above the 2nd WMA or VWAP, a buy signal is triggered, indicating a potential long entry.
- **Example 2**: A trader sets the AVWAP to start 30 bars ago and monitors for crossovers with the 1st WMA. When the 1st WMA crosses below the AVWAP, a sell signal is triggered, suggesting a potential short entry.
Final Notes
The Dynamic Trend Navigator script is a powerful tool for traders looking to enhance their market analysis and trading decisions. Its unique combination of customizable indicators and flexible alert system sets it apart from other scripts, making it a valuable addition to any trader's toolkit.
Disclaimer: Never any financial advice. Just ThisGirl loving experimenting with indicators to help myself, as well as others.

Advanced Klinger OscillatorAdvanced Klinger Oscillator
The Advanced Klinger Oscillator is an enhanced version of the traditional Klinger Oscillator, which measures the difference between two exponential moving averages (EMAs) of volume flow. This tool helps traders identify momentum shifts and potential trading opportunities.
Key Features:
Dual EMA Calculation: The oscillator calculates the difference between a short-term and a long-term EMA of volume flow, smoothing out price fluctuations for clearer trend analysis.
Signal Line: A signal line, which is an EMA of the Klinger Oscillator, generates buy and sell signals. A crossover above the signal line indicates a potential buy, while a crossover below suggests a sell.
Volume Confirmation: Signals are only generated when trading volume exceeds a specified threshold, ensuring that price movements are supported by sufficient market activity.
Trend Lines: Upper and lower trend lines are plotted above the oscillator, helping traders visualize momentum strength and identify bullish or bearish trends.
Background Color Coding: The indicator uses color changes in the background to indicate positive (green) and negative (red) momentum, allowing for quick assessment of market conditions.
Usage:
Traders can utilize the Advanced Klinger Oscillator to:
Identify entry and exit points based on oscillator and signal line crossovers.
Confirm trends by observing the relationship between the oscillator and its trend lines.
Make informed trading decisions by considering volume alongside price movements.
The Advanced Klinger Oscillator is a valuable addition to any trader's toolkit, combining price momentum, volume analysis, and visual cues for effective trading strategies.

EMA14 Second Time BUY/SELL AlertsEMA14 Crossover Strategy with Conditional BUY/SELL Alerts
This powerful script provides dynamic BUY and SELL alerts based on the interaction between price action and the EMA14 (Exponential Moving Average 14). Ideal for traders looking to capitalize on trend reversals and breakout patterns, this indicator helps you time entries and exits with precision.
Key Features:
Second-Time Crossover Alerts: The script tracks when the price crosses the EMA14 for the second time. This adds confirmation to price movements and helps filter out false signals.
Conditional BUY/SELL Alerts:
BUY Alert: Triggered when the price closes above the EMA14 after a previous SELL signal, indicating a potential trend reversal or breakout to the upside.
SELL Alert: Triggered when the price closes below the EMA14 after a previous BUY signal, signaling a possible shift to the downside.
Advanced Crossover Tracking:
The script counts each crossover of the price relative to the EMA14, generating a BUY or SELL signal on the second instance to provide additional confirmation of trend strength.
Visual Alerts: Labels are plotted directly on the chart to highlight when a BUY or SELL signal has occurred, providing immediate visual feedback for traders to react in real-time.
How It Works:
The script combines the simplicity of EMA14 with enhanced logic that tracks both crossovers and closes relative to the moving average. This ensures that the signals are based not only on quick movements but also on price confirmation, reducing noise and false breakouts.
This script is perfect for traders who rely on moving average strategies and want additional filtering to confirm trends and optimize trade timing.

DP-OCR MTF & MA 2024This script developed is designed for multi-timeframe analysis of previous open, close, and range, with additional signal plots based on various percentage extension levels. It also incorporates EMA calculations for crossover strategies. Here's a quick breakdown of what the script does:
Key Features:
1. Timeframes:
o Two separate timeframes (TF1 and TF2), which can be set by the user (e.g., 15 mins, 30 mins, daily, etc.). The script computes price actions and extensions for both timeframes. For better analysis, use Daily in TF1 and Weekly in TF2
2. Extension Levels:
o Calculates and plots 10%, 21%, 31%, 51%, and 61% extensions (both positive and negative) for each timeframe.
o The most commonly used extension levels are 61%, 31%, -61%, and -21%.
o These extension levels can be turned on or off by the user.
3. Open/Close/Range:
o Tracks the high, low, open, and close for both timeframes.
o Highlights open/close gaps.
o Plots the previous high/low range for both timeframes with a fill and different colors based on price movement.
How to Use:
• You can toggle specific extension levels on or off in the script’s settings.
• For example, when price hits a +61% extension, it could signal a breakout, and when it hits a -61% extension, it may indicate a potential retracement.
• Use these levels in conjunction with your price action analysis to set entry/exit points or stop-loss levels.
4. Today’s Open:
o Plots today’s opening price for both timeframes.
How to Use:
• Use today’s open as a key reference point to determine the day’s price action.
• Compare today’s open with the previous high/low or extension levels to evaluate possible trends or reversals.
5. EMA Calculations:
o The script calculates 5, 15, and 20 period EMAs and plots them on the chart.
o Additional EMA crossover signals can be included for strategy optimization.
How to Use:
• Observe the EMAs for potential crossover signals. For example, a 5-period EMA crossing above a 15-period or 20-period EMA may signal a buy opportunity, while a crossover in the opposite direction may signal a sell.
• Combine the EMA crossovers with extension levels or previous price data to refine your entries and exits.
Customizations Available:
• Users can select whether to display extension levels for either timeframe.
• The script allows automatic adaptation to intraday, daily, weekly, or monthly timeframes based on the current chart settings.
Moreover, the extension levels are calculated based on the previous period’s range, with the most commonly usable extension levels being 61, 31, -61, and -21. These levels are often used for identifying potential price retracements, breakouts, or reversal points in technical analysis.

Custom MACD Oscillator with Bar ColoringCustom MACD Oscillator with Bar Coloring
This custom MACD indicator is a fusion of two powerful MACD implementations, combining the best features of both the MACD Crossover by HPotter and the Multiple Time Frame Custom MACD Indicator by ChrisMoody. The indicator enhances the traditional MACD with customizable options and dynamic bar coloring based on the relationship between the MACD and Signal lines, providing a clear visual representation of momentum shifts in the market.
Key Features:
MACD Oscillator: Built on the core MACD principle, showing the difference between two Exponential Moving Averages (EMA) for momentum tracking.
Signal Line: A Simple Moving Average (SMA) of the MACD, helping to identify potential entry/exit points through crossovers.
Multiple Time Frame Support: Allows users to view MACD and Signal data from different timeframes, giving a broader view of the market dynamics.
Bar Coloring: Bars are colored green when the MACD is above the Signal line (bullish), red when the MACD is below (bearish), and blue during neutral conditions.
Histogram with Custom Colors: A customizable histogram visualizes the difference between the MACD and Signal lines with color-coding to represent changes in momentum.
Cross Dots: Visual markers at points where the MACD crosses the Signal line for easy identification of potential trend shifts.
This indicator is a versatile tool for traders who want to visualize MACD-based momentum and crossover signals in multiple timeframes with clear visual cues on price bars.

Moving Average Dispersion Index w/ Z-Score (Adjusted MADI-Z)Overview
The Adjusted MADI-Z indicator is a custom indicator that looks to decipher trends and consolidations based on the clustering and dispersion of Moving Averages. It calculates a z-score based on the dispersion of various exponentially weighted moving averages to identify trends and consolidation. The z-score is then adjusted using a logistic function to map it between 0-100.
How can it be used?
- Identify trends and consolidation - Values above 80 indicate a strong trend while values below 20 show consolidation
- Gauge trend strength - Higher positive values suggest a stronger uptrend while lower negative values indicate a stronger downtrend
- Generate trading signals - Crossovers of key levels can act as entry/exit triggers
- Smooth noise in price action - The adjusted z-score filters out market noise
Default Values
- ma5_len = 5
- ma10_len = 10
- ma50_len = 50
- ma200_len = 200
- lookback_period = 100
Strategies
The Adjusted MADI-Z can be used for trend-following strategies across various timeframes. Specific strategies include:
- Trend trading - Enter long on crossover above 80, exit on crossover below 80. Reverse for short trades.
- Range trading - Enter short on crossover below 20, exit on crossover above 20. Reverse for long trades.
- Identifying pullbacks - Temporary moves below 80 during uptrends and above 20 during downtrends can act as retracement entry points.
Rationale
By adjusting the z-score output of the standard MADI using a logistic function, the indicator becomes bounded and easier to interpret for trading purposes. The customized moving average lengths also allow tuning the indicator to particular assets and timeframes.
Interpretation
- Above 80 - Strong uptrend
- 70 to 80 - Moderate uptrend
- 50 to 70 - Weak uptrend
- 30 to 50 - Range-bound consolidation
- 20 to 30 - Weak downtrend
- Below 20 - Strong downtrend
Values below 15 or above 85 represent extremes outside two standard deviations.

Nifty36ScannerThis code is written for traders to be able to automatically scan 36 stocks of their choice for MACD , EMA200 + SuperTrend and Half Trend . Traders can be on any chart, and if they keep this scanner/indicator on , it will start displaying stocks meeting scanning criteria on the same window without having to go to Screener section and running it again and again. It will save time for traders and give them real time signals.
Indicators for scanning stocks are:
MACD
EMA200
Supertrend
HalfTrend - originally developed by EVERGET
Combination of EMA200 crossover/under and MACD crossover/under has worked well for me for long time, so using this combination as one of the criteria to
Scan the stocks. Using Everget's Half Trend method confirms the signal given by MACD , EMA200 and Supertrend Crossover.
I have added 36 of my favourite stocks from Nifty 50 lot. Users of this script can use the same stocks or change it by going into the settings of this scanner.
The Code is divided into 3 Sections
Section 1: Accepting input from users as boolean so that they can scan on the basis of one of the criteria or any combination of the criteria.
Section 2: "Screener function" to calculate Buy/ Sell on the basis of scanning criteria selected y the user.
screener=>
= ta.supertrend(2.5,10)
Buy/Sell on the basis of Supertrend crossing Close of the candle
//using ta.macd function to calculate MACD and Signal
= ta.macd(close, 12, 26, 9)
using HalfTrend indicator to calculate Buy/Sell signals , removed all the plotting functions from the code of Half Trend
Bringing Stock Symbols in S series variables
s1=input.symbol('NSE:NIFTY1!', title='Symbol1', group="Nifty50List", inline='0')
Assigning Bull/Bear ( Buy/Sell) signals to each stocks selected
=request.security(s1, tf, screener())
Assign BUY to all the stocks showing Buy signals using
buy_label1:= c1?buy_label1+str.tostring(s1)+'\n': buy_label1
Follow the same process for SELL Signals
Section 3: Plotting labels for the BUY/SELL result on the in terms of label for any stocks meeting the criteria with deletion of any previous signals to avoid clutter on the chart with so many signals generated in each candle
Display Buy siganaling stocks in teh form of label using Label.new function with parameters as follows:
barindex
close as series
color
textcolor
style as label_up,
yloc =price
textalign=left
Delete all the previous labels
label.delete(lab_buy )
STOCKS SELECTION
We have given range f 36 stocks from NIFTY 50 that can be selected at anytime,. User can chose their own 36 stocks using setting button.
INDICATORS SELECTION
1. MACD: It i sone of the most reliable trading strategy with 39.3% Success rate with 1.187 as profit factor for NIFTY Index on Daily time frame
2. EAM200 + Super trend : Combination of EMA200 crossover and Super trend removes any false positives and considered a very reliable way of scanning for Buy/Sell signals
3. HALF TREND: Originally developed as an indicator by Everget and modified as strategy by AlgoMojo, it generates Buy/Sell signals with 40.2% success rate with 1.469 as profit faction, on 15 minutes timeframe.

EMA CloudThe EMA Crossover Cloud is a clean and intuitive indicator that combines two Exponential Moving Averages (EMA) into a visual cloud.
Key features:
Cloud visualization: The space between EMA A and EMA B is shaded, making the current trend direction easier to identify.
Crossover signals: A clear LONG signal is plotted when EMA A crosses above EMA B, and a SHORT signal when EMA A crosses below EMA B.
Bar coloring: Candles are automatically colored according to the trend (uptrend, downtrend, or neutral).
Customizable colors: Cloud, signals, and bars can all be customized to match your chart style.
Alerts ready: Built-in alerts for EMA crossovers (LONG/SHORT).
Status label: A compact label shows the current cloud trend state in real time.
This indicator is ideal for traders who prefer simple and reliable crossover signals combined with a clear trend visualization. It works on any timeframe or asset.

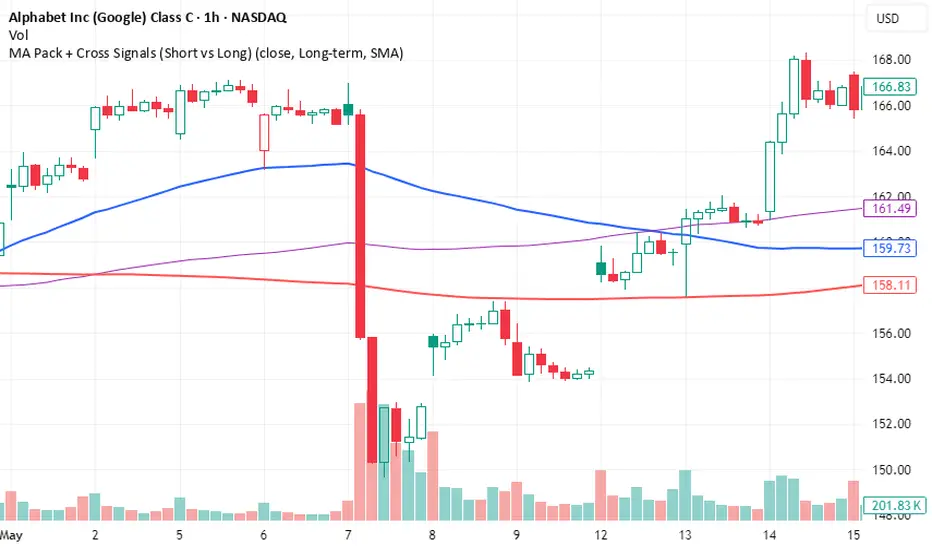
MA Pack + Cross Signals (Short vs Long)Overview
A flexible moving average pack that lets you switch between short-term trend detection and long-term trend confirmation .
Short-term mode: plots 5, 10, 20, and 50 MAs with early crossovers (10/50, 20/50).
Long-term mode: plots 50, 100, 200 MAs with Golden Cross and Death Cross signals.
Choice of SMA or EMA .
Alerts included for all crossovers.
Why Use It
Catch early trend shifts in short-term mode.
Confirm institutional trend levels in long-term mode.
Visual signals (triangles + labels) make spotting setups easy.
Alert-ready for automated trade monitoring.
Usage
Add to chart.
In settings, choose Short-term or Long-term .
Watch for markers:
Green triangles = bullish cross
Red triangles = bearish cross
Green label = Golden Cross
Red label = Death Cross
Optional: enable alerts for notifications.
MACD Josh MACD Study — Visual Crossover Tags
Overview:
This script displays MACD signals in a clear, visual way by showing:
Histogram = EMA(Fast) − EMA(Slow)
Signal = EMA(Histogram, Signal Length)
It adds labels and arrows to help you see crossover events between the Histogram and the Signal line more easily.
⚠️ Disclaimer: This tool is for educational and research purposes only. It is not financial advice or an investment recommendation. Past performance does not guarantee future results. Users should make their own decisions and manage risk responsibly.
Features
Central Zero Line with Signal and Histogram plots
Optional labels/arrows to highlight Histogram–Signal crossovers
Alerts for crossover and crossunder events, integrated with TradingView’s alert system
Standard adjustable inputs: Fast EMA, Slow EMA, Signal EMA
How to Interpret (for study only)
When the Histogram crosses above the Signal, a visual label/arrow marks a positive MACD event
When the Histogram crosses below the Signal, a visual label/arrow marks a negative MACD event
The “BUY/SELL” labels are visual study tags only — they do not represent trade instructions or recommendations
Responsible Usage Tips
Test across multiple timeframes and different assets
Combine with higher-timeframe trend, support/resistance, or volume for confirmation
Use alerts with caution, and always test in a demo environment first
Technical Notes
The script does not use future data and does not repaint signals once bars are closed
Results depend on market conditions and may vary across assets and timeframes
License & Credits
Written in Pine Script® v5 for TradingView
The indicator name shown on chart is for labeling purposes only and carries no implication of advice or solicitation
