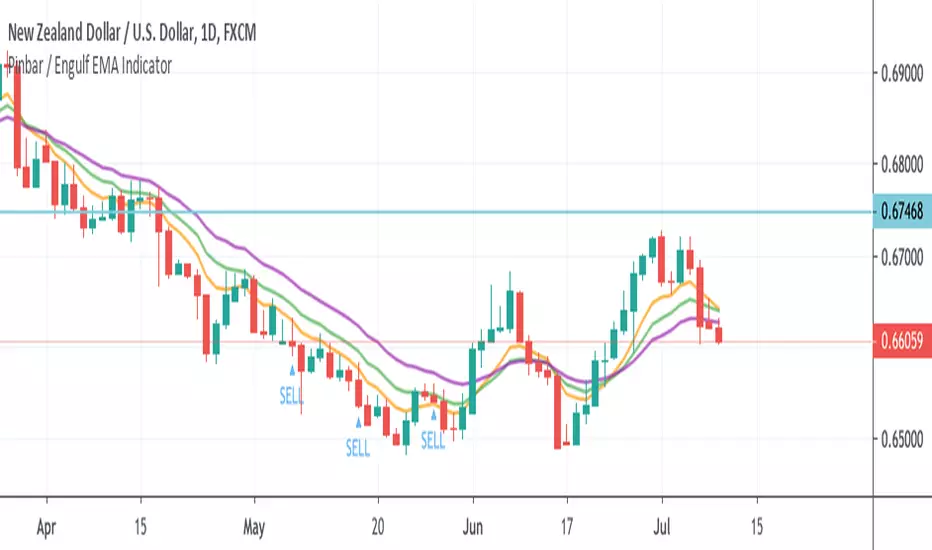
Pinbar / Engulf EMA IndicatorThis indicator is built based on the video by ForexSignals TV (no association on my part with them), published on July 5th, 2019 titled "SIMPLE & PROFITABLE Trend-following Forex Trading Strategy!"
The basic premiss is to use the 8,13,21 EMAs, make sure they have not crossed in the previous 3 bars, then look for engulfing bars or pinbars for the current direction. Meaning if the trend is up, look for bullish engulfer or pinbars, and bearish ones if the trend is down. Also, the pin must have crossed the 8EMA but not the 21EMA.
When determining to act on the signal, the video recommends only executing a buy/sell if the the current trend in the anchor chart is trending in the same direction (trending up only enter buys, trending down, only enter sells).
The script overlays a BUY or SELL tag under the bar that meets the above criteria.
"forex"に関するスクリプトを検索
FX Meter ScriptA while ago, we wrote* about the usefulness of using a currency strength meter and how you can build one from scratch.
See here: www.globalprime.com.au
Now we've taken this little project to the next level by visually spotting, via color signals in a dashboard and alerts, when a potential new trend might be developing in a currency pair.
*It's critical that you first read that article before you jump into reading this one or else you could get easily lost.
The script gives a trigger every time two currencies show diverging flows via opposing moving average slopes.
The signals originate from a first chart where currency indexes can be found, calculated through a formula, in various thin lines. Then a moving average to each currency index is applied so that it can smooth out the lines (what I call Micro moving averages – thicker lines -) and is usually a 4-5 period MA, with the key input to pay attention being the slope. One can perform their own tests on what works best for their particular trading style. The smaller the period in the moving average, the more responsive to changes in biases but the downside is that you will get a greater number of false moves. In the windows below the 1st chart, the stochRSI is calculated for each currency index (these values originate from the currency index and not from the applied MA). By default, a 25-period is applied to both RSI and Stoch length.
A 2nd chart that looks at the same logic is also accounted for to build this script, but instead of checking the micro trend, it applies a 25MA to the currency index, so it looks at what I call the slope of the macro trend. In this case, by default, a 125-period is applied to both RSI and Stoch length.
We had in mind to transition from just eye-balling and monitoring these charts manually to build a script via Tradingview that makes calculations real time (whenever the change in the moving average slope first occurs, and not when the bar/line closes), so that one can decide whether or not its a signal worth trading as part of a new trend emerging. Note, this is not so much a signal-triggering indicator but rather a tool to constantly be on the lookout monitoring what currencies might start to develop trends.
The actual script consists of a dashboard with different colored rectangles being triggered depending on the quality of the signal.
We will be happy to discuss it further with anyone who is interested in exploiting all the benefits that it can offer.
The way you add the script into your Tradingview chart is by first copy everything in the txt file. Then go to Pine editor (bottom middle-left) in your tradingview chart, delete everything there, then Paste the script. Then click Add to Chart (top right of the pine editor).
Note, you should add via the Anchored Text function the following list of pairs below, in this alphabetic order, on the right-hand side of the chart, as demonstrated above:
AUDCAD
AUDJPY
AUDNZD
AUDUSD
CADJPY
EURAUD
EURJPY
EURCAD
EURNZD
EURGBP
EURUSD
GBPAUD
GBPCAD
GBPJPY
GBPNZD
GBPUSD
NZDCAD
NZDJPY
NZDUSD
USDCAD
USDJPY
There are only 2 rules for the script to trigger a signal (see below). However, as I will elaborate further down, there are up to 6 different colors we can grade a signal
RULE 1 -> 2 moving averages, which are a calculation applied to a currency index as shown in the micro trend above, exhibit slopes in the opposite direction.
RULE 2 -> The Stoch RSI cannot be in overbought conditions if the slope of the moving average points higher or in oversold if the slope points lower.
Note 1: Even if the chart is a 60m timeframe by default (can be changed to any timeframe(, one gets the signal the moment the change of slope is identified, which means the indicator monitors changes in price tick by tick, and not on a candle close, otherwise one would get the trigger too late.
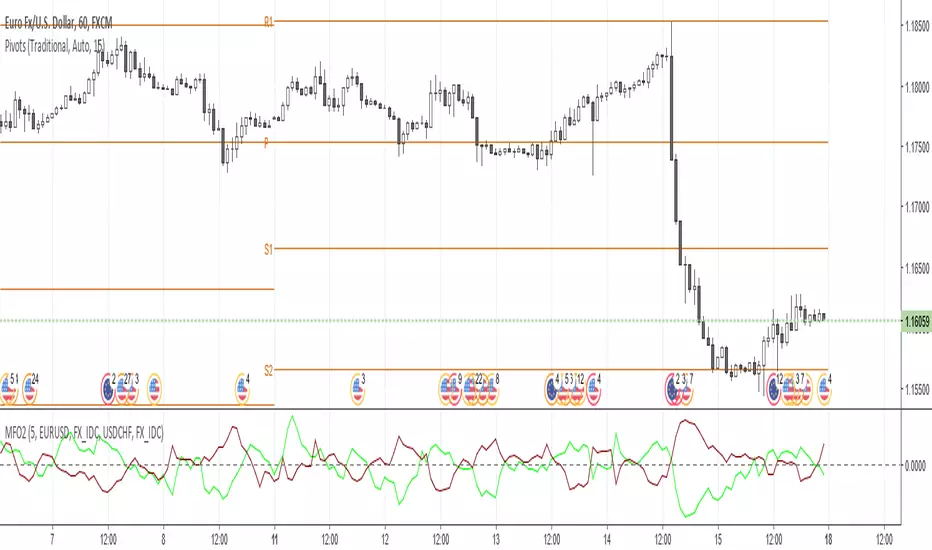
As an example of the highest-graded signal triggering (in green), a few hours ago we were given the visual cue that GBPCAD was experiencing a change of behavior. If we crosscheck the time the green-colored trigger was given with the actual GBPCAD chart, this is what we can observe. The pair is 30p higher since the trigger.
HOW TO SETUP ALERTS
One can easily setup a notification window each time the above rules are met, for example, if the EUR MA slope changes to bullish, and the AUD MA slope changes to bearish, and none of the 2 currency index values corresponding to these 2 moving averages (EUR and AUD) show a stoch RSI in overbought (above 80) in the case of the EUR, or oversold (below 20) in the case of the AUD, then the notification pop up would show a customized line: Long EURAUD
Note 1: Recording the slope of the macro moving average, which is usually a 25period MA applied to the currency index, is not included as part of the rules to trigger a signal, but it is taken into account to grade the quality of each signal.
Note 2: I recommend each signal to be triggered once or if you prefer, simply monitor the chart visually on the change of colors via the dashboard. The calculation resets and can appear again the moment that the slope changes to the opposite direction, so it’s a very dynamic indicator that will alert you the second a pair of currencies starts trending.
Note 3: When the signal is triggered, the indicator draws a colored rectangle. Each signal notification should be colored based on the following logic below.
LOGIC TO QUALIFY SIGNALS
-> Any long micro position with Macro MA in full agreement (ie/ Long EURAUD, Macro EUR up, Macro AUD down) is highlighted with green color
-> Any long micro position with macro moving averages in partial agreement (for example Long EURAUD, Macro EUR up AUD up) is highlighted with blue color
-> Any long micro position with macro moving averages in full disagreement (for example Long EURAUD, Macro EUR down AUD up) is highlighted with magenta color
-> Any short micro position with macro moving averages in full agreement (for example Short EURAUD, Macro EUR down AUD up) is highlighted with red color
-> Any short micro position with macro moving averages in partial agreement (for example Short EURAUD, Macro EUR up AUD up) is highlighted with orange color
-> Any short micro position with macro moving averages in full disagreement (for example Short EURAUD, Macro EUR up AUD down) is highlighted with purple color
PARAMETERS IN THE SCRIPT SETTINGS
Overbought/oversold: One can modify the stoch RSI level from which the indicator considers the value to be in overbought or oversold conditions. As a rule of thumb, consider 20/30 for oversold and 70/80 for oversold.
Slopes micro/macro MAs: One can edit the slope of the micro MA period (rule of thumb 4-5) and the macro MA (by default 25).
Value StochRSI: The default inputs are K 3, D 3, RSI Length 25, Stoch Length 25 for the micro and 125 period for the macro.
Change colors: One can edit the assigned colors in the signals dashboard.
Timeframe applied: The indicator has the flexibility to be applied to any timeframe, not just the 60m by default. Simply change the timeframe temporality.
CURRENCY INDEXES FORMULAS
It is the responsibility of the user to keep the values of the indexes updated. Find a recent sample below, as per values in early April. What this means is that at least once a week, in order to not let the values outdated, you should update the script with the latest valuations in the denominator.
NZD INDEX -> FX_IDC:NZDAUD/0.96+FX:NZDJPY/75.81+FX:NZDUSD/0.68+FX_IDC:NZDEUR/0.6+FX_IDC:NZDGBP/0.52+FX:NZDCHF/0.69+FX:NZDCAD/0.9
EUR INDEX -> FX:EURUSD/1.13+FX:EURJPY/125.5+FX:EURGBP/0.87+FX:EURCHF/1.135+FX:EURCAD/1.49+FX:EURNZD/1.655+FX:EURAUD/1.59
JPY INDEX -> 1/(FX:USDJPY/110.5+FX:EURJPY/125.5+FX:AUDJPY/79+FX:NZDJPY/75.5+FX:GBPJPY/144.5+FX:CHFJPY/110.5+FX:CADJPY/84)
USD INDEX -> FX_IDC:USDEUR/0.88+FX:USDJPY/110.5+FX_IDC:USDGBP/0.77+FX:USDCHF+FX:USDCAD/1.315+FX_IDC:USDNZD/1.46+FX_IDC:USDAUD/1.4
CAD INDEX-> FX_IDC:CADAUD/1.07+FX_IDC:CADNZD/1.11+FX:CADJPY/84.27+FX_IDC:CADUSD/0.76+FX_IDC:CADEUR/0.67+FX:CADCHF/0.76+FX_IDC:CADGBP/0.58
GBP INDEX -> FX:GBPAUD/1.83+FX:GBPNZD/1.91+FX:GBPJPY/144.5+FX_IDC:GBPEUR/1.15+FX:GBPCHF/1.31+FX:GBPUSD/1.31+FX:GBPCAD/1.71
Remember, I have provided a manual on how to build a currency strength meter. That’s what you will need to do first if you want to obtain the actual currency indexes other than just the indicator, which is just the visual cue to get you alerted when the slopes turn.
Once you’ve created your indexes via tradingview, you then apply a moving average to each index. Then apply the stochrsi 25 period to each index. For the macro trend, I make the same calculations, but the period of the MA is 25 instead of 4, while the stoch rsi is 125 periods vs 25 periods.
FINAL NOTE
This is a tool that should be interpreted as visual assistance, via the dashboard, to get that first cue when opposing micro slopes via the FX meter occur. However, you still need to check the technical context of the pair (levels marked, proj reached, etc.) but that first cue is a major time saver to constantly spot what's trending in FX. The permutations u can play with, as part of this script, are significant. You can tweak the timeframes you use, the periods of the moving averages, etc. I find the micro and macro trend combos when either a green or red signals is triggered the most reliable, with positions to be exploited via 15m and hourly under the right technical context.

Amazing Crossover System - 100+ pips per day!I got the main concept for this system on another site. While I have made one important change, I must stress that the heart of this system was created by someone else! We must give credit where credit is due!
Y'all know baby pips. @ForexPhantom published about this system and did both back and forward test around 10 years ago.
I found it on the sit and now I put it to code to see how it performs. I assume 10 points spread for every trade. I use Renesource or AxiTrader to get the low spreads.
There are 2 mods, the single trades and constant trading on the direction.
Main concept
Indicators
5 EMA -- YELLOW
10 EMA -- RED
RSI (10 - Apply to Median Price: HL/2) -- One level at 50.
TIME FRAME
1 Hour Only (very important!)
PAIRS
Virtually any pair seems to work as this is strictly technical analysis.
I recommend sticking to the main currencies and avoiding cross currencies (just his preference).
WHEN TO ENTER A TRADE
Enter LONG when the Yellow EMA crosses the Red EMA from underneath.
RSI must be approaching 50 from the BOTTOM and cross 50 to warrant entry.
Enter SHORT when the Yellow EMA crosses the Red EMA from the top.
RSI must be approaching 50 from the TOP and cross 50 to warrant entry.
I've attached a picture which demonstrates all these conditions.
That's it!
f.bpcdn.co


Daily OHLPlots the daily open high low for any chart on any market.
Work very well for all crypto exchanges.
When using for Traditional markets, please use data from Forex.com due to various exchanges running on different time zones.

Money Flow Oscillator 2A volume indicator that measures buying and selling pressure over a given lookback period.
As described at traders.com
See also:
- Are price updates a good proxy for actual traded volume in FX?
- Using Tick Volume in Forex: A Clear NVO Based Example
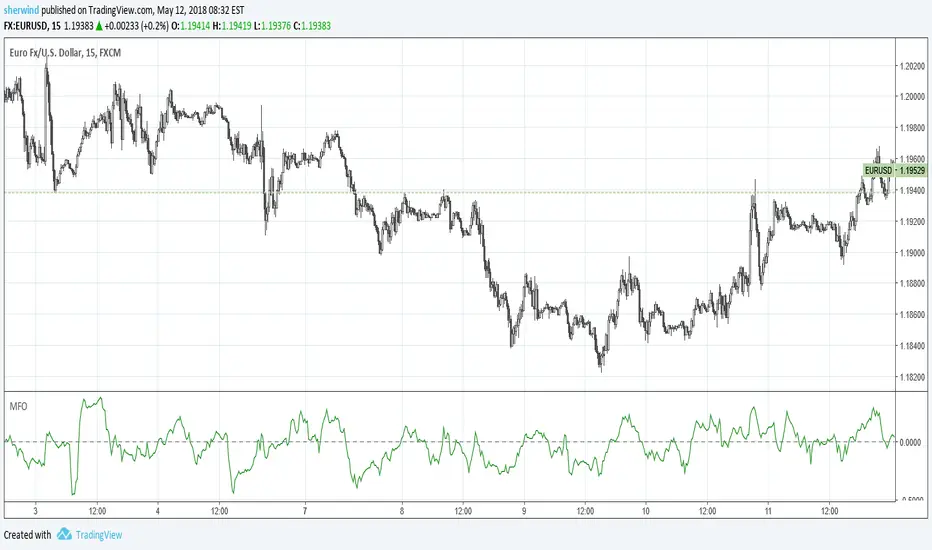
Money Flow OscillatorMeasures buying and selling pressure over a given lookback period.
As described at traders.com
See also:
- Are price updates a good proxy for actual traded volume in FX?
- Using Tick Volume in Forex: A Clear NVO Based Example
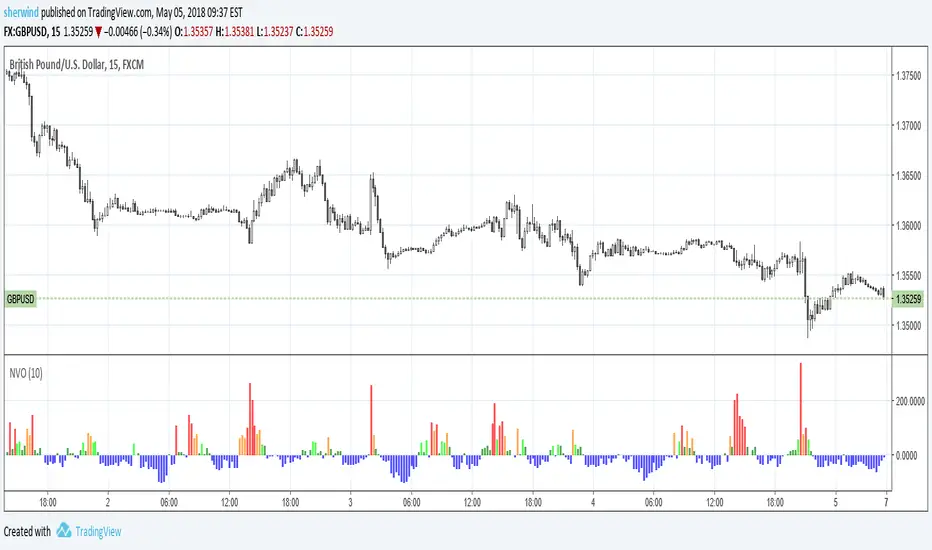
Normalized Volume OscillatorThis volume indicator works best on comparatively small timeframes (15 minutes, for example).
Based on:
- Normalized Volume Oscillator - indicator for MetaTrader 4
- Using Tick Volume in Forex: A Clear NVO Based Example
See also:
- Are price updates a good proxy for actual traded volume in FX?
DRS - Daily Range SystemAn indicator that visualizes the evolution of a daily candle, inspired by a thread on forexfactory: www.forexfactory.com
Applied on a timeframe lower than D (actually lower than H4), it visualizes the evolution of the day's high and low, as well as mid and 25% and 75% lines.
The sole input parameters are the hour at which a day is supposed to start, and the extent of the "trade allowed" region as explained in the FF -1.44% thread.

4 Hour MACD (Philip Nel ForexFactory)This is the basic script that shows MACD as described with settings in the thread www.forexfactory.com

Ichimoku Cloud Score v1.0This script calculates a simple Ichimoku Score based on the signals documented here , with a few additions. Each of the score components can be individually weighted via the script inputs . The output is a plot of the normalized Ichimoku score, in the range of -100 to 100.
This script has been heavily modified from 'Ichimoku Cloud Signal Score v2.0.0 '. Credit to user 'dashed' for the initial implementation.
This has been modified with several refinements:
Clean/Organized Code
Simplified Inputs
Improved Style
Scores normalized to a range (-100, 100)
Bugfixes and Improvements
Script Inputs: i.imgur.com

3 Duck's Trading System from Babypips.comThe 3 Duck's Trading System from Babypips.com
The 3 Duck's Trading System is the most popular and active trading system thread on the the babypips.com forum. It is a system that is mainly for beginners because it teaches you discipline, learning to cope with price moving against your position and learning to stay in a trade and keep profits running. For the thread and more info on the 3 Duck's Trading System click here
How does it work?
The system is a very simple enter/exit based on the 60 SMA of 3 different time frames: 4 hour, 1 hour and 5 minute.
The Rules, er, the Ducks! The Ducks must all be in a row for a trade to take place!
Duck 1 - To go long, price must be above the 60 SMA on the 4 hour chart.
Duck 2 - To go long, price must be above the 60 SMA on the 1 hour chart.
Duck 3 - To go long, price must cross above the 60 SMA on the 5 minute chart and the 60 SMA of the 5 minute chart must be below that of the 4 hour and 1 hour chart. (obviously the reverse for shorting)
YOU MUST USE THIS SYSTEM ONLY ON THE 5 MINUTE CHART.
I say this because I have already charted all of the Ducks into the 5 minute chart so you don't have to flip back and forth.
I have also added some inputs for profit targets, stop targets, trailing stops and times to trade for backtesting.
If you have any questions or comments, please let me know! If you see I messed up on something, please let me know!
Also a VERY special thanks to the babypips.com user Captain_Currency . He wrote this strategy 10 years ago (2007 was 10 years ago?!) and he is still active on the thread and posting results and offering help!

HL2 - 22 EMA Cross for RenkoEURUSD
This is a simple strategy to use for those who like Renko bars. I ONLY use it on Renko.
Basic idea is that when the Renko bar closes above or below the 22 EMA, you go long or short.
However, some of the frustrations I've had with any strategy shared in Tradingview is so few folks put in the ability to set a stop or a profit target or the ability to set a specific time to trade. I have added those to this strategy. (And I for the life of me can not remember where I got the code for the the time, I need to find you!).
Special note: If you have never used the Renko bars in Tradingview, make sure you click the Format option next to whatever pair you are looking at and change it from Traditional to ATR. You can set it for a static pip amount if you want. But ATR at first will help you decide which amount of pips you should throw in.
This is my first published strategy so if I screwed up on anything or didn't explain it very well, please let me know!!

Traders Dynamic Index Indicator Alert v0.1 by JustUncleLThis is a trend trading indicator+alert utilising the Traders Dynamic Index (TDI), Price Action Channel (PAC) and Heikin Ashi candles.
About 6months ago I came across the use of TDI in "E.A.S.Y. Method" that I found in forexfactory forums: www.forexfactory.com
and I was able to set up a chart based on the specifications by using Kurbelklaus scripts. However, I found that the alerts were being generated one or two bars too late, so at that time I was not successful using it with Binary Options. A few months later I found a variation of the method in the forecfactory forums which is able to generate the alerts a bit earlier, so this indicator is a modification of that early detection version.
The indicator can optionally use Heikin Ashi candles only for all it's calculation. I would recommend viewing the chart with Heikin Ashi candles, these smooth out the trends and makes trends very clear.
I found that this method it works good with most currency pairs or commodities and with 5min+ timeframe charts. I would suggest expiry of 2 to 6 candles.
ALERT GENERATION:
=================
The TDI (Traders Dynamic Index)
---------------------------------------------
Volatility Band VB(34), color: Blue, buffer: UpZone, DnZone
Relative Strength Index RSI(13)
RSI PRICE LINE (2), color: Green, buffer: mab
RSI TRADE SIGNAL LINE (7), color: Red, buffer: mbb
MARKET BASE LINE MID VB(34), color: Orange, buffer: mid
Indicator SignalLevels:
-------------------------------
RSI_OversoldLevel : 22 (normally: 32)
RSI_OverboughtLevel : 78 (normally: 68)
Alert Conditions:
-----------------------
Strong Buy : yellow
Medium Buy : aqua
Weak Buy : blue
Strong Sell : fuchsia
Medium Sell : purple
Weak Sell : black
Hints on How to use:
----------------------------
- When a Medium or Strong alert is generated and MACD histogram colour matches the direction
of the alert (optional auto filter), then place trade in direction of alert candle and MACD.
- I use the multi-Hull MA's for overall trend direction confirmation.
- Best positions normally occur near the MACD(5,15,1) Histogram crossing the zero line.
- The optional coloured Dots along the bottom of the indicator represent the first alert
of this type that was generated in this sequence.
- It is advisable to trade in the direction of the main trend as indicated the HULL MA red cloud:
if red cloud underneath PAC then BULLISH trend, if red cloud above PAC then BEARISH trend.
- Selecting the HeiKin Ashi candles does affect the MACD and MA caculations, so if you select
normal candles the result chart will change. You can still Optionally select to use Heikin Ashi
for calculations.
- When using the Heikin Ashi candles, a good buy entry is indicated by long top wick and no bottom wick
for bull (green) candles and good sell entry is indicated by long bottom wick and no top wick for
bear (red) candles.
- When the MACD histogram is flat and close to zero line,
this indicates a ranging market, do NOT trade when this occurs.
- When the PAC channel on the main chart is spread apart widely, this is an indication
of extreme volatility and choppy chart, do NOT try to trade during these periods.
A choppy chart is also indicated by Heikin Ashi candles with long wicks on both sides
of the candles.
- You can specify what strength level Alerts are generated (default 2):
Level (1) means only generate Strong Alerts only.
Level (2) means generate Strong and Medium Alerts.
Level (3) means generate Strong, Medium and Weak Alerts.

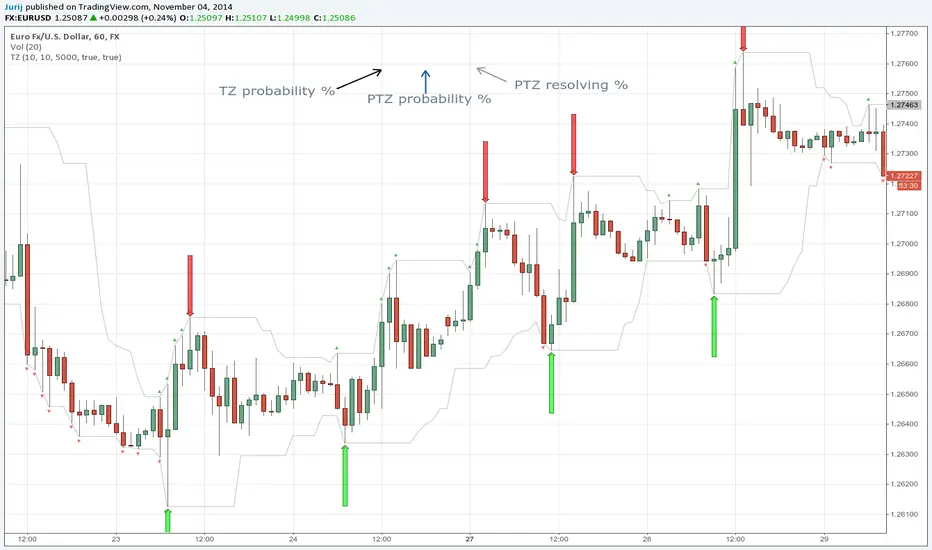
Transient Zones v1.1Simple indicator to visualize Transient Zones (TZ) and Potential Transient Zones (PTZ).
The last 3 numbers in the header represent: probability of true TZ (black), probability of PTZ (navy) and probability of PTZ resolving (gray).
Original ForexFactory thread by EURUSDD www.forexfactory.com
Version 1.1:
- Added TZ/PTZ occurrence probability thanks to SPYderCrusher
Todo:
- Mid bar transient zones detection
- Draw rectangles for zones (once rectangle drawing gets implemented in pine script) or use dot/circle lines
- Mark forming PTZs more clearly
Previous version 1.0:
Transient ZonesUpdated version 1.1:
Simple indicator to visualize Transient Zones (TZ) and Potential Transient Zones (PTZ).
Original ForexFactory thread by EURUSDD www.forexfactory.com
Todo:
- Mid bar transient zones detection
- Draw rectangles for zones (once rectangle drawing gets implemented in pine script)
- Mark forming PTZs more clearly

ICT IPDA LookbackThis description is tailored for the TradingView community, using the specific terminology associated with Michael Huddleston's (ICT) Interbank Price Delivery Algorithm (IPDA).
📜 TradingView Indicator Description
ICT IPDA Lookback Engine (20-40-60 Day Cycles)
Overview This indicator automates the IPDA Data Range lookback periods as taught by Michael J. Huddleston (ICT). In the Interbank Price Delivery Algorithm, time is the primary filter. The algorithm references specific lookback windows—20, 40, and 60 trading days—to seek liquidity and rebalance inefficiencies.
Instead of manually counting bars every morning, this tool plots precise vertical anchors to help you identify the Institutional Order Flow and the "Draw on Liquidity" (DOL) within the current dealing range.
🛠️ Key Features
Rolling Lookback Anchors: Automatically plots red vertical lines at the 20, 40, and 60-day intervals.
Time-Based Accuracy: Calculated using calendar-adjusted trading days to ensure the lines land on the correct institutional data points, regardless of weekends or holidays.
Multi-Asset Support: Works seamlessly across Forex, Futures, Indices, and Commodities.
Real-Time Movement: The lines shift dynamically with the current candle, maintaining the exact IPDA window as the algorithm processes new data.
💡 How to Use (ICT IPDA Logic)
Define the Context: Look back at the 20-day range (Short-term), 40-day range (Intermediate-term), and 60-day range (Long-term).
Identify PD Arrays: Use these vertical lines to anchor your search for Old Highs/Lows, Fair Value Gaps (FVG), and Order Blocks (OB) within those specific windows.
Determine Premium vs. Discount: Check where the current price sits relative to the Highs and Lows of these three ranges to establish your Daily Bias.
Quarterly Shifts: Monitor how price reacts as it reaches the extremity of the 60-day lookback, often signaling a potential "Quarterly Shift" in institutional direction.
📖 Technical Details
Indicator Type: Overlay
Calculations: Uses timenow and millisecond conversion for precise "Calendar Day" placement.
Best Timeframes: Designed for the Daily (1D) chart but can be used on lower timeframes (H4, H1, M15) to visualize the higher-timeframe data ranges while scalping.

FlowMaster 4H - Avanced Volume & Pip Analyzer“Visualize market flow like an institutional trader – track buy/sell volume, pip per tick, and candle efficiency in one table.”
“Visualize market flow like an institutional trader – track buy/sell volume, pip per tick, and candle efficiency in one table.”
Short Description (Marketplace-Friendly):
Aggregated 4H candle analysis with buy/sell volume breakdown.
Pip/Tick calculation with weighted averages for smarter entry/exit signals.
Compare current candle volume to previous candle and 20-bar average.
All key metrics in a compact, easy-to-read table below the chart.
Ideal for Forex swing & position traders seeking institutional-style insights directly in TradingView.
Long Description / Full Product Info:
FlowMaster 4H is a professional-grade trading indicator designed to provide quantitative order flow analysis on Forex markets using 4-hour candles. By aggregating volume data, tick information, and pip movements, FlowMaster gives traders a unique perspective on market dynamics typically reserved for institutional participants.
Key Features:
Volume Relative Metrics: Compare the current candle volume to the previous candle and to the average of the last 20 candles.
Pip/Tick Analysis: Calculates pip per tick using a scaled price approach, giving insights into the efficiency of price moves.
Weighted Pip/Tick Averages: Tracks volume-weighted pip/tick over the last 20 candles for both buyers and sellers.
Percentage Metrics: Visualize the proportion of buy and sell volume relative to total ticks, helping identify absorption and impulse movements.
User-Friendly Table: All key indicators displayed in a compact, easy-to-read table below the chart.
Why use FlowMaster 4H:
Identify market absorption and impulse using reliable volume and pip metrics.
Optimize trade entry and exit decisions based on quantitative order flow data.
Works directly in TradingView, offering a professional order flow view without needing access to Level 2 order book data.
Pioneering approach in aggregating 4H candle data with detailed pip/tick insights.
Ideal For: Swing and position traders, Forex traders seeking institutional-style volume analysis, and anyone looking to improve order flow reasoning using TradingView.

Ichimoku + EMA + RSI [Enhanced]# **Ichimoku + EMA + RSI Strategy - User Instructions**
---
## **📋 TABLE OF CONTENTS**
1. (#installation)
2. (#strategy-overview)
3. (#parameter-configuration)
4. (#understanding-the-dashboard)
5. (#entry--exit-rules)
6. (#best-practices)
7. (#optimization-guide)
8. (#troubleshooting)
---
## **🚀 INSTALLATION**
### **Step 1: Add to TradingView**
1. Open TradingView.com
2. Click **Pine Editor** (bottom of screen)
3. Click **"New"** → Select **"Blank indicator"**
4. Delete all default code
5. **Copy and paste** the complete script
6. Click **"Save"** (give it a name: "Ichimoku EMA RSI Strategy")
7. Click **"Add to Chart"**
### **Step 2: Verify Installation**
✅ You should see:
- Orange **200 EMA** line
- Blue **Tenkan** line
- Red **Kijun** line
- Green/Red **Cloud** (Ichimoku cloud)
- **Dashboard** in top-right corner
- **Strategy Tester** tab at bottom
---
## **📊 STRATEGY OVERVIEW**
### **What This Strategy Does**
Combines three powerful technical indicators to identify high-probability trades:
| Component | Purpose |
|-----------|---------|
| **200 EMA** | Determines overall trend direction |
| **Ichimoku Cloud** | Provides support/resistance and momentum |
| **RSI** | Filters momentum strength |
| **Dashboard** | Real-time signal analysis |
### **Trading Logic**
- **LONG**: Enter when all bullish conditions align
- **SHORT**: Enter when all bearish conditions align
- **EXITS**: Automatic via trailing stops, cloud breach, or TK cross reversal
---
## **⚙️ PARAMETER CONFIGURATION**
### **🔵 Trend Filter Settings**
```
EMA Length: 200 (default)
```
- **Lower (100-150)**: More sensitive, faster signals
- **Higher (250-300)**: More stable, slower signals
- **Recommendation**: Keep at 200 for most timeframes
---
### **🟢 RSI Settings**
```
RSI Length: 14 (default)
RSI Long Minimum: 55
RSI Short Maximum: 45
```
**Adjustment Guide:**
- **Aggressive** (more signals): Long=50, Short=50
- **Balanced** (default): Long=55, Short=45
- **Conservative** (fewer signals): Long=60, Short=40
---
### **🟡 Ichimoku Settings**
```
Tenkan Period: 9
Kijun Period: 26
Senkou B Period: 52
Displacement: 26
```
**Standard Configurations:**
| Timeframe | Tenkan | Kijun | Senkou B |
|-----------|--------|-------|----------|
| **1H - 4H** | 9 | 26 | 52 |
| **15m - 1H** | 7 | 22 | 44 |
| **Daily** | 9 | 26 | 52 |
**Filters:**
- ✅ **Require Chikou Confirmation**: Adds extra validation (recommended)
- ✅ **Require Cloud Position**: Price must be above/below cloud (recommended)
---
### **🔴 Risk Management**
```
ATR Length: 14
ATR Stop Loss Multiplier: 2.0
ATR Take Profit Multiplier: 3.0
Min Bars Between Trades: 3
```
**Risk/Reward Profiles:**
| Profile | SL Multiplier | TP Multiplier | Description |
|---------|---------------|---------------|-------------|
| **Conservative** | 2.5 | 4.0 | Wider stops, higher R:R |
| **Balanced** | 2.0 | 3.0 | Default settings |
| **Aggressive** | 1.5 | 2.5 | Tighter stops, faster exits |
---
### **🎨 Display Settings**
```
Show Dashboard: ON
Show Entry Signals: ON
```
- **Dashboard**: Shows real-time analysis
- **Entry Signals**: Green/Red arrows on chart
---
## **📈 UNDERSTANDING THE DASHBOARD**
### **Dashboard Components**
```
┌─────────────────────┬──────────┐
│ Component │ Status │
├─────────────────────┼──────────┤
│ EMA Trend │ BULL/BEAR│
│ Cloud │ ABOVE/BELOW/INSIDE│
│ TK Cross │ BULL/BEAR│
│ RSI │ 55.3 │
│ Chikou │ BULL/BEAR│
│ Signal │ STRONG LONG│
└─────────────────────┴──────────┘
```
### **Signal Interpretation**
| Signal | Score | Meaning | Action |
|--------|-------|---------|--------|
| **STRONG LONG** | 7+ | All conditions aligned | High confidence LONG |
| **LONG** | 4-6 | Most conditions met | Moderate confidence |
| **NEUTRAL** | <4 | Mixed signals | Wait for clarity |
| **SHORT** | 4-6 | Bearish bias | Moderate SHORT |
| **STRONG SHORT** | 7+ | All bearish conditions | High confidence SHORT |
---
## **📍 ENTRY & EXIT RULES**
### **✅ LONG ENTRY CONDITIONS**
All must be TRUE:
1. ✅ Price **above** 200 EMA
2. ✅ Price **above** Ichimoku Cloud
3. ✅ Tenkan **crosses above** Kijun (TK Bull Cross)
4. ✅ RSI **above** 55
5. ✅ Chikou **above** price 26 bars ago
6. ✅ Minimum bars since last trade met
**Visual Confirmation:**
- 🟢 Green triangle **below** candle
- Dashboard shows **"STRONG LONG"**
---
### **❌ LONG EXIT CONDITIONS**
Any ONE triggers exit:
1. ❌ Price closes **below** cloud bottom
2. ❌ Tenkan **crosses below** Kijun
3. ❌ ATR trailing stop hit (2.0 × ATR)
4. ❌ Take profit hit (3.0 × ATR)
---
### **✅ SHORT ENTRY CONDITIONS**
All must be TRUE:
1. ✅ Price **below** 200 EMA
2. ✅ Price **below** Ichimoku Cloud
3. ✅ Tenkan **crosses below** Kijun (TK Bear Cross)
4. ✅ RSI **below** 45
5. ✅ Chikou **below** price 26 bars ago
6. ✅ Minimum bars since last trade met
**Visual Confirmation:**
- 🔴 Red triangle **above** candle
- Dashboard shows **"STRONG SHORT"**
---
### **❌ SHORT EXIT CONDITIONS**
Any ONE triggers exit:
1. ❌ Price closes **above** cloud top
2. ❌ Tenkan **crosses above** Kijun
3. ❌ ATR trailing stop hit (2.0 × ATR)
4. ❌ Take profit hit (3.0 × ATR)
---
## **💡 BEST PRACTICES**
### **Recommended Timeframes**
| Timeframe | Trading Style | Signals/Week |
|-----------|---------------|--------------|
| **15m** | Scalping | 20-30 |
| **1H** | Day Trading | 10-15 |
| **4H** | Swing Trading | 5-10 |
| **Daily** | Position Trading | 2-5 |
---
### **Asset Classes**
✅ **Best Performance:**
- Major Forex pairs (EUR/USD, GBP/USD)
- Crypto (BTC/USD, ETH/USD)
- Major indices (SPX, NAS100)
⚠️ **Use Caution:**
- Low liquidity pairs
- Highly volatile altcoins
- Stocks with gaps
---
### **Risk Management Rules**
```
1. Never risk more than 2% per trade
2. Use the built-in ATR stops (don't override)
3. Respect the "Min Bars Between Trades" cooldown
4. Don't trade during major news events
5. Monitor dashboard - only trade STRONG signals
```
---
## **🔧 OPTIMIZATION GUIDE**
### **Step 1: Run Initial Backtest**
1. Open **Strategy Tester** tab (bottom of screen)
2. Set date range (minimum 6 months)
3. Review:
- **Net Profit**
- **Win Rate** (target: >50%)
- **Profit Factor** (target: >1.5)
- **Max Drawdown** (target: <20%)
---
### **Step 2: Optimize Parameters**
**If Win Rate is Low (<45%):**
- Increase RSI thresholds (Long=60, Short=40)
- Enable both Chikou + Cloud filters
- Increase "Min Bars Between Trades" to 5
**If Too Few Signals:**
- Decrease RSI thresholds (Long=50, Short=50)
- Reduce EMA to 150
- Adjust Ichimoku to faster settings (7/22/44)
**If Drawdown is High (>25%):**
- Increase ATR Stop Loss Multiplier to 2.5
- Add longer cooldown period (5+ bars)
- Trade only STRONG signals
---
### **Step 3: Forward Test**
```
1. Paper trade for 2-4 weeks
2. Compare results to backtest
3. Adjust if live results differ significantly
4. Only go live after consistent paper trading success
```
---
## **🛠️ TROUBLESHOOTING**
### **Problem: No Signals Appearing**
**Solutions:**
- Check RSI levels aren't too restrictive
- Verify timeframe is appropriate (try 1H or 4H)
- Ensure both filters aren't enabled on ranging markets
- Review dashboard - components may be conflicting
---
### **Problem: Too Many Losing Trades**
**Solutions:**
- Enable **both** Chikou + Cloud filters
- Increase RSI thresholds (more conservative)
- Only trade when dashboard shows "STRONG" signals
- Increase cooldown period to avoid overtrading
---
### **Problem: Dashboard Not Showing**
**Solutions:**
- Verify "Show Dashboard" is enabled in settings
- Check chart isn't zoomed out too far
- Refresh chart (F5)
- Re-add indicator to chart
---
### **Problem: Stops Too Tight/Wide**
**Solutions:**
- **Too Tight**: Increase ATR Stop Loss Multiplier to 2.5-3.0
- **Too Wide**: Decrease to 1.5-1.8
- Verify ATR Length is appropriate for timeframe
- Consider asset volatility (crypto needs wider stops)
---
## **📞 QUICK REFERENCE CARD**
```
═══════════════════════════════════════════════════
STRATEGY QUICK REFERENCE
═══════════════════════════════════════════════════
BEST TIMEFRAMES: 1H, 4H, Daily
BEST ASSETS: Major Forex, BTC, ETH, Indices
RISK PER TRADE: 1-2% of capital
LONG ENTRY:
✓ Price > 200 EMA
✓ Price > Cloud
✓ TK Bull Cross
✓ RSI > 55
✓ Dashboard = STRONG LONG
SHORT ENTRY:
✓ Price < 200 EMA
✓ Price < Cloud
✓ TK Bear Cross
✓ RSI < 45
✓ Dashboard = STRONG SHORT
EXITS:
× Cloud breach
× TK reverse cross
× ATR trailing stop
× Take profit (3:1 R:R)
═══════════════════════════════════════════════════
```
---
## **⚠️ DISCLAIMER**
This strategy is for **educational purposes only**. Always:
- Backtest thoroughly on your specific assets
- Paper trade before going live
- Never risk more than you can afford to lose
- Past performance ≠ future results
- Consider market conditions and your risk tolerance
---
**Happy Trading! 📈**
TradingView — Track All Markets
Where the world charts, chats, and trades markets. We're a supercharged super-charting platform and social network for traders and investors. Free to sign up.

KCP RSI Ultra PRO [Dr. K. C. Prakash]Indicator Name:
KCP RSI Ultra PRO
Description:
KCP RSI Ultra PRO is a professional-grade, noise-free RSI momentum indicator designed to deliver high-probability BUY and SELL signals by aligning momentum with the primary market trend. Unlike traditional RSI indicators that rely only on overbought and oversold levels, this indicator uses smart RSI zones (40–60) combined with a 200-period Exponential Moving Average (EMA) to filter false signals and sideways market noise.
The indicator generates signals only when:
Price direction aligns with the EMA-200 trend
RSI confirms momentum through zone crossover
RSI slope validates strength (rising for BUY, falling for SELL)
This disciplined approach helps traders avoid emotional entries and focus on trend-supported momentum trades.
Key Features:
Trend-filtered RSI logic
Clean and minimal visual design
Reduced false signals
Suitable for intraday and swing trading
Works across stocks, indices, commodities, crypto, and forex
Best Used For:
Trend-following strategies in trending market conditions.
Developed by:
Dr. K. C. Prakash

Vwap by EVThis indicator provides a complete multi-VWAP framework designed for traders who rely on price acceptance, value areas, and mean reversion across different market horizons. It plots Session, Daily, and Weekly VWAPs simultaneously, allowing users to understand short-term, intraday, and higher-timeframe value in a single, uncluttered view.
The Session VWAP supports custom trading hours and timezones, making it adaptable to equities, indices, forex, and crypto markets. All VWAP calculations are volume-weighted and non-repainting, with optional standard deviation bands based on true volume dispersion rather than fixed offsets. This ensures that each VWAP reflects genuine market participation and volatility.
Daily and Weekly VWAPs act as higher-timeframe equilibrium references, helping traders identify premium and discount zones, dynamic support and resistance, and directional bias. Optional band visibility and independent styling allow the indicator to remain clean while still providing depth when needed.

Volume-Adjusted CCI Trend [Alpha Extract]A sophisticated trend identification system that combines dual EMA direction analysis with volume-weighted normalization and CCI momentum filtering for comprehensive trend validation. Utilizing Volume RSI integration and standard deviation-based bands that expand and contract with volume characteristics, this indicator delivers institutional-grade trend detection with multi-layered confirmation requirements. The system's volume adjustment mechanism modulates signal sensitivity based on participation strength while CCI thresholds prevent false signals during weak momentum conditions, creating a robust trend-following framework with reduced whipsaw susceptibility.
🔶 Advanced Dual EMA Direction Engine
Implements fast and slow exponential moving average comparison to establish primary trend direction bias with configurable period parameters for timeframe optimization. The system calculates trend direction as binary +1 (bullish when fast EMA exceeds slow EMA) or -1 (bearish when slow exceeds fast), providing foundational directional input that requires additional confirmation before generating actionable trend states.
🔶 Volume-Adjusted Normalization Framework
Features sophisticated normalization calculation that measures price deviation from basis EMA, scales by standard deviation, then applies volume-weighted adjustment factor for participation-sensitive signal generation. The system calculates Volume RSI to quantify relative volume strength, converts to ratio format, and multiplies normalized deviation by volume factor scaled by impact parameter, creating signals that strengthen during high-volume confirmations and weaken during low-volume moves.
// Volume-Adjusted Normalization
Vol_Ratio = Volume_RSI / 50
Vol_Factor = 1 + (Vol_Ratio - 1) * Vol_Impact
Dev = src - Basis_EMA
Raw_Normalized = Dev / (StdDev * Multiplier)
Vol_Adjusted_Norm = Raw_Normalized * Vol_Factor
🔶 CCI Momentum Filter Integration
Implements Commodity Channel Index threshold system with configurable upper and lower bounds to validate trend strength and filter sideways market conditions. The system calculates standard CCI with adjustable length, compares against asymmetric thresholds (default +100 bullish, -50 bearish), and requires CCI confirmation in addition to EMA direction and normalized deviation before transitioning trend states, ensuring only high-conviction signals generate entries.
🔶 Multi-Layer Trend State Logic
Provides intelligent trend state machine requiring simultaneous confirmation from EMA direction, volume-adjusted normalization threshold breach, and optional CCI momentum validation. The system maintains persistent trend state that only transitions when all three conditions align, preventing premature reversals during temporary retracements or low-volume fluctuations while capturing genuine trend changes with institutional-grade confirmation requirements.
🔶 Dynamic Volume Band Architecture
Creates volatility-adjusted bands around basis EMA using standard deviation multiplied by volume factor, producing channels that widen during high-volume periods and contract during low-volume consolidations. The system applies identical volume adjustment to band calculations as normalization metric, ensuring visual envelope consistency with underlying signal logic and providing intuitive reference boundaries for trend-following price action.
🔶 Gradient Strength Visualization System
Implements color intensity modulation based on normalized signal strength relative to threshold requirements, creating visual feedback that communicates trend conviction. The system calculates strength ratio by dividing absolute normalized value by threshold, caps at 1.0, and applies gradient interpolation from muted to vivid colors, instantly conveying whether current trend exhibits marginal or strong characteristics through line and candle coloring.
🔶 Volume RSI Calculation Engine
Utilizes RSI methodology applied to volume series rather than price to quantify relative participation strength with normalization to 0.5-1.5 range for factor multiplication. The system processes volume through standard RSI calculation, divides by 50 to center around 1.0, and produces ratio values where readings above 1.0 indicate above-average volume and below 1.0 suggest below-average participation for signal adjustment purposes.
🔶 Asymmetric Threshold Configuration
Features separate positive and negative normalization thresholds with independent CCI upper and lower bounds enabling optimization for bullish versus bearish signal generation characteristics. The system defaults to symmetric normalized thresholds (±0.2) but asymmetric CCI levels (+100/-50), recognizing that bullish momentum often requires stronger confirmation than bearish reversals in typical market structures.
🔶 Comprehensive Visual Integration
Provides multi-dimensional trend visualization through color-coded basis line, volume-adjusted bands with gradient fills, trend-synchronized candle coloring, and transition signal labels. The system enables selective display toggling for each visual component while maintaining consistent color scheme and strength-based intensity across all elements for cohesive chart presentation without overwhelming information density.
🔶 Alert and Signal Framework
Generates trend change alerts when state transitions occur with all confirmation requirements satisfied, providing notifications for bullish (transition to +1) and bearish (transition to -1) signals. The system implements state change detection through comparison with previous bar trend state, ensuring single alert per transition rather than continuous notifications during sustained trends.
🔶 Performance Optimization Architecture
Employs efficient calculation methods with null value handling for Volume RSI initialization and nz() functions preventing calculation errors during early bars. The system includes intelligent state persistence maintaining previous trend during ambiguous conditions and optimized gradient calculations balancing visual quality with computational efficiency across extended historical periods.
🔶 Why Choose Volume-Adjusted CCI Trend ?
This indicator delivers sophisticated trend identification through multi-layered confirmation combining directional EMA analysis, volume-weighted normalization, and momentum validation via CCI filtering. Unlike traditional trend indicators relying solely on price-based calculations, the volume adjustment mechanism ensures signals strengthen during high-participation moves and weaken during low-volume drifts, reducing false breakouts and choppy market whipsaws. The system's requirement for simultaneous EMA direction, normalized threshold breach, and CCI momentum confirmation creates institutional-grade signal quality suitable for systematic trend-following approaches across cryptocurrency, forex, and equity markets. The volume-adjusted bands provide dynamic support/resistance references while the gradient strength visualization enables instant assessment of trend conviction for position sizing and risk management decisions.

My Swift-like Algo ALIMOJANIDSwift Algo Chart is a trend-following trading indicator designed to provide clear bias, precise entries, and visual risk management.
It combines EMA trend direction, pullback-based signals, market structure (HH/HL/LH/LL), and ATR-based Stop Loss & Take Profit levels to help traders make disciplined decisions.
🔑 Key Features
Trend Regime Detection
Identifies LONG, SHORT, or NO TRADE conditions using Fast & Slow EMAs.
Pullback Entry Signals
Signals appear only in the direction of the active trend, with optional RSI confirmation.
ATR-Based Risk Levels
Automatically plots SL, TP1, and TP2, including exact price values on the chart.
Preview Levels
Shows projected SL/TP levels when a trend is active, even before an entry.
Market Structure Visualization
Marks HH / HL / LH / LL, draws structure lines, and highlights BOS and CHOCH.
Clean & Non-Repainting Logic
Uses confirmed pivots and closed candles for stability.
Strategy-Compatible
Can be used for discretionary trading or full strategy backtesting.
🧠 Best Used For
Crypto, Forex, Indices
15m to 4H timeframes
Traders who want structure + trend + risk clarity in one tool
