TrendTwisterV1.5 (Forex Ready + Indicators)A Precision Trend-Following TradingView Strategy for Forex**
HullShiftFX is a Pine Script strategy for TradingView that combines the power of the **Hull Moving Average (HMA)** and a **shifted Exponential Moving Average (EMA)** with multi-layered momentum filters including **RSI** and **dual Stochastic Oscillators**.
It’s designed for traders looking to catch high-probability breakouts with tight risk management and visual clarity.
Chart settings:
1. Select "Auto - Fits data to screen"
2. Please Select "Scale Price Chart Only" (To make the chart not squished)
### ✅ Entry Conditions
**Long Position:**
- Price closes above the 12-period Hull Moving Average.
- Price closes above the 5-period EMA shifted forward by 2 bars.
- RSI is above 50.
- Stochastic Oscillator (12,3,3) %K is above 50.
- Stochastic Oscillator (5,3,3) %K is above 50.
- Hull MA crosses above the shifted EMA.
**Short Position:**
- Price closes below the 12-period Hull Moving Average.
- Price closes below the 5-period EMA shifted forward by 2 bars.
- RSI is below 50.
- Stochastic Oscillator (12,3,3) %K is below 50.
- Stochastic Oscillator (5,3,3) %K is below 50.
- Hull MA crosses below the shifted EMA.
---
## 📉 Risk Management
- **Stop Loss:** Set at the low (for long) or high (for short) of the previous 2 candles.
- **Take Profit:** Calculated at a risk/reward ratio of **1.65x** the stop loss distance.
---
## 📊 Indicators Used
- **Hull Moving Average (12)**
- **Exponential Moving Average (5) **
- **Relative Strength Index (14)**
- **Stochastic Oscillators:**
- %K (12,3,3)
- %K (5,3,3)
"forex"に関するスクリプトを検索

Multiple MAsHere's a well-written description in English for your "Multiple MAs" indicator that you can use when publishing on TradingView. It’s concise, professional, and highlights the key features of the indicator while explaining its purpose for traders.
---
### Multiple MAs Indicator
#### Overview
The **Multiple MAs** indicator is a versatile and straightforward tool designed to help traders visualize price trends using multiple Simple Moving Averages (SMAs) on a single chart. By plotting six SMAs with customizable lengths (MA5, MA10, MA20, MA50, MA100, and MA200), this indicator provides a clear view of short-term, medium-term, and long-term trends, making it ideal for trend-following strategies, crossover analysis, and identifying potential support/resistance levels.
#### Features
- **Customizable MA Lengths**: Adjust the periods of all six moving averages (MA5, MA10, MA20, MA50, MA100, MA200) to suit your trading style and timeframe.
- **Distinct Visuals**: Each MA is plotted with a unique color and line width for easy identification:
- MA5 (Dodger Blue, 1px)
- MA10 (Green, 1px)
- MA20 (Red, 2px)
- MA50 (Purple, 3px)
- MA100 (Gray, 3px)
- MA200 (White, 3px)
- **Overlay on Price Chart**: The indicator overlays directly on the price chart, allowing for seamless integration with other technical analysis tools.
- **High Precision**: Displays values with 8-decimal precision, ensuring accuracy for assets with small price movements (e.g., forex pairs or cryptocurrencies).
#### How to Use
1. **Trend Identification**: Use the longer MAs (e.g., MA100, MA200) to determine the overall trend direction. If the price is above these MAs, the trend is likely bullish; if below, it’s likely bearish.
2. **Crossover Signals**: Look for crossovers between shorter MAs (e.g., MA5 crossing MA20) for potential entry or exit signals. For example:
- A bullish signal occurs when a shorter MA crosses above a longer MA.
- A bearish signal occurs when a shorter MA crosses below a longer MA.
3. **Support and Resistance**: MAs often act as dynamic support or resistance levels. Watch for price reactions around these lines, especially the MA50, MA100, and MA200.
4. **Divergence Analysis**: Compare the slope of different MAs to identify potential trend reversals or weakening momentum.
#### Settings
- **MA5 Length**: Default is 5 bars.
- **MA10 Length**: Default is 10 bars.
- **MA20 Length**: Default is 20 bars.
- **MA50 Length**: Default is 50 bars.
- **MA100 Length**: Default is 100 bars.
- **MA200 Length**: Default is 200 bars.
#### Best Practices
- **Timeframe**: This indicator works on any timeframe but is particularly effective on daily, 4-hour, and 1-hour charts for swing trading or trend-following strategies.
- **Combine with Other Tools**: Pair the Multiple MAs with other indicators like RSI, MACD, or volume analysis to confirm signals and avoid false breakouts.
- **Adjust for Volatility**: For highly volatile assets, consider increasing the MA lengths to reduce noise and focus on broader trends.
#### Notes
- The indicator is lightweight and optimized for performance, ensuring it runs smoothly even on lower timeframes.
- Colors and line widths are pre-set for clarity but can be customized in the indicator settings if needed.
#### Credits
Created by kosar_v. Feedback and suggestions are welcome to improve this tool for the TradingView community!

Volume Profile & Smart Money Explorer🔍 Volume Profile & Smart Money Explorer: Decode Institutional Footprints
Master the art of institutional trading with this sophisticated volume analysis tool. Track smart money movements, identify peak liquidity windows, and align your trades with major market participants.
🌟 Key Features:
📊 Triple-Layer Volume Analysis
• Total Volume Patterns
• Directional Volume Split (Up/Down)
• Institutional Flow Detection
• Real-time Smart Money Tracking
• Historical Pattern Recognition
⚡ Smart Money Detection
• Institutional Trade Identification
• Large Block Order Tracking
• Smart Money Concentration Periods
• Whale Activity Alerts
• Volume Threshold Analysis
📈 Advanced Profiling
• Hourly Volume Distribution
• Directional Bias Analysis
• Liquidity Heat Maps
• Volume Pattern Recognition
• Custom Threshold Settings
🎯 Strategic Applications:
Institutional Trading:
• Track Big Player Movements
• Identify Accumulation/Distribution
• Follow Smart Money Flow
• Detect Institutional Trading Windows
• Monitor Block Orders
Risk Management:
• Identify High Liquidity Windows
• Avoid Thin Market Periods
• Optimize Position Sizing
• Track Market Participation
• Monitor Volume Quality
Market Analysis:
• Volume Pattern Recognition
• Smart Money Flow Analysis
• Liquidity Window Identification
• Institutional Activity Cycles
• Market Depth Analysis
💡 Perfect For:
• Professional Traders
• Volume Profile Traders
• Institutional Traders
• Risk Managers
• Algorithmic Traders
• Smart Money Followers
• Day Traders
• Swing Traders
📊 Key Metrics:
• Normalized Volume Profiles
• Institutional Thresholds
• Directional Volume Split
• Smart Money Concentration
• Historical Patterns
• Real-time Analysis
⚡ Trading Edge:
• Trade with Institution Flow
• Identify Optimal Entry Points
• Recognize Distribution Patterns
• Follow Smart Money Positioning
• Avoid Thin Markets
• Capitalize on Peak Liquidity
🎓 Educational Value:
• Understand Market Structure
• Learn Volume Analysis
• Master Institutional Patterns
• Develop Market Intuition
• Track Smart Money Flow
🛠️ Customization:
• Adjustable Time Windows
• Flexible Volume Thresholds
• Multiple Timeframe Analysis
• Custom Alert Settings
• Visual Preference Options
Whether you're tracking institutional flows in crypto markets or following smart money in traditional markets, the Volume Profile & Smart Money Explorer provides the deep insights needed to trade alongside the biggest players.
Transform your trading from retail guesswork to institutional precision. Know exactly when and where smart money moves, and position yourself ahead of major market shifts.
#VolumeProfile #SmartMoney #InstitutionalTrading #MarketAnalysis #TradingView #VolumeAnalysis #CryptoTrading #ForexTrading #TechnicalAnalysis #Trading #PriceAction #MarketStructure #OrderFlow #Liquidity #RiskManagement #TradingStrategy #DayTrading #SwingTrading #AlgoTrading #QuantitativeTrading

Nef33 Forex & Crypto Trading Signals PRO
1. Understanding the Indicator's Context
The indicator generates signals based on confluence (trend, volume, key zones, etc.), but it does not include predefined SL or TP levels. To establish them, we must:
Use dynamic or static support/resistance levels already present in the script.
Incorporate volatility (such as ATR) to adjust the levels based on market conditions.
Define a risk/reward ratio (e.g., 1:2).
2. Options for Determining SL and TP
Below, I provide several ideas based on the tools available in the script:
Stop Loss (SL)
The SL should protect you from adverse movements. You can base it on:
ATR (Volatility): Use the smoothed ATR (atr_smooth) multiplied by a factor (e.g., 1.5 or 2) to set a dynamic SL.
Buy: SL = Entry Price - (atr_smooth * atr_mult).
Sell: SL = Entry Price + (atr_smooth * atr_mult).
Key Zones: Place the SL below a support (for buys) or above a resistance (for sells), using Order Blocks, Fair Value Gaps, or Liquidity Zones.
Buy: SL below the nearest ob_lows or fvg_lows.
Sell: SL above the nearest ob_highs or fvg_highs.
VWAP: Use the daily VWAP (vwap_day) as a critical level.
Buy: SL below vwap_day.
Sell: SL above vwap_day.
Take Profit (TP)
The TP should maximize profits. You can base it on:
Risk/Reward Ratio: Multiply the SL distance by a factor (e.g., 2 or 3).
Buy: TP = Entry Price + (SL Distance * 2).
Sell: TP = Entry Price - (SL Distance * 2).
Key Zones: Target the next resistance (for buys) or support (for sells).
Buy: TP at the next ob_highs, fvg_highs, or liq_zone_high.
Sell: TP at the next ob_lows, fvg_lows, or liq_zone_low.
Ichimoku: Use the cloud levels (Senkou Span A/B) as targets.
Buy: TP at senkou_span_a or senkou_span_b (whichever is higher).
Sell: TP at senkou_span_a or senkou_span_b (whichever is lower).
3. Practical Implementation
Since the script does not automatically draw SL/TP, you can:
Calculate them manually: Observe the chart and use the levels mentioned.
Modify the code: Add SL/TP as labels (label.new) at the moment of the signal.
Here’s an example of how to modify the code to display SL and TP based on ATR with a 1:2 risk/reward ratio:
Modified Code (Signals Section)
Find the lines where the signals (trade_buy and trade_sell) are generated and add the following:
pinescript
// Calculate SL and TP based on ATR
atr_sl_mult = 1.5 // Multiplier for SL
atr_tp_mult = 3.0 // Multiplier for TP (1:2 ratio)
sl_distance = atr_smooth * atr_sl_mult
tp_distance = atr_smooth * atr_tp_mult
if trade_buy
entry_price = close
sl_price = entry_price - sl_distance
tp_price = entry_price + tp_distance
label.new(bar_index, low, "Buy: " + str.tostring(math.round(bull_conditions, 1)), color=color.green, textcolor=color.white, style=label.style_label_up, size=size.tiny)
label.new(bar_index, sl_price, "SL: " + str.tostring(math.round(sl_price, 2)), color=color.red, textcolor=color.white, style=label.style_label_down, size=size.tiny)
label.new(bar_index, tp_price, "TP: " + str.tostring(math.round(tp_price, 2)), color=color.blue, textcolor=color.white, style=label.style_label_up, size=size.tiny)
if trade_sell
entry_price = close
sl_price = entry_price + sl_distance
tp_price = entry_price - tp_distance
label.new(bar_index, high, "Sell: " + str.tostring(math.round(bear_conditions, 1)), color=color.red, textcolor=color.white, style=label.style_label_down, size=size.tiny)
label.new(bar_index, sl_price, "SL: " + str.tostring(math.round(sl_price, 2)), color=color.red, textcolor=color.white, style=label.style_label_up, size=size.tiny)
label.new(bar_index, tp_price, "TP: " + str.tostring(math.round(tp_price, 2)), color=color.blue, textcolor=color.white, style=label.style_label_down, size=size.tiny)
Code Explanation
SL: Calculated by subtracting/adding sl_distance to the entry price (close) depending on whether it’s a buy or sell.
TP: Calculated with a double distance (tp_distance) for a 1:2 risk/reward ratio.
Visualization: Labels are added to the chart to display SL (red) and TP (blue).
4. Practical Strategy Without Modifying the Code
If you don’t want to modify the script, follow these steps manually:
Entry: Take the trade_buy or trade_sell signal.
SL: Check the smoothed ATR (atr_smooth) on the chart or calculate a fixed level (e.g., 1.5 times the ATR). Also, review nearby key zones (OB, FVG, VWAP).
TP: Define a target based on the next key zone or multiply the SL distance by 2 or 3.
Example:
Buy at 100, ATR = 2.
SL = 100 - (2 * 1.5) = 97.
TP = 100 + (2 * 3) = 106.
5. Recommendations
Test in Demo: Apply this logic in a demo account to adjust the multipliers (atr_sl_mult, atr_tp_mult) based on the market (forex or crypto).
Combine with Zones: If the ATR-based SL is too wide, use the nearest OB or FVG as a reference.
Risk/Reward Ratio: Adjust the TP based on your tolerance (1:1, 1:2, 1:3)

FinFluential Global M2 Money Supply // Days Offset =The "Global M2 Money Supply" indicator calculates and visualizes the combined M2 money supply from multiple countries and regions worldwide, expressed in trillions of USD.
M2 is a measure of the money supply that includes cash, checking deposits, and easily convertible near-money assets. This indicator aggregates daily M2 data from various economies, converts them into a common USD base using forex exchange rates, and plots the total as a single line on the chart.
It is designed as an overlay indicator aligned to the right scale, making it ideal for comparing global money supply trends with price action or other market data.
Key Features
Customizable Time Offset: Users can adjust the number of days to shift the M2 data forward or backward (from -1000 to +1000 days) via the indicator settings. This allows for alignment with historical events or forward-looking analysis.
Global Coverage Includes:
Eurozone: Eurozone M2 (converted via EUR/USD)
North America: United States, Canada
Non-EU Europe: Switzerland, United Kingdom, Finland, Russia
Pacific: New Zealand
Asia: China, Taiwan, Hong Kong, India, Japan, Philippines, Singapore
Latin America: Brazil, Colombia, Mexico
Middle East: United Arab Emirates, Turkey
Africa: South Africa

Buy Signal Forex & Crypto v0 ImprovedPurpose of the Script:
This script is designed to generate buy and sell signals for trading Forex and cryptocurrencies by analyzing price trends using exponential moving averages (EMAs), volatility, and volume filters. The signals are displayed as arrows on the chart.
What the Script Does
Input Settings:
The script allows the user to configure various settings, such as the lengths of EMAs, a higher timeframe for trend confirmation, and thresholds for volume and volatility (ATR - Average True Range).
Key settings:
5 EMA Length – Length of the short-term EMA.
13 EMA Length – Length of the medium-term EMA.
26 EMA Length – Length of the long-term EMA.
21 EMA Length – Used for trend confirmation on a higher timeframe.
Higher Timeframe – Lets you select a timeframe (e.g., daily) for confirming the overall trend.
ATR Threshold – Filters out signals when the market's volatility is too low.
Volume Filter – Ensures sufficient trading activity before generating signals.
Calculating EMAs (Exponential Moving Averages):
Four EMAs are calculated:
ema5 (short-term), ema13 (medium-term), ema26 (long-term), and ema21 (higher timeframe confirmation).
These EMAs help determine price trends and crossovers, which are critical for identifying buy and sell opportunities.
Trend Confirmation Using a Higher Timeframe:
The 21 EMA on the higher timeframe (e.g., daily) is used to confirm the overall direction of the market.
Defining Signal Conditions:
Buy Signal:
A buy signal is generated when:
ema5 crosses above ema13 (indicating a bullish trend).
ema5 crosses above ema26 (stronger bullish confirmation).
The closing price is above ema5, ema13, ema26, and the 21 EMA on the higher timeframe.
The market's volatility (ATR) is above the defined threshold.
The volume meets the conditions or volume filtering is disabled.
Sell Signal:
A sell signal is generated when:
ema5 crosses below ema13 (indicating a bearish trend).
ema5 crosses below ema26 (stronger bearish confirmation).
The closing price is below ema5, ema13, ema26, and the 21 EMA on the higher timeframe.
The market's volatility (ATR) is above the defined threshold.
The volume meets the conditions or volume filtering is disabled.
Volume Filtering:
Ensures there’s enough trading activity by comparing the current volume to a 20-period moving average of volume.
Persistent Variables:
These variables (crossed13 and crossed13Sell) help track whether the short-term EMA (ema5) has crossed the medium-term EMA (ema13). This prevents false or repeated signals.
Displaying Signals on the Chart:
Buy signals are displayed as green upward arrows below the price.
Sell signals are displayed as red downward arrows above the price.
How It Helps Traders:
This script provides visual cues for potential entry and exit points by combining moving average crossovers, volatility, volume, and higher timeframe trend confirmation. It works well for trending markets and ensures signals are filtered for stronger conditions to reduce noise.

Sessions Full Markets [TradingFinder] Forex Stocks Index 7 Time🔵 Introduction
In global financial markets, particularly in FOREX and stocks, precise timing of trading sessions plays a crucial role in the success of traders. Each trading session—Asian, European, and American—has its own unique characteristics in terms of volatility and trading volume.
The Asian session (Tokyo), Sydney session, Shanghai session, European session (London and Frankfurt), and American session (New York AM and New York PM) are examples of these trading sessions, each of which opens and closes at specific times.
This session indicator also includes a Time Convertor, enabling users to view FOREX market hours based on GMT, UTC, EST, and local time. Another valuable feature of this indicator is the automatic detection of Daylight Saving Time (DST), which automatically applies time changes for the New York, London, and Sydney sessions.
🔵 How to Use
The indicator also displays session times based on the exact opening and closing times for each geographic region. Users can utilize this indicator to view trading hours either locally or in UTC time, and if needed, set their own custom trading times.
Additionally, the session information table includes the start and end times of each session and whether they are open or closed. This functionality helps traders make better trading decisions by using accurate and precise time data.
Key Features of the Session Indicator
The session indicator is a versatile and advanced tool that provides several unique features for traders.
Some of these features are :
• Automatic Daylight Saving Time (DST) Detection : This indicator dynamically detects Daylight Saving Time (DST) changes for various trading sessions, including New York, London, and Sydney, without requiring manual adjustments. This feature allows traders to manage their trades without worrying about time changes.
Below are the start and end dates for DST in the New York, London, and Sydney trading sessions :
1. New York :
Start of DST: Second Sunday of March, at 2:00 AM.
End of DST: First Sunday of November, at 2:00 AM
2. London :
Start of DST: Last Sunday of March, at 1:00 AM.
End of DST: Last Sunday of October, at 2:00 AM.
3. Sydney :
Start of DST: First Sunday of October, at 2:00 AM.
End of DST: First Sunday of April, at 3:00 AM.
• Session Display Based on Different Time Zones : The session indicator allows users to view trading times based on different time zones, such as UTC, the local time of each market, or the user’s local time. This feature is especially useful for traders operating in diverse geographic regions.
• Custom Trading Time Setup : Another notable feature of this indicator is the ability to set custom trading times. Traders can adjust their own trading times according to their personal strategies and benefit from this flexibility.
• Session Information Table : The session indicator provides a complete information table that includes the exact start and end times of each trading session and whether they are open or closed. This table helps users simultaneously and accurately monitor the status of all trading sessions and make better trading decisions.
🟣 Session Trading Hours Based on Market Mode and Time Zones
The session indicator provides precise information on the start and end times of trading sessions.
These times are adjusted based on different market modes (FOREX, stocks, and TFlab suggestions) and time zones (UTC and local time) :
🟣 (FOREX Session Time) Forex Market Mode
• Sessions in UTC (DST inactive) :
Sydney: 22:00 - 06:00
Tokyo: 23:00 - 07:00
Shanghai: 01:00 - 09:00
Asia: 22:00 - 07:00
Europe: 07:00 - 16:00
London: 08:00 - 16:00
New York: 13:00 - 21:00
• Sessions in UTC (DST active) :
Sydney: 21:00 - 05:00
Tokyo: 23:00 - 07:00
Shanghai: 01:00 - 09:00
Asia: 21:00 - 07:00
Europe: 06:00 - 15:00
London: 07:00 - 15:00
New York: 12:00 - 20:00
• Sessions in Local Time :
Sydney: 08:00 - 16:00
Tokyo: 08:00 - 16:00
Shanghai: 09:00 - 17:00
Asia: 22:00 - 07:00
Europe: 07:00 - 16:00
London: 08:00 - 16:00
New York: 08:00 - 16:00
🟣 Stock Market Trading Hours (Stock Market Mode)
• Sessions in UTC (DST inactive) :
Sydney: 00:00 - 06:00
Asia: 00:00 - 06:00
Europe: 07:00 - 16:30
London: 08:00 - 16:30
New York: 14:30 - 21:00
Tokyo: 00:00 - 06:00
Shanghai: 01:30 - 07:00
• Sessions in UTC (DST active) :
Sydney: 23:00 - 05:00
Asia: 23:00 - 06:00
Europe: 06:00 - 15:30
London: 07:00 - 15:30
New York: 13:30 - 20:00
Tokyo: 00:00 - 06:00
Shanghai: 01:30 - 07:00
• Sessions in Local Time:
Sydney: 10:00 - 16:00
Tokyo: 09:00 - 15:00
Shanghai: 09:30 - 15:00
Asia: 00:00 - 06:00
Europe: 07:00 - 16:30
London: 08:00 - 16:30
New York: 09:30 - 16:00
🟣 TFlab Suggestion Mode
• Sessions in UTC (DST inactive) :
Sydney: 23:00 - 05:00
Tokyo: 00:00 - 06:00
Shanghai: 01:00 - 09:00
Asia: 23:00 - 06:00
Europe: 07:00 - 16:00
London: 08:00 - 16:00
New York: 13:00 - 21:00
• Sessions in UTC (DST active) :
Sydney: 22:00 - 04:00
Tokyo: 00:00 - 06:00
Shanghai: 01:00 - 09:00
Asia: 22:00 - 06:00
Europe: 06:00 - 15:00
London: 07:00 - 15:00
New York: 12:00 - 20:00
• Sessions in Local Time :
Sydney: 09:00 - 16:00
Tokyo: 09:00 - 15:00
Shanghai: 09:00 - 17:00
Asia: 23:00 - 06:00
Europe: 07:00 - 16:00
London: 08:00 - 16:00
New York: 08:00 - 16:00
🔵 Setting
Using the session indicator is straightforward and practical. Users can add this indicator to their trading chart and take advantage of its features.
The usage steps are as follows :
Selecting Market Mode : The user can choose one of the three main modes.
Forex Market Mode: Displays the forex market trading hours.
oStock Market Mode: Displays the trading hours of stock exchanges.
Custom Mode: Allows the user to set trading hours based on their needs.
TFlab Suggestion Mode: Displays the higher volume hours of the forex market in Asia.
Setting the Time Zone : The indicator allows displaying sessions based on various time zones. The user can select one of the following options:
UTC (Coordinated Universal Time)
Local Time of the Session
User’s Local Time
Displaying Comprehensive Session Information : The session information table includes the opening and closing times of each session and whether they are open or closed. This table helps users monitor all sessions at a glance and precisely set the best time for entering and exiting trades.
🔵Conclusion
The session indicator is a highly efficient and essential tool for active traders in the FOREX and stock markets. With its unique features, such as automatic DST detection and the ability to display sessions based on different time zones, the session indicator helps traders to precisely and efficiently adjust their trading activities.
This indicator not only shows users the exact opening and closing times of sessions, but by providing a session status table, it helps traders identify the best times to enter and exit trades. Moreover, the ability to set custom trading times allows traders to easily personalize their trading schedules according to their strategies.
In conclusion, using the session indicator ensures that traders are continuously and accurately informed of time changes and the opening and closing hours of markets, eliminating the need for manual updates to align with DST changes. These features enable traders to optimize their trading strategies with greater confidence and up-to-date information, allowing them to capitalize on opportunities in the market.

H-Infinity Volatility Filter [QuantAlgo]Introducing the H-Infinity Volatility Filter by QuantAlgo 📈💫
Enhance your trading/investing strategy with the H-Infinity Volatility Filter , a powerful tool designed to filter out market noise and identify clear trend signals in volatile conditions. By applying an advanced H∞ filtering process, this indicator assists traders and investors in navigating uncertain market conditions with improved clarity and precision.
🌟 Key Features:
🛠 Customizable Noise Parameters: Adjust worst-case noise and disturbance settings to tailor the filter to various market conditions. This flexibility helps you adapt the indicator to handle different levels of market volatility and disruptions.
⚡️ Dynamic Trend Detection: The filter identifies uptrends and downtrends based on the filtered price data, allowing you to quickly spot potential shifts in the market direction.
🎨 Color-Coded Visuals: Easily differentiate between bullish and bearish trends with customizable color settings. The indicator colors the chart’s candles according to the detected trend for immediate clarity.
🔔 Custom Alerts: Set alerts for trend changes, so you’re instantly informed when the market transitions from bullish to bearish or vice versa. Stay updated without constantly monitoring the charts.
📈 How to Use:
✅ Add the Indicator: Add the H-Infinity Volatility Filter to your favourites and apply it to your chart. Customize the noise and disturbance parameters to match the volatility of the asset you are trading/investing. This allows you to optimize the filter for your specific strategy.
👀 Monitor Trend Shifts: Watch for clear visual signals as the filter detects uptrends or downtrends. The color-coded candles and line plots help you quickly assess market conditions and potential reversals.
🔔 Set Alerts: Configure alerts to notify you when the trend changes, allowing you to react quickly to potential market shifts without needing to manually track price movements.
🌟 How It Works and Academic Background:
The H-Infinity Volatility Filter is built on the foundations of H∞ (H-infinity) control theory , a mathematical framework originating from the field of engineering and control systems. Developed in the 1980s by notable engineers such as George Zames and John C. Doyle , this theory was designed to help systems perform optimally under uncertain and noisy conditions. H∞ control focuses on minimizing the worst-case effects of disturbances and noise, making it a powerful tool for managing uncertainty in complex environments.
In financial markets, where unpredictable price fluctuations and noise often obscure meaningful trends, this same concept can be applied to price data to filter out short-term volatility. The H-Infinity Volatility Filter adopts this approach, allowing traders and investors to better identify potential trends by reducing the impact of random price movements. Instead of focusing on precise market predictions, the filter increases the probability of highlighting significant trends by smoothing out market noise.
This indicator works by processing historical price data through an H∞ filter that continuously adjusts based on worst-case noise levels and disturbances. By considering several past states, it estimates the current price trend while accounting for potential external disruptions that might influence price behavior. Parameters like "worst-case noise" and "disturbance" are user-configurable, allowing traders to adapt the filter to different market conditions. For example, in highly volatile markets, these parameters can be adjusted to manage larger price swings, while in more stable markets, they can be fine-tuned for smoother trend detection.
The H-Infinity Volatility Filter also incorporates a dynamic trend detection system that classifies price movements as bullish or bearish. It uses color-coded candles and plots—green for bullish trends and red for bearish trends—to provide clear visual cues for market direction. This helps traders and investors quickly interpret the trend and act on potential signals. While the indicator doesn’t guarantee accuracy in trend prediction, it significantly reduces the likelihood of false signals by focusing on meaningful price changes rather than random fluctuations.
How It Can Be Applied to Trading/Investing:
By applying the principles of H∞ control theory to financial markets, the H-Infinity Volatility Filter provides traders and investors with a sophisticated tool that manages uncertainty more effectively. Its design makes it suitable for use in a wide range of markets—whether in fast-moving, volatile environments or calmer conditions.
The indicator is versatile and can be used in both short-term trading and medium to long-term investing strategies. Traders can tune the filter to align with their specific risk tolerance, asset class, and market conditions, making it an ideal tool for reducing the effects of market noise while increasing the probability of detecting reliable trend signals.
For investors, the filter can help in identifying medium to long-term trends by filtering out short-term price swings and focusing on the broader market direction. Whether applied to stocks, forex, commodities, or cryptocurrencies, the H-Infinity Volatility Filter helps traders and investors interpret market behavior with more confidence by offering a more refined view of price movements through its noise reduction techniques.
Disclaimer:
The H-Infinity Volatility Filter is designed to assist in market analysis by filtering out noise and volatility. It should not be used as the sole tool for making trading or investment decisions. Always incorporate other forms of analysis and risk management strategies. No statements or signals from this indicator or us should be considered financial advice. Past performance is not indicative of future results.

VWAP Bands [TradingFinder] 26 Brokers Data (Forex + Crypto)🔵 Introduction
Indicators are tools that help analysts predict the price trend of a stock through mathematical calculations on price or trading volume. It is evident that trading volume significantly impacts the price trend of a stock symbol.
The Volume-Weighted Average Price (VWAP) indicator combines the influence of trading volume and price, providing technical analysts with a practical tool.
This technical indicator determines the volume-weighted average price of a symbol over a specified time period. Consequently, this indicator can be used to identify trends and entry or exit points.
🟣 Calculating the VWAP Indicator
Adding the VWAP indicator to a chart will automatically perform all calculations for you. However, if you wish to understand how this indicator is calculated, the following explains the steps involved.
Consider a 5-minute chart. In the first candle of this chart (which represents price information in the first 5 minutes), sum the high, low, and close prices, and divide by 3. Multiply the resulting number by the volume for the period and call it a variable (e.g., X).
Then, divide the resulting output by the total volume for that period to calculate your VWAP. To maintain the VWAP sequence throughout the trading day, it is necessary to add the X values obtained from each period to the previous period and divide by the total volume up to that time. It is worth noting that the calculation method is the same for intervals shorter than a day.
The mathematical formula for this VWAP indicator : VWAP = ∑ (Pi×Vi) / ∑ Vi
🔵 How to Use
Traders might consider the VWAP indicator as a tool for predicting trends. For example, they might buy a stock when the price is above the VWAP level and sell it when the price is below the VWAP.
In other words, when the price is above the VWAP, the price is rising, and when it is below the VWAP, the price is falling. Major traders and investment funds also use the VWAP ratio to help enter or exit stocks with the least possible market impact.
It is important to note that one should not rely solely on the VWAP indicator when analyzing symbols. This is because if prices rise quickly, the VWAP indicator may not adequately describe the conditions. This indicator is generally used for daily or shorter time frames because using longer intervals can distort the average.
Since this indicator uses past data in its calculations, it can be considered a lagging indicator. As a result, the more data there is, the greater the delay.
🟣 Difference Between VWAP and Simple Moving Average
On a chart, the VWAP and the simple moving average may look similar, but these two indicators have different calculations. The VWAP calculates the total price considering volume, while the simple moving average does not consider volume.
In simpler terms, the VWAP indicator measures each day's price change relative to the trading volume that occurred that day. In contrast, the simple moving average implicitly assumes that all trading days have the same volume.
🟣 Reasons Why Traders Like the VWAP Indicator
The VWAP Considers Volume: Since VWAP takes volume into account, it can be more reliable than a simple arithmetic average of prices. Theoretically, one person can buy 200,000 shares of a symbol in one transaction at a single price.
However, during the same time frame, 100 other people might place 200 different orders at various prices that do not total 100,000 shares. In this case, if you only consider the average price, you might be mistaken because trading volume is ignored.
The Indicator Can Help Day Traders: While reviewing your trades, you might notice that the shares you bought at market price are trading below the VWAP indicator.
In this case, there's no need to worry because with the help of VWAP, you always get a price below the average. By knowing the volume-weighted average price of a stock, you can easily make an informed decision about paying more or less than other traders for the stock.
VWAP Can Signal Market Trend Changes: Buying low and selling high can be an excellent strategy for individuals. However, you are looking to buy when prices start to rise and sell your shares when prices start to fall.
Since the VWAP indicator simulates a balanced price in the market, when the price crosses above the VWAP line, one can assume that traders are willing to pay more to acquire shares, and as a result, the market will grow. Conversely, when the price crosses below the line, this can be considered a sign of a downward movement.
🔵 Setting
Period : Indicator calculation time frame.
Source : The Price used for calculations.
Market Ultra Data : If you turn on this feature, 26 large brokers will be included in the calculation of the trading volume.
The advantage of this capability is to have more reliable volume data. You should be careful to specify the market you are in, FOREX brokers and Crypto brokers are different.
Multiplier : Coefficient of band lines.

FX Index Curve Oscillator (FICO)We can approximate the TVC:DXY with simple multiplication, rather than using geometric weighted averages; the values will be different, but the charts will look almost the same. Because we can make a "good enough" version of DXY, we can also extend this concept to the other major currencies:
AUD - Yellow
CAD - Red
CHF - Orange
EUR - Purple
GBP - Green
JPY - White
NZD - Lime green
USD - Blue
This indicator works by constructing an "index" for each currency, performing a lookback to figure out the rate of change, and then smoothing the values. These values are fed through an oscillator to normalize them between -1.00 and +1.00, before finally being smoothed again. Interestingly, using HMA to smooth them the second time will cause the values to leak past 1.00, which we can also use as a signal.
If you want to change the values, I find that the biggest difference comes from the lookback and oscillator settings; the MA/smoothing is probably good enough. The default settings are for doing forex trades on the daily chart. Other timeframes are possible, but I could not find any settings that work. It might also be possible to use a similar approach on other assets (crypto, metals, indexes, etc) but I have not tried yet.
In my own testing, what I found to be a good approach is to look for a currency to be above +1 and another to be below -1, and then look for color changes; ideally this will happen on the same bar/candle.
You can also consider two line crosses, breaking above or below 1, etc as other entry signals. I find that price will either move immediately, or take a candle or two to retrace and then start moving.
Happy trading!
Unfortunately, the indicator pane can get quite crowded; if you're testing for a single currency pair, you may want to disable some of the plotted lines:

Enhanced Forex IndicatorDescription of the "Enhanced Forex Indicator"
The "Enhanced Forex Indicator" is designed for traders who want a comprehensive technical analysis tool on the TradingView platform. This script integrates Exponential Moving Averages (EMAs), support and resistance zones, and candlestick pattern recognition to provide actionable trading signals, particularly useful for Forex and other financial markets. The script is suitable for intraday trading and swing trading.
Components of the Indicator
Exponential Moving Averages (EMAs):
Short EMA (Blue Line): Faster responding average, good for identifying recent trend changes.
Long EMA (Red Line): Slower moving average, helps in confirming longer-term trends.
Support and Resistance Zones:
Resistance Zone (Red): Area where potential selling pressure could overcome buying pressure, halting price increases temporarily or reversing them.
Support Zone (Green): Area where potential buying pressure could overcome selling pressure, supporting prices and preventing them from falling further.
Candlestick Patterns:
Bullish Engulfing Pattern (Green Triangle Up 'BE'): Suggests a potential upward reversal or start of a bullish trend.
Bearish Engulfing Pattern (Red Triangle Down 'BE'): Indicates a potential downward reversal or start of a bearish trend.
Buy/Sell Signals:
Buy Signal (Green Label 'BUY'): Triggered when the price is above both EMAs and a bullish engulfing pattern is detected.
Sell Signal (Red Label 'SELL'): Triggered when the price is below both EMAs and a bearish engulfing pattern is detected.
Trading Setup:
Entry: Consider entering a buy position when the 'BUY' signal appears, indicating bullish conditions. Enter a sell position when the 'SELL' signal appears, indicating bearish conditions.
Exit: Look for closing signals opposite your entry or use predefined take profit and stop loss levels. For instance, exit a buy position on a 'SELL' signal or when the price drops below the support zone.
Risk Management:
Set stop losses just below the support zone for buy orders and above the resistance zone for sell orders to protect against significant losses.
Adjust position sizes according to your risk tolerance and account balance.
Considerations:
Use this indicator in conjunction with other analysis tools and fundamental data to confirm signals and strengthen your trading strategy.
Periodically backtest the strategy based on this indicator to ensure its effectiveness in current market conditions.
Optimization:
Adjust the lengths of the EMAs and the buffer size of the support and resistance zones to better fit the asset's volatility and your trading timeframe.

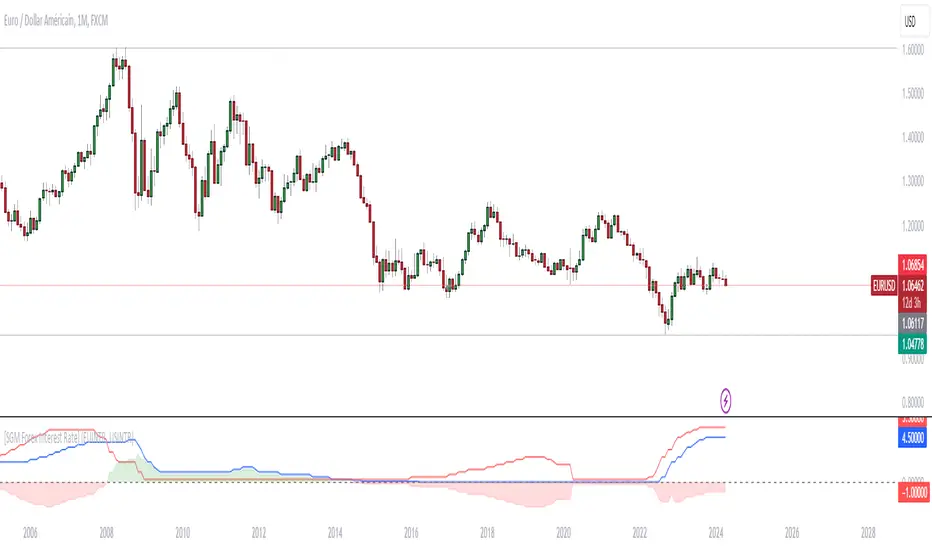
[SGM Forex Interest Rate]
Through an analysis of the interest rates of selected currencies, this indicator calculates the difference between these rates to provide an indication of the relative strength between the two currencies. This relative strength is graphically represented as an area with a specific color for better visualization.
The curves represent the values of the two selected currencies, while the colored area between them highlights the difference in strength. A horizontal line is also drawn at the zero level to help identify turning points or divergence points.
Interest rates play a crucial role in forex trading for several reasons:
Impact on capital flows: Interest rates affect international capital flows. Investors are attracted to currencies offering higher yields, which can lead to currency appreciation with higher interest rates.
Influence on monetary policy decisions: Central banks often adjust interest rates to achieve macroeconomic goals such as price stability, economic growth, and full employment. Announcements of interest rate changes or hints about the future direction of rates can have a significant impact on the foreign exchange market.
Determination of financing costs: Interest rates affect the financing costs of transactions in the foreign exchange market. Traders often borrow low-interest currencies to purchase higher-yielding currencies, which can lead to large movements in the market.
Economic Indicators: Interest rates are also key economic indicators. Changes in interest rates may reflect overall economic conditions and be interpreted as signs of economic growth or contraction.
Risk and volatility factors: Interest rate differences between two countries can create arbitrage opportunities, but also risks. Unexpected changes in interest rates or market expectations may result in increased volatility in the foreign exchange market.
In sum, interest rates are a fundamental part of the global financial landscape and are therefore crucial for forex traders, as they provide indications of economic trends, capital flows and trading opportunities.
Sessions Lite [TradingFinder] New York, London, Asia, NYSE Forex🔵 Introduction
A trading session is one of the basic concepts in the financial market that refers to specific time periods. In fact, a session means hours during the day and night, during which traders in a certain part of the world conduct their transactions.
Although the "Forex" and "CFDs" market is open 24 hours a day and it is possible to trade in it, but in some hours the activity in this market decreases so much that many traders prefer not to trade and only watch the market. On the other hand, there are specific times when the market is very busy and dynamic, and many traders tend to trade during these hours of the day and night.
Trading sessions are usually divided into three main categories, which are "Asian", "European" and "North American" sessions. These trading sessions are also called the "Tokyo", "London" and "New York" sessions, respectively. But they also categorized these sessions in more detailed ways such as "Sydney session", "Shanghai session" or "NYSE session".
🔵 Tokyo trading session (Asian session)
After the weekend that happens on Saturday and Sunday, the Forex market starts with the Asian session. In this continent, most of the transactions are done in the Tokyo session, and for this reason, it is usually called the Asian session or the Tokyo session. However, other countries such as Australia, China and Singapore also do a lot of trading in this session.
The Tokyo session has a lower volume of transactions compared to the London and New York sessions, and therefore the liquidity is lower. In this session, most of the Forex currency pairs move in a price range. For this reason, different people use the ups and downs with the trading strategy in the range and get profit.
The low liquidity of the Tokyo session means that trading spreads are also higher during these hours. Besides, most of the transactions of this session are done in the early hours and at the same time as the planned news release.
In the Tokyo or Asia session, the best currency pairs to trade are the "Japanese yen", the "Australian dollar", and the "New Zealand dollar".
"Nikkei" index is also a good option for trading. If you trade in the Tokyo session, you should also be aware of the release of economic news and data from Australian, New Zealand and Japanese financial institutions.
🔵 London trading session (European session)
After the Asian session, it is time for the European session. In this period of time, transactions are very large and many European markets are involved. However, the European session is usually known as the London session.
Because of its specific time zone, London is not only known as the Forex trading center in Europe, but it is also known as the Forex trading center in the world. The London session overlaps with two other major trading sessions in the world, Asia and America. This means that most of the Forex transactions are done in this session. According to the latest statistics, 32% of Forex transactions are related to the London session, which shows that about a third of the activity performed in Forex takes place during this period.
This will increase the volume of Forex transactions and increase liquidity. An event that causes the spread of transactions to decrease. Of course, high liquidity also leads to greater volatility, which is desirable for many traders.
In the European session, the pound and euro currencies and the "DAX", "FTSE100", and "CAC40" indices are known as the best tradable assets. Also, traders of this session should pay attention to the news and data published by the "European Central Bank" and the "Bank of England". The news of countries like Germany, France and Italy are also very important.
🔵 American trading session (New York session)
When the New York session begins, several hours have passed since the end of the Tokyo session, but the European session is in the middle. In this session, they usually affect the financial activities carried out in America, but they also affect other countries such as Canada, Mexico and several South American countries.
The "US dollar" and stock indices such as "S&P", "Dow Jones" and "Nasdaq" are the most important assets that are traded in this session.
The early hours of the American session have a lot of liquidity and volatility due to the overlap with the European session, but with the end of the European session, the activity in the American session also decreases.
You can trade all major Forex currency pairs in the New York trading session. In this session, the "Federal Reserve", as the most important central bank in the world, is the institution that you should pay attention to its news and data.
The trading session indicator is an analytical tool in the financial markets that is used to display and analyze specific trading periods during a day. These indicators are generally useful for determining support and resistance levels during any trading session and for detecting different trading patterns.
For example, usually these indicators display the open and close price levels, the highest and lowest prices during a trading session. Also, you may notice various price patterns such as price channels, price phase phases and market trend changes during different trading sessions using these indicators.
🔵 cause of construction
In particular, the session light indicator version is designed and built for those traders who use many different tools on their chart at the same time. These traders can include "Volume Traders", "ICT traders", "Day Traders" and... These individuals can use "Session Lite" without disturbing the display of their other trading tools such as "Order Blocks", "Liquidity", "Zigzag", "FVG" etc.
But in general, there are several reasons for making tools like trading session indicators in financial markets, some of which include the following :
1. Analysis of specific time frames : Some traders and investors like to consider specific time frames for price analysis and review. For example, analyzing price changes during each trading session can help analyze trading patterns and identify trading opportunities.
2. Recognize different price patterns : Different price patterns may be observed during trading sessions. Trading session indicators can help to make better trading decisions by analyzing these patterns and their strengths and weaknesses.
3. Identifying Support and Resistance Levels : These tools may help to identify support and resistance levels during any trading session which can be helpful in deciding whether to enter or exit the market.
🔵 How to use
The Session Lite indicator displays 8 sessions by default. Asia session, Sydney session, Tokyo session, Shanghai session, Europe session, London session, New York session and New York Stock Exchange (NYSE) session are the sessions that are displayed.
You can activate or deactivate the display of each session by using the tick button next to the name of each session.
Two gray vertical dashes are also displayed by default, which indicate the beginning of the European session and the New York session. This feature is available for all sessions, but it is enabled by default only for these two sessions, and you can activate it for the rest of the session. You can enable or disable the display of this line by using the Start Session tick key.
Likewise, the information table is displayed by default, which includes the open or closed information of each session and the start and end times of each session. These timings are based on the UTC time zone.
Accordingly, the schedule of trading sessions is as follows :
Asia session from 23:00 to 06:00
Sydney session from 23:00 to 05:00
Tokyo session from 00:00 to 00:06
Shanghai session from 01:30 to 06:57
European session from 07:00 to 16:30
London session from 08:00 to 16:30
New York session from 13:00 to 22:00
New York Stock Exchange (NYSE) session from 14:30 to T 22:00
Important note : the beginning of the European session coincides with the opening of the Frankfurt market.
🔵 Settings
• In the settings section, there are customization capabilities according to the type of use of each user. The settings related to showing or not showing the box of each session, the start indicator of each session, setting the start and end time of the session and choosing the desired color to display each session are among the things that can be set from this section.
• At the end of the settings, you will see the "Info Table" option; By disabling this option, the "sessions" clock table displayed on the upper right side will be disabled.

Gtrades Forex RSI & Volume SignalThe "Forex RSI & Volume Signal" indicator combines Relative Strength Index (RSI) and volume analysis to identify potential buy signals in forex trading. It calculates RSI to gauge overbought or oversold conditions, while comparing current volume to a moving average to determine bullish volume momentum. When RSI indicates oversold conditions and volume suggests bullish momentum, a buy signal is generated. This indicator aims to identify favorable entry points during short-term uptrends in the forex market, leveraging both momentum and volume analysis to inform trading decisions. It provides traders with a comprehensive tool to identify potential buying opportunities based on multiple technical factors.

Sessions [TradingFinder] New York, London, Tokyo & Sydney ForexTiming is one of the influential factors in a trader's position. This indicator categorizes transactions into three sessions (Asia, Europe, and America). Five significant trading cities (New York, London, Frankfurt, Tokyo, and Sydney) are selectable.
I recommend using the tool on a 5-minute time frame, but it is usable on all time frames.
Settings:
• Trading sessions: Display or hide each trading session as needed.
• Color: Change the color of each box.
• Session time intervals: The default is based on the main working hours for each time interval and can be adjusted.
• Information table: Delete or display additional information table.
Information Table:
• Trading sessions
• Opening and closing times of each trading session
How to Use:
Initiating trading sessions involves entering with increased liquidity, and the market usually experiences significant movements. Many trading strategies are based on "time" and "session openings." This tool empowers traders to focus intensely on each time interval.
These trading sessions are crucial for all Forex, stock, and index traders:
The total price ceiling and floor in the Asia session (Tokyo and Sydney) are crucial for traders in the European session.
The European session starts with Frankfurt, and an hour later, London begins, collectively forming the European session.
The dashboard provides additional information, displaying hours based on UTC.
Customization options are considered in all sections so that everyone can apply their own settings.
Important: Default times are the most accurate for each region, and in most indicators, this time is not correctly selected. Therefore, the level of influence and time intervals are specified at the beginning of each session. If you are using another indicator, match its default time to the announced time and share the results with me in the comments.

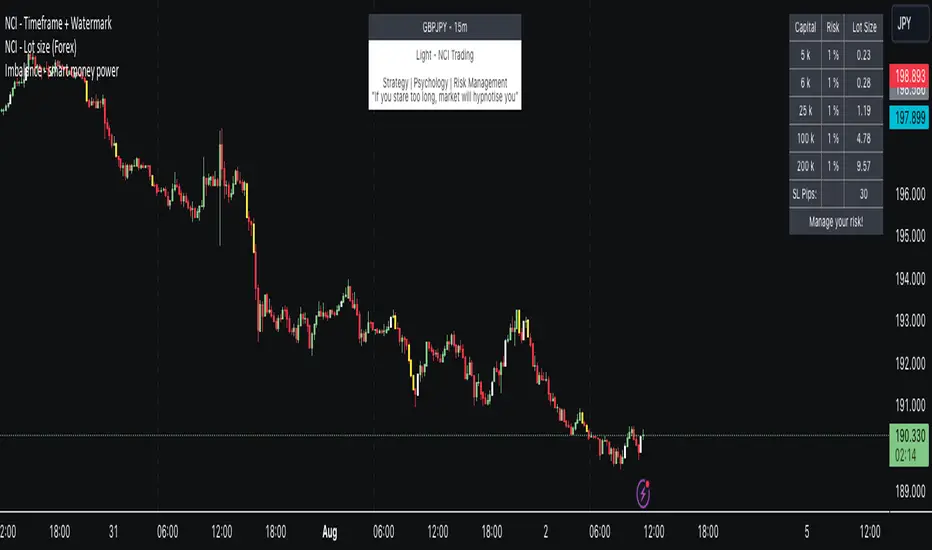
NCI - Lot size (Forex)Description:
The "NCI - Lot Size (Forex)" is a comprehensive tool designed for Forex traders to optimise their risk management strategies. This indicator dynamically calculates and displays the ideal lot size for your trades based on real-time currency conversion rates and your predefined risk parameters.
Key Features:
1. Real-Time Data Integration: Leverages current Forex market data from OANDA for major currency pairs, including USDJPY, USDCHF, AUDUSD, GBPUSD, NZDUSD, USDCAD, and EURUSD, ensuring accurate lot size calculations.
2. Customizable Account Balances: Set up to five different account balances to simulate various trading scenarios.
3. Adjustable Risk Management: Define your risk tolerance with a customizable risk percentage, allowing you to align the lot size calculations with your individual trading strategy.
4. Stoploss Adjustment: Input your desired stop loss in pips, which directly influences the calculated lot size, ensuring that your trades stay within your risk parameters.
5. Currency-Specific Adjustments: The script automatically adjusts the lot size based on the currency pair being traded, accounting for differences in currency values and volatility.
6. Intuitive Display: A clear and concise table is displayed on your chart, presenting the calculated lot sizes for each account balance and risk setting, alongside your specified stop loss.
7. User-Friendly Interface: Easy-to-use inputs make setting up the indicator a breeze, allowing both novice and experienced traders to make the most of this tool.
How to Use:
- Set your account balances (up to five different accounts).
- Define your risk percentage.
- Input your stop loss in pips.
- The table will dynamically show the ideal lot size for each account based on the current Forex market data and your settings.
---
Please Note: Trading in Forex involves significant risk and may not be suitable for all investors. The use of this indicator does not guarantee profits and should be used as part of a comprehensive trading strategy.
RiverFlow ADX ScreenerRiverFlow ADX Screener, Scans ADX and Donchian Trend values across various Timeframes. This screener provides support to the Riverflow indicator. Riverflow concept is based on Two indicators. Donchian Channel and ADX or DMI.
How to implement?
1.Donchian Channel with period 20
2. ADX / DMI 14,14 threshold 20
Entry / Exit:
1. Buy/Sell Signal from ADX Crossovers.
2. Trend Confirmation Donchian Channel.
3. Major Trend EMA 200
Buy/Sell:
After a buy/sell is generated by ADX Crossover, Check for Donchian Trend. it has to be in same direction as trend. for FTT trades take 2x limit. for Forex and Stocks take 1:1.5, SL must be placed below recent swing. One can use Riverflow indicator for better results.
ADX Indicator is plotted with
Plus: Green line
Minus: Red Line
ADX strength: plotted as Background area.
TREND: Trend is represented by Green and Red Area around Threshold line
Table:
red indicates down trend
green indicates up trend
grey indicates sideways
Weak ADX levels are treated sideways and a channel is plotted on ADX and PLUS and MINUS lines . NO TRADES are to be TAKEN on within the SIDEWAYS region.
Settings are not required as it purely works on Default settings. However Donchian Length can be changed from settings.
Timeframes below 1Day are screened. Riverflow strategy works on timeframe 5M and above timeframe. so option is not provided for lower timeframes.
Best suits for INTRADAY and LONG TERM Trading

Days in rangeThis script is a little widget that I made to do some homework on the VIX.
As you can see in the chart I was analyzing the 2008 market crash and the stats that followed it after until the market started to recover.
You can see that theory in my "Ideas" tab.
This is an interactive set of lines that you can use to count the the bars inside and outside of your chosen range, and the percentage outside that range.
You should initially enter the price range of your product in the menu and set some arbitrary dates that you can easily see on your chart.
Drag and drop the lines around to suit what price and the dates you are analyzing.
The table will display the bar count inside and outside of the range, the total bars, and the percentage outside that range.
I personally used this as a tool to study the overall average of the product, compared with the behavior during major market events.
It is currently my opinion that post 2020 analysis needs to take into account the behavior of any given product prior to 2020 when the
VIX was in its comfort zone. Not to say that a price valuation hasn't been set, but that the movement to that price was outside of "Normal Market Conditions,"
and the time factor to return to that value might be skewed. Other factors would need to be considered at that point pertaining to your specific product or corelating indicator.
I could see this tool being useful to Forex and commodities traders. But that isn't my field so that that for what it is. I do think it would perform best on something that is more
pegged to a price range. I personally would use it on product's, like the VIX, that I use as an indicator product. That is what it was designed for.
But I suppose it could be used for Mean price and time related analysis, maybe with a Vwap, SMA or other breakout style indicators.
Volume analysis might be pretty sporty. Possibly time patterns... the possibilities could be endless. Or... limited.
I am publishing this for my trade group so that it can be tinkered with to find other helpful ways to use it.
If anyone finds something interesting with other indicators, please drop a comment below and I could consider creating a script to integrate with this tool.

interest rate gap for forexThis indicator is useful for forex traders.
This script displays interest rate differentials and customizable durations for about 180 currencies.
In general, when interest rate differentials widen, traders tend to buy currencies with higher interest rates.

Expansion Finder by nnamWhat this Indicator Does
This indicator helps the trader locate expansion and contraction areas in an easy visual way.
When the asset moves from a contraction phase into an expansion phase, the bars change color (customizable). This allows the trader to recognize areas of contraction and avoid trading them. Once a Bar Range moves outside of the average range as specified by the user, the bar will change color informing the trader that the current bar and by default the market, is moving into an expansion phase from a contraction phase.
The indicator works well for those traders that use the Forex Master Pattern to locate Value Lines and Value Areas on the chart giving them an opportunity to draw in these areas with ease.
As shown in the screenshot below, the boxes are manually drawn after the trader locates an easily identifiable area of contraction.
The Indicator makes it easy to find longer areas of contraction and ignore the noise of smaller contractions.
Customizable Settings allow the trader to define the lookback range that determines the number of bars to base the average.
A "multiplier" setting allows the trader to easily adjust the Average by changing the average using a simple calculation.
Example, if the average multiplier is set to "1", the average will be used.
Using the standard average is not always the best way to define these contractions, so traders can set the average to a higher or lower number by using the multiplier, thus changing the calculation but maintaining a consistent number across the chart.
Example: If the average is not plotting the contraction correctly, the trader can manually adjust the multiplier down to 0.5 thus adjusting the average in half or increase the multiplier to 2 thus doubling the average.
As seen in the screenshot below, this changes the number of expansion bars visible on the chart.
Below you can see Value Areas and Value Lines drawn in. These lines assist the trader in defining important levels for future trading.
I hope this Indicator helps you locate value areas and value lines on charts in an easy way.
Any questions or concerns or suggestions, please do not hesitate to reach out.
Happy Trading !!!!
GRIDBOT Scalper by nnamWhat is this Indicator used for?
Made specifically for GRID Bots
note: before continuing... this indicator works on any timeframe, but it WORKS BEST ON THE 15 MINUTE TIMEFRAME
Straters and Forex Master Pattern Value Line Traders use this to help determine when the price could reverse.
This indicator is a scalping indicator that produces signals when a "potential" reversal in price is indicated. When the price moves UP and a Potential Bearish Reversal Signal occurs, traders can use this signal as a potential SHORT entry signal for their Short Grid Bot. The process is the same in reverse. After a sustained move down, a Potential Bullish Signal can be used by the trader as a potential LONG entry signal for their GridBot.
As shown in the screenshot below, lines develop on the chart (either RED or GREEN) indicating that a sustained move in one direction is currently occurring; however, there is no potential reversal signal plotted (this means that price action is currently moving in one direction only).
As shown in the screenshot below, lines can be used as a stop-loss after entering the GRIDbot. (usually, by this time, the Grid Bot is in Profit as it usually moves in the opposite direction first)
What this Indicator Does
The GRIDBOT Scalper provides information regarding potential reversals in the market after a sustained movement in one direction (either Bullish or Bearish).
The indicator is based on PRICE-ACTION ONLY and does not take into account the current state of the market (Bullish or Bearish).
Once the price moves in a particular direction for at least 14 bars , a line appears as shown in a previous screenshot. Once the price stops moving in that direction and begins moving in the opposite direction - and after a sustained run - a "signal" appears alerting the trader that a "potential" reversal could be on the horizon soon.
If price moves in one direction and plots both a line and a signal and then begins moving back in the other direction in a sustained manner, the original signal will remain even when a NEW line begins forming (the original line will disappear). (see below) This line will continue to move as the price continues to move. Not until a signal plots on the chart is the potential reversal forming. THE LINE DOES NOT SIGNAL A REVERSAL . Some traders, however, use this information to "ride the wave UP or DOWN" and exit their positions once the signal prints.
As shown below, optional input settings allow the trader to set the line at CLOSE or HIGH/LOW of the candle preceding the potential reversal.
It is suggested to use Close instead of High or Low but the setting allows one to use either.
As shown in the screenshot below, it is typical on LOWER TIME FRAMES to see the price pass the signal line. The Indicator works best on the 15 minute timeframe, as it gives the trader time to make the decisions required as the volatility is less on the 15 minute chart vs the 1 minute or 5 minute charts.
If you have any questions or suggestions for this indicator, please join our Discord. We offer free training on this Indicator on our Discord Server.

dmn's ICT ToolkitThis is my quality of life indicator for forex trading using the methods and concepts of ICT.
The idea is to automate marking up important price levels and times of the day instead of doing it manually every day.
Killzones
Marks the most volatile times of the day on the chart, during which the intraday high/low usually takes place.
Particularly impactful when there's news released during these times.
London Open (02:00-05:00 EST)
New York Open (08:30-11:00 EST)
London Close (10:00-11:30 EST)
True Day delineation
Vertical line at the start of the "true day" (00:00 EST), start of the algorithmic trading day and aids in visualizing the intraday direction.
New York midnight price level
Noteworthy price level at the start of the "true day".
This price level is referenced by the interbank trading algorithms during the day. Buy below it on bullish days, sell above it on bearish days.
Daily open price level
Reference level for optimal trade entries. Buy below it on bullish days, sell above it on bearish days.
Central Banks Dealers Range (CBDR) (14:00-20:00 EST) &
Central Banks Dealers Flout (CBDF) (15:00-24:00 EST) &
Asian Range (AR) (20:00-24:00 EST)
The standard deviation lines available are used to make predictions for short-term future highs/lows when the CBDR and AR are smaller than 40 pips.
Trade them by looking for 5/15min key levels that converge with the projection levels.
X days Average Daily Range (ADR)
Default to 5 days back, gives an idea of how much movement to expect intraday when the ADR high/low is converging with CBDR/CBDF/AR standard deviations.
Current Daily Range (CDR)
Used for comparison against the ADR to help determine if there's enough intraday range left to enter a trade.
Dynamically changes color based on percentage of the ADR. Green below 50% of ADR, orange between 50 and 100%, red when CDR exceeds ADR.
All of the above are used in conjunction with each other and higher timeframe levels of importance to find entries and target.
Note: Preferably use New York's time zone for your charts.

Day Trading Booster by DGTTiming when day trading can be everything
In Stock markets typically more volatility (or price activity) occurs at market opening and closings
When it comes to Forex (foreign exchange market), the world’s most traded market, unlike other financial markets, there is no centralized marketplace, currencies trade over the counter in whatever market is open at that time, where time becomes of more importance and key to get better trading opportunities. There are four major forex trading sessions, which are Sydney , Tokyo , London and New York sessions
Forex market is traded 24 hours a day, 5 days a week across by banks, institutions and individual traders worldwide, but that doesn’t mean it’s always active the entire day. It may be very difficult time trying to make money when the market doesn’t move at all. The busiest times with highest trading volume occurs during the overlap of the London and New York trading sessions, because U.S. dollar (USD) and the Euro (EUR) are the two most popular currencies traded. Typically most of the trading activity for a specific currency pair will occur when the trading sessions of the individual currencies overlap. For example, Australian Dollar (AUD) and Japanese Yen (JPY) will experience a higher trading volume when both Sydney and Tokyo sessions are open
There is one influence that impacts Forex matkets and should not be forgotten : the release of the significant news and reports. When a major announcement is made regarding economic data, currency can lose or gain value within a matter of seconds
Cryptocurrency markets on the other hand remain open 24/7, even during public holidays
Until 2021, the Asian impact was so significant in Cryptocurrency markets but recent reasearch reports shows that those patterns have changed and the correlation with the U.S. trading hours is becoming a clear evolving trend.
Unlike any other market Crypto doesn’t rest on weekends, there’s a drop-off in participation and yet algorithmic trading bots and market makers (or liquidity providers) can create a high volume of activity. Never trust the weekend’ is a good thing to remind yourself
One more factor that needs to be taken into accout is Blockchain transaction fees, which are responsive to network congestion and can change dramatically from one hour to the next
In general, Cryptocurrency markets are highly volatile, which means that the price of a coin can change dramatically over a short time period in either direction
The Bottom Line
The more traders trading, the higher the trading volume, and the more active the market. The more active the market, the higher the liquidity (availability of counterparties at any given time to exit or enter a trade), hence the tighter the spreads (the difference between ask and bid price) and the less slippage (the difference between the expected fill price and the actual fill price) - in a nutshell, yield to many good trading opportunities and better order execution (a process of filling the requested buy or sell order)
The best time to trade is when the market is the most active and therefore has the largest trading volume, trading all day long will not only deplete a trader's reserves quickly, but it can burn out even the most persistent trader. Knowing when the markets are more active will give traders peace of mind, that opportunities are not slipping away when they take their eyes off the markets or need to get a few hours of sleep
What does the Day Trading Booster do?
Day Trading Booster is designed ;
- to assist in determining market peak times, the times where better trading opportunities may arise
- to assist in determining the probable trading opportunities
- to help traders create their own strategies. An example strategy of when to trade or not is presented below
For Forex markets specifically includes
- Opening channel of Asian session, Europien session or both
- Opening price, opening range (5m or 15m) and day (session) range of the major trading center sessions, including Frankfurt
- A tabular view of the major forex markets oppening/closing hours, with a countdown timer
- A graphical presentation of typically traded volume and various forext markets oppening/clossing events (not only the major markets but many other around the world)
For All type of markets Day Trading Booster plots
- Day (Session) Open, 5m, 15m or 1h Opening Range
- Day (Session) Referance Levels, based on Average True Range (ATR) or Previous Day (Session) Range (PH - PL)
- Week and Month Open
Day Trading Booster also includes some of the day trader's preffered indicaotrs, such as ;
- VWAP - A custom interpretaion of VWAP is presented here with Auto, Interactive and Manual anchoring options.
- Pivot High/Low detection - Another custom interpretation of Pivot Points High Low indicator.
- A Moving Average with option to choose among SMA, EMA, WMA and HMA
An example strategy - Channel Bearkout Strategy
When day trading a trader usually monitors/analyzes lower timeframe charts and from time to time may loose insight of what really happens on the market from higher time porspective. Do not to forget to look at the larger time frame (than the one chosen to trade with) which gives the bigger picture of market price movements and thus helps to clearly define the trend
Disclaimer : Trading success is all about following your trading strategy and the indicators should fit within your trading strategy, and not to be traded upon solely
The script is for informational and educational purposes only. Use of the script does not constitutes professional and/or financial advice. You alone the sole responsibility of evaluating the script output and risks associated with the use of the script. In exchange for using the script, you agree not to hold dgtrd TradingView user liable for any possible claim for damages arising from any decision you make based on use of the script
