Momentum Explosion 2CCI RSI"Momentum Explosion Template for Mobile Metatrader", that is a trading system trend momentum based on two Commodity Channel Index (CCI) , RSI and two Moving Averages.The trading signals are generated by the crossing of the moving averages confirmed by the agreement of the two CCIs and the RSI.
Two Moving averages Filtered by double CCI and RSI
Credit is to Dimitri Author Beejay (Forex Factory)
Trading Rules Momentum Explosion
Buy
EMA 8 crosses upward SMA 26.
CCI 34 periods > 0
CCI 55 periods > 0
RSI 26 > 48.
Sell
EMA 8 crosses downward SMA 26.
CCI 34 periods < 0
CCI 55 periods < 0
RSI 26 < 48.
"forex"に関するスクリプトを検索

Joseph Nemeth Heiken Ashi Renko MTF StrategyFor Educational Purposes. Results can differ on different markets and can fail at any time. Profit is not guaranteed. This only works in a few markets and in certain situations. Changing the settings can give better or worse results for other markets.
Nemeth is a forex trader that came up with a multi-time frame heiken ashi based strategy that he showed to an older audience crowd on a speaking event video. He seems to boast about his strategy having high success results and makes an astonishing claim that looking at heiken ashi bars instead of regular candlestick bar charts can show the direction of the trend better and simpler than many other slower non-price based indicators. He says pretty much every indicator is about the same and the most important indicator is price itself. He is pessimistic about the markets and seems to think it is rigged and there is a sort of cabal that created rules to favor themselves, such as the inability of traders to hedge in one broker account, and that to win you have to take advantage of the statistics involved in the game. He believes fundamentals, chart patterns such as cup and handle and head and shoulders, and fibonacci numbers don't matter, only price matters. The foundation of his trading strategy is based around heiken ashi bars because they show a statistical pattern that can supposedly be taken advantage of by them repeating around seventy or so percent of the time, and then combines this idea with others based on the lower time frames involved.
The first step he uses is to identify the trend direction in the higher time frame(daily or 4 hourly) using the color of the heiken ashi bar itself. If it is green then take only long position after the bar completes, if it is red then take only short position. Next, on a lower time frame(1 hour or 30 minutes) look for the slope of the 20 exponential moving average to be sloping upward if going long or the slope of the ema to be sloping downward if going short(the price being above the moving average can work too if it's too hard to visualize the slope). Then look for the last heiken ashi bar, similarly to the first step, if it is green take long position, if it is red take short position. Finally the entry indicator itself will decide the entry on the lowest time frame. Nemeth recommends using MACD or CCI or possibly combine the two indicators on a 5 min or 15 min or so time frame if one does not have access to renko or range bars. If renko bars are available, then he recommends a 5 or 10 tick bar for the size(although I'm not sure if it's really possible to remove the time frame from renko bars or if 5 or 10 ticks is universal enough for everything). The idea is that renko bars paint a bar when there is price movement and it's important to have movement in the market, plus it's a simple indicator to use visually. The exit strategy is when the renko or the lowest time frame indicator used gives off an exit signal or if the above conditions of the higher time frames are not being met(he was a bit vague on this). Enter trades with only one-fifth of your capital because the other fifths will be used in case the trades go against you by applying a hedging technique he calls "zero zone recovery". He is somewhat vague about the full workings(perhaps because he uses his own software to automate his strategy) but the idea is that the second fifth will be used to hedge a trade that isn't going well after following the above, and the other fifths will be used to enter on another entry condition or if the other hedges fail also. Supposedly this helps the trader always come out with a profit in a sort of bushido-like trading tactic of never accepting defeat. Some critics argue that this is simply a ploy by software automation to boost their trade wins or to sell their product. The other argument against this strategy is that trading while the heiken ashi bar has not completed yet can jack up the backtest results, but when it comes to trading in real time, the strategy can end up repainting, so who knows if Nemeth isn't involving repainting or not, however he does mention the trades are upon completion of the bar(it came from an audience member's question). Lastly, the 3 time frames in ascending or descending fashion seem to be spaced out by about factors of 4 if you want to trade other time frames other than 5/15min,30min/1hour, or 4hour/daily(he mentioned the higher time frame should be atleast a dozen times higher than the lower time frame).
Personally I have not had luck getting the seventy+ percent accuracy that he talks about, whether in forex or other things. I made the default on renko bars to an ATR size 1 setting because it looks like the most universal option if the traditional mode box size is too hard to guess, and I made it so that you can switch between ATR and Traditional mode just in case. I don't think the strategy repaints because I think TV set a default on the multi-time frame aspects of their code to not re-paint, but I could be wrong so you might want to watch out for that. The zero zone recovery technique is included in the code but I commented it out and/or remove it because TV does not let you apply hedging properly, as far as I know. If you do use a proper hedging strategy with this, you'll find a very interesting bushido type of trading style involved with the Japanese bars that can boost profits and win rates of around possibly atleast seventy percent on every trade but unfortunately I was not able to test this part out properly because of the limitation on hedging here, and who knows if the hedging part isn't just a plot to sell his product. If his strategy does involve the repainting feature of the heiken ashi bars then it's possible he might have been preaching fools-gold but it's hard to say because he did mention it is upon completion of the bars. If you find out if this strategy works or doesn't work or find out a good setting that I somehow didn't catch, please feel free to let me know, will gladly appreciate it. We are all here to make some money!

Dynamic Dots Dashboard (a Cloud/ZLEMA Composite)The purpose of this indicator is to provide an easy-to-read binary dashboard of where the current price is relative to key dynamic supports and resistances. The concept is simple, if a dynamic s/r is currently acting as a resistance, the indicator plots a dot above the histogram in the red box. If a dynamic s/r is acting as support, a dot is plotted in the green box below.
There are some additional features, but the dot graphs are king.
_______________________________________________________________________________________________________________
KEY:
_______________________________________________________________________________________________________________
Currently the dynamic s/r's being used in the dot plots are:
Ichimoku Cloud:
Tenkan (blue)
Kijun (pink)
Senkou A (red)
Senkou B (green)
ZLEMA (Zero Lag Exponential Moving Average)
99 ZLEMA (lavender)
200 ZLEMA (salmon)
You'll see a dashed line through the middle of the resistances section (red) and supports section (green). Cloud indicators are plotted above the dashed line, and ZLEMA's are below.
_______________________________________________________________________________________________________________
How it Works - Visual
_______________________________________________________________________________________________________________
As stated in the intro - if a dynamic s/r is currently above the current price and acting as a resistance, the indicator plots a dot above the histogram in the red box. If a dynamic s/r is acting as support, a dot is plotted in the green box below. Additionally, there is an optional histogram (default is on) that will further visualize this relationship. The histogram is a simple summation of the resistances above and the supports below.
Here's a visual to assist with what that means. This chart includes all of those dynamic s/r's in the dynamic dot dashboard (the on-chart parts are individually added, not part of this tool).
You can see that as a dynamic support is lost, the corresponding dot is moved from the supports section at the bottom (green), to the resistances section at the top (red). The opposite being true as resistances are being overtaken (broken resistances are moved to the support section (red)). You can see that the raw chart is just... a mess. Which kinda of accentuates one of the key goals of this indicator: to get all that dynamic support info without a mess of a chart like that.
_______________________________________________________________________________________________________________
How To Use It
_______________________________________________________________________________________________________________
There are a lot of ways to use this information, but the most notable of which is to detect shifts in the market cycle.
For this example, take a look at the dynamic s/r dots in the resistances category (red background). You can see clearly that there are distinctive blocks of high density dots that have clear beginnings and ends. When we transition from a high density of dots to none in resistances, that means we are flipping them as support and entering a bull cycle. On the other hand, when we go from low density of dots as resistances to high density, we're pivoting to a bear cycle. Easy as that, you can quickly detect when market cycles are beginning or ending.
Alternatively, you can add your preferred linear SR's, fibs, etc. to the chart and quickly glance at the dashboard to gauge how dynamic SR's may be contributing to the risk of your trade.
_______________________________________________________________________________________________________________
Who It's For
_______________________________________________________________________________________________________________
New traders: by looking at dot density alone, you can use Dot Dynamics to spot transitionary phases in market cycles.
Experienced traders: keep your charts clean and the information easy to digest.
Developers: I created this originally as a starting point for more complex algos I'm working on. One algo is reading this dot dashboard and taking a position size relative to the s/r's above and below. Another cloud algo is using the results as inputs to spot good setups.
Colored Bars
There is an option (off by default, shown in the headline image above) to fill the bar colors based on how many dynamic s/r's are above or below the current price. This can make things easier for some users, confusing for others. I defaulted them to off as I don't want colors to confuse the primary value proposition of the indicators, which is the dot heat map. You can turn on colored bars in the settings.
One thing to note with the colored bars: they plot the color purely by the dot densities. Random spikes in the gradient colors (i.e. red to lime or green) can be a useful thing to notice, as they commonly occur at places where the price is bouncing between dynamic s/r's and can indicate a paradigm shift in the market cycle.
_______________________________________________________________________________________________________________
Timeframes and Assets
_______________________________________________________________________________________________________________
This can be used effectively on all assets (stocks, crypto, forex, etc) and all time frames. As always with any indicator, the higher TF's are generally respected more than lower TF's.
Thanks for checking it out! I've been trading crypto for years and am just now beginning to publish my ideas, secret-sauce scripts and handy tools (like this one). If you enjoyed this indicator and would like to see more, a like and a follow is greatly appreciated 😁.

London Open Range Breakout by KviateqThis script is what I currently use to day trade forex on a 5-minute timeframe.
The script features Multi-timeframe EMA20 that uses timeframe multipliers and is smoother by the factor by which you're multiplying your current timeframe.
Default settings are set to display EMA20 on the current (M5) timeframe, as well as M15, H1, H4 and D1 timeframes.
The background color changes intensity based on how many conditions are met - are all EMAs in the right order, is the current close above/below all the EMAs.
Featured is also a range set to 1 hour since the London breakout (can be changed to M15, or however long you'd like - my current setting is 30 minute).
Also featured are levels that I find to be of most importance - such as Daily and Weekly Open, Previous Day's and Week's Highs.
The idea is to only take trades when all stars align - EMAs, break above/below the Opening Range and not to long/short into an important level.

PineScript v4 - Forex Pin-Bar Trading StrategyPineScript v4, forex trading robot based on the commonly used bullish / bearish pin-bar piercing the moving averages strategy.
I coded this robot to stress-test the PineScript v4 language to see how advanced it is, and whether I could port a forex trading strategy from MT4 to TradingView.
In my opinion, PineScript v4 is still not a professional coding language; for example you cannot use IF-statements to modify the contents of global variables; this makes complex robot behaviour difficult to implement. In addition, it is unclear if the programmer can use nested IF-ELSE, or nested FOR within IF.
The sequence of program execution is also unclear, and although complex order entry and exit appears to function properly, I am not completely comfortable with it.
Recommended Chart Settings:
Asset Class: Forex
Time Frame: H1
Long Entry Conditions:
a) Moving Average up trend, fast crosses above slow
b) Presence of a Bullish Pin Bar
c) Pin Bar pierces either Moving Average
d) Moving Averages must be sloping up, angle threshold (optional)
Short Entry Conditions:
a) Moving Average down trend, fast crosses below slow
b) Presence of a Bearish Pin Bar
c) Pin Bar pierces either Moving Average
d) Moving Averages must be sloping down, angle threshold (optional)
Exit Conditions:
a) Stoploss level is hit
b) Takeprofit level is hit
c) Moving Averages cross-back (optional)
Default Robot Settings:
Equity Risk (%): 3 //how much account balance to risk per trade
Stop Loss (x*ATR, Float): 2.1 //stoploss = x * ATR, you can change x
Risk : Reward (1 : x*SL, Float): 3.1 //takeprofit = x * stop_loss_distance, you can change x
Fast MA (Period): 20 //fast moving average period
Slow MA (Period): 50 //slow moving average period
ATR (Period): 14 //average true range period
Use MA Slope (Boolean): true //toggle the requirement of the moving average slope
Bull Slope Angle (Deg): 1 //angle above which, moving average is considered to be sloping up
Bear Slope Angle (Deg): -1 //angle below which, moving average is considered to be sloping down
Exit When MA Re-Cross (Boolean): true //toggle, close trade if moving average crosses back
Cancel Entry After X Bars (Period): 3 //cancel the order after x bars not triggered, you can change x
Backtest Results (2019 to 2020, H1, Default Settings):
EURJPY - 111% profit, 2.631 profit factor, 16.43% drawdown
EURUSD - 103% profit, 2.899 profit factor, 14.95% drawdown
EURAUD - 76.75% profit, 1.8 profit factor, 17.99% drawdown
NZDUSD - 64.62% profit, 1.727 profit factor, 19.14% drawdown
GBPUSD - 58.73% profit, 1.663 profit factor, 15.44% downdown
AUDJPY - 48.71% profit, 1.635 profit factor, 11.81% drawdown
USDCHF - 30.72% profit, 1.36 profit factor, 22.63% drawdown
AUDUSD - 8.54% profit, 1.092 profit factor, 19.86% drawdown
EURGBP - 0.03% profit, 1.0 profit factor, 29.66% drawdown
USDJPY - 1.96% loss, 0.972 profit factor, 28.37% drawdown
USDCAD - 6.36% loss, 0.891 profit factor, 21.14% drawdown
GBPJPY - 28.27% loss, 0.461 profit factor, 39.13% drawdown
To reduce the possibility of curve-fitting, this robot was backtested on 12 popular forex currencies, as shown above. The robot was profitable on 8 out of 12 currencies, breakeven on 1, and made a loss on 3.
The default robot settings could be over-fitting for the EUR, as we can see out-sized performance for the EUR pairs, with the exception of the EURGBP. We can see that GBPJPY made the largest loss, so these two pairs could be related.
Risk Warning:
This is a forex trading strategy that involves high risk of equity loss, and backtest performance will not equal future results. You agree to use this script at your own risk.

Efficient Support & Resistance LevelsThis script is a mixture of my two previous scripts "True Strong Classical Support/Resistance Levels" and "Hidden Supports & Resistances + Round Levels". This combination brings on better identification of the most efficient support/resistance levels.
Note that "Hidden SnR Levels" part of the code is only expected to work on Forex charts, but apart from that, the other parts could be applied to any chart.
The script may:
- Draw classical support/resistance levels which retraced the price previously, aided by multi-timeframe analysis
- Draw hidden support/resistance levels based on psychological patterns of the price
- Adjust to wicks better than Pine Script built-in pivot functions
- Differ the levels color based on chart reactions
- Merge nearby classical levels to avoid congestion on the chart
Feel free to use it and send me your thoughts.

Low Scanner Forex strategyThis strategy is non repainting as the scanner do not use security for its entry and the Hull MTF is non repainted one.
it design for forex only
why it working as such ?
simple once we have good detection of Low using Low scanner and Low scaner strategy
which is a killer for stoks as I shown in that script
here i show winning non repainting strategy for Forex
why it working perfect?
if the Low entry is good. the market go up or down but eventualy by using step wise profit take out
as shown by adolgov
then you will win most of time .
This is example how I use my script with adolgov script to create this strategy
it not pyramiding as in pyramiding we buy and buy and buy. here the entry is fix but exit is progressive,0.5% -1% 1.5% ,2% at 25% equaty each.
the market go up or down we just take ourt profit out.
so if you use leverage in forex the win % will be crazy. but you must to apply this only to asstes where this strategy is working like EURO/USD
the dat here is from 2017 t0 2018 ,if you want the last data which show the same put in test year 2019 as start
This script is for forex lovers as teaching how to create winning non repainting strategy
if you want to invite to coffe be free to do so
let me know what you think

Real Interest Rate DifferentialThe Real IRD is a simple indicator built for forex trades that need a long-term view and want to compare currencies in search of high yield. The indicated interest rate maturity is 2 years, since shorter maturities may not price central banks' monetary policy decisions.
Example:
- You need to do an analysis of the AUDUSD
- In the Interest Rate 1 field, we put the interest rate for the base currency, in this case the AUD
- In the Interest Rate 2 field, the interest rate of the other currency, in this case the USD
- In the CPI 1 field, inflation referring to base currency
- In the CPI 2 field, inflation for another currency
CPI Codes:
QUANDL:RATEINF/INFLATION_USA < USD
QUANDL:RATEINF/INFLATION_EUR < EUR
QUANDL:RATEINF/INFLATION_JPN < JPY
QUANDL:RATEINF/INFLATION_CHE < CHF
QUANDL:RATEINF/INFLATION_GBR < GBP
QUANDL:RATEINF/INFLATION_CAN < CAD
QUANDL:RATEINF/INFLATION_RUS < RUB
QUANDL:RATEINF/INFLATION_AUS < AUD
QUANDL:RATEINF/INFLATION_NZL < NZD

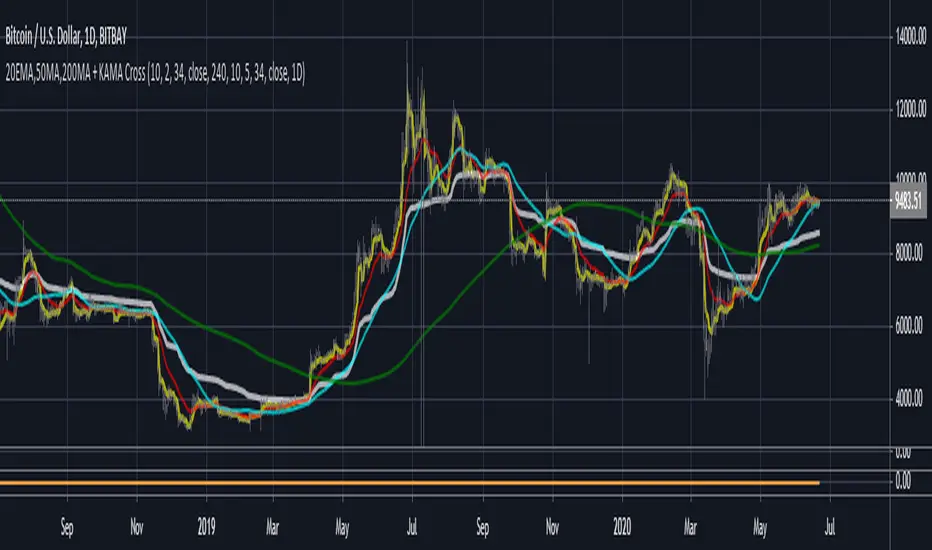
3MA'S + KAMA Trend (20EMA,50MA,200MA + KAMA Trend)This indicator, combines the traditional FOREX moving averages (20EMA, 50ma, 200ma) into a single indicator with
an adaptive moving average (AMA) taken from a user defined timeframe to show trend direction (by default, it plots
the daily 10/2/34 KAMA overlayed on any timeframe chart.
An AMA moves slowly when markets are sideways but swiftly during periods of volatility as a result it reacts much fast than
traditional options for moving average trends.
If the price is above the KAMA, trend is up. Below the KAMA, trend is down.
Naked Forex - Kangaroo Tail & Big Shadow Indicator-modifiedKind of new to here and new to code
It's a modified version of ErwinBeckers's Naked Forex - Kangaroo Tail Indicator

FRAMA - Supertrend strategyFRAMA Strategy
I found this strategy on internet, in a well-known forex forum.
I have translated the two indicators mentioned in that strategy (originally in mq4) in pine script.
Thanks to Fractured and Shizaru for the FRAMA snippets, to mejialucas for Supertrend snippet, to JayRogers for trade management snippet and to Trost for backtesting snippet.
I also added some code to have FRAME with a deiiferent timeframe
Indicators set-up:
FRAMA period 24 (it was originally 25 but it's better to use an even number)
FRAMA timefarme lower then chart timeframe (e.g. daily chart and weekly FRAMA)
Supertrend indicator as it is.
Of course, it is better to adapt above setting to traded instrument.
Long/Buy rules:
1 - Enter at crossover between FRAMA and its signal
2 - Option to filter entries based on supertrend signal
3 - Exit when Supertrend change direction;
4 - Exit long when short signal occurs;
Short/Sell rules:
1 - Enter at crossunder between FRAMA and its signal
2 - Option to filter entries based on supertrend signal
3 - Exit when Supertrend change direction;
4 - Exit short when long signal occurs;
VERY IMPORTANT NOTE: this is a trend following strategy, so the target is to stay in the trade as much as possible (drawdown my be high). If your trading style is more focused on scalping and/or pullbaks, this strategy is not for you.
Credits to who developed this startegy (google it).
Thanks to all pinescripters mentined in the code for their snippets.
I have also a study with alerts.
Please use comment section for any feedback or contact me if you need support.

Best Volatility Calculator (Multi Instruments)Hello traders
A bit of context
Definition: Volatility is defined as the close of current candle - close of the previous N candle
This is an alternative version of my Best Volatility Calculator
The other version is displayed on a panel below. This one overlays on the chart using the "overlay=true" setting
This indicator shows the average volatility, of last N Periods, for the selected time frames and for 2 selected instruments.
You can select up to 2 timeframes with this version
Presented as Currency, Pip, percentage labels in a panel below.
Will calculate in real-time only for the current instrument on the chart.
The indicator is coded to not be repainting
Example
In the indicator screenshot, I used a lookback period of 1.
That compares the current candle close versus the previous one for the daily and weekly timeframe
Showing how the results look like using FOREX instruments (where using the PIPS labels make more sense than with cryptocurrency assets)
Best regards
Dave

Syminfo.TypeHello traders
Earlier this week I discovered a new built-in variable called syminfo.type
What is it for?
This variable returns the type of the current symbol. Possible values are cfd, stock, futures, indices, forex, crypto, fund.
Cool bro but... should we care?
Well... we all should. Imagine you have a generic script and you want a different configuration whether you're trading FOREX or Crypto .
I designed a dummy example in that script that will preset the inputs according to the asset type from the chart.
Here I want 12/26/9 for forex and 20/50/50 for crypto - 30/60/90 otherwise
Quick caveat
It seems that for any crypto asset, syminfo.type returns "bitcoin". TradingView will fix it at some point but wanted to give you the heads-up regardless
Enjoy and all the BEST ^^
--
Dave

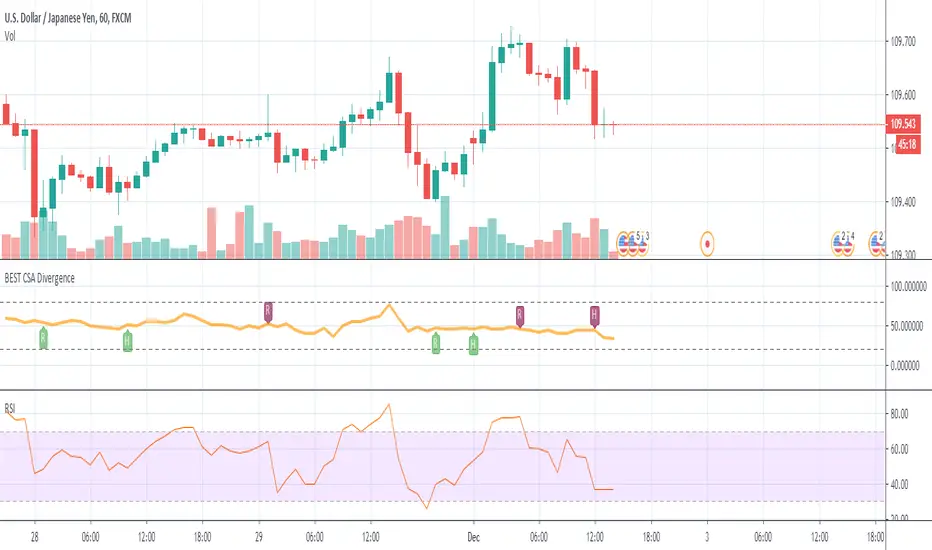
BEST Currency Strength Indicator DivergenceHello traders
Hope you had a great Thanksgiving
Now it's my turn to give and all I ask in return is you to be thankful (did I get the "Thanksgiving" thing right?)
The Currency Strength Indicator plots an average of the selected FX pairs in the indicator.
Someone asked me if I could develop an alternative of that script adding a divergence component.
The script evaluates the divergences between the average of the selected RSI(FOREX pairs) and the RSI(FOREX pair) displayed on the chart.
This version includes new features such as:
- the RSI length can now be selected
- we can select the 6 pairs used for the divergence calculations
All the BEST my aspiring traders and quants
See you tomorrow for another script
Dave
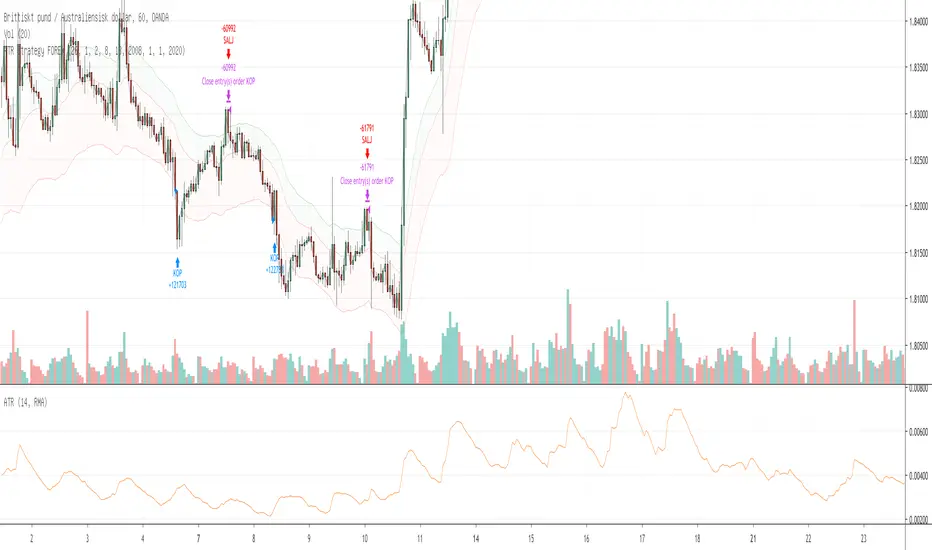
ATR Strategy for most volatile FOREX pairsA strategy suitable for volatile Forex pairs. The strategy is simple, buy low band and sell short high band. Doing so, you will always be in a trade, that is important to understand.
Tested on 1 hour charts.
Mirror MACD by Trader JayThis is my take on the metatrader indicator, the mirror macd. Works pretty good on Forex, haven't tested on anything else
Enter long after the Blue Line Cross Up the Red Line and EXIT after the Green line Cross Up the Red Line (above the Blue Line).
For the opposite position : ENTER SELL after the Red Line Cross Down.

TradingView Alerts to MT4 MT5 + dynamic variables NON-REPAINTINGAccidentally, I’m sharing open-source profitable Forex strategy. Accidentally, because this was aimed to be purely educational material. A few days ago TradingView released a very powerful feature of dynamic values from PineScript now being allowed to be passed in Alerts. And thanks to TradingConnector, they could be instantly executed in MT4 or MT5 platform of any broker in the world. So yeah - TradingConnector works with indices and commodities, too.
The logic of this EURUSD 6h strategy is very simple - it is based on Stochastic crossovers with stop-loss set under most recent pivot point. Setting stop-loss with surgical precision is possible exactly thanks to allowance of dynamic values in alerts. TradingConnector has been also upgraded to take advantage of these dynamic values and it now enables executing trades with pre-calculated stop-loss, take-profit, as well as stop and limit orders.
Another fresh feature of TradingConnector, is closing positions only partly - provided that the broker allows it, of course. A position needs to have trade_id specified at entry, referred to in further alerts with partial closing. Detailed spec of alerts syntax and functionalities can be found at TradingConnector website. How to include dynamic variables in alert messages can be seen at the very end of the script in alertcondition() calls.
The strategy also takes commission into consideration.
Slippage is intentionally left at 0. Due to shorter than 1 second delivery time of TradingConnector, slippage is practically non-existing. This can be achieved especially if you’re using VPS server, hosted in the same datacenter as your brokers’ servers. I am using such setup, it is doable. Small slippage and spread is already included in commission value.
This strategy is NON-REPAINTING and uses NO TRAILING-STOP or any other feature known to be faulty in TradingView backtester. Does it make this strategy bulletproof and 100% success-guaranteed? Hell no! Remember the no.1 rule of backtesting - no matter how profitable and good looking a script is, it only tells about the past. There is zero guarantee the same strategy will get similar results in the future.
To turn this script into study so that alerts can be produced, do 2 things:
1. comment “strategy” line at the beginning and uncomment “study” line
2. comment lines 54-59 and uncomment lines 62-65.
Then add script to the chart and configure alerts.
This script was build for educational purposes only.
Certainly this is not financial advice. Anybody using this script or any of its parts in any way, must be aware of high risks connected with trading.
Thanks @LucF and @a.tesla2018 for helping me with code fixes :)

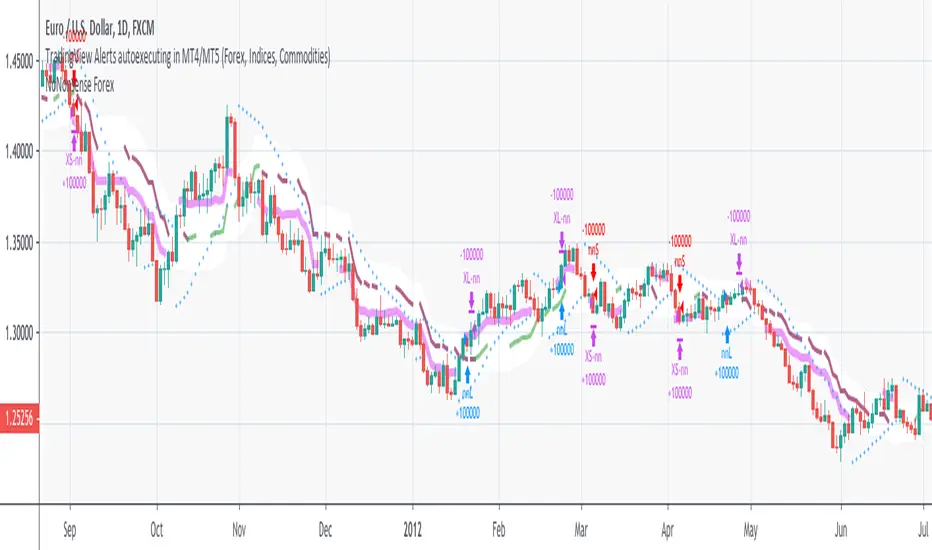
NoNonsense Forex - high timeframe trading absurd NON-REPAINTINGSome time ago I bumped into NoNonsense Forex - pretty good-looking course with well-designed videos, reasonable rules, etc. Nice explanatory videos, not selling anything, building indicators-only strategy. But there was one thing that really annoyed me - it was supposed to work only on Daily timeframe. What is the point in trading such high timeframe, if decisions changing market direction are playing out within 1 minute? What is the point in evaluating trades from 1994 if we are 25 years later?
Anyway, I have developed this strategy, which is:
- non-repainting
- not using trailing-stop
- not using any other known TradingView backtest bugs
And I'm showing it as an example of OVERFITTING. Backtesting results look absurd: 100% profitable. But if you change any of the many parameters in the Settings popup, they will turn into disaster. It means, the rules of this strategy are very fragile. Don't trade this! Remember about backtesting rule #1: past results do not guarantee success in the future.
I'm giving this strategy out with the source code. Feel free to do anything you want with it. But if you find parameters or modifications on, which allow profitable trading on lower timeframes, don't be shy, let me know :)
*********
Forex / Indices / Commodities traders who want to start AUTO-TRADING might want to take a look at "TradingConnector", which allows no-latency trades execution from TradingView to MT4/MT5.
DAY separator P4L FOREX
day separator for better orientation of neutralizations in the graph. with the possibility of choosing day and color to show in the graph

[PX] Forex ATRCompare forex volatility at a glance.
If you are looking for someone to develop your own indicator or trading strategy, don't hesitate to get in touch with me here on TradingView or below.
Contact:
www.pascal-simon.de
info@pascal-simon.de


Naked Forex - Kangaroo Tail IndicatorIndicator which identfies a kangaroo tail as defined in the book naked forex
A kangaroo tail is defined as
- a candle where the body closes in the upper or lower third
- which has room to the left
