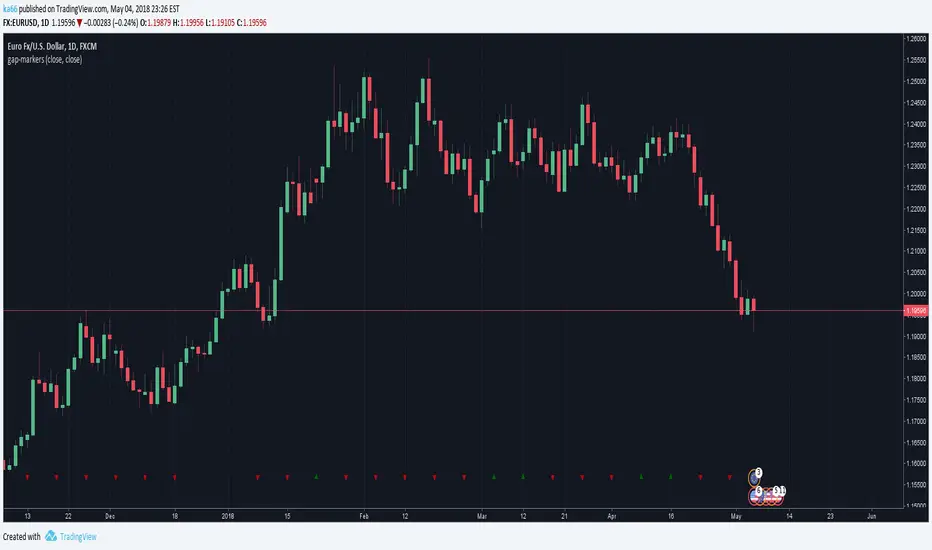
ka66: Gap MarkersMarks bars having opening gaps, in either direction. Essentially where the opening price != closing price. The reference price defaults to close, but is configurable as an arbitrary source.
Larger gaps are easy to see visually but microgaps are more interesting, and indicate stronger shifts in sentiment, where enthusiasm towards a direction is increasing. They often signify the beginnings of strong trends.
Another signal when comparing open to high/low is a climactic type buy/sell.
Gapping is quite common in stocks, but not so much in 24H markets like Forex. It is expected this indicator has a much stronger value in these markets.
This indicator places up/down marks at the bottom of a chart, the rarity of these markers is a stronger signal than a higher frequency of occurrence.
Daily charts are likely the best spot for this indicator. Weeklies will almost always have gaps.
As usual, this is just one datapoint to consider among a confluence of others to verify a hypothesis.
Microgap Idea Credit, Price Action Course
"gaps"に関するスクリプトを検索
Autocorrelation PlotA tool to plot auto correlation of time series, this is useful in identifying periodicity in a time series or signal.
Due to the limits of Pine Script you'll need to add it multiple times if you want autocorrelation beyond 55 periods. I have added it 4 times here for 220 periods.
For more information on Autocorrelation see: en.wikipedia.org
Note: There are 1 bar gaps every 55 because I wanted the labels to remain every 5, but you don't have to have gaps....

DWM HLOC, Mid & WicksSimple, yet effective.
1. Automatically calculate and projects key price levels from a previous period (Yesterday, OR Last Week / Month) onto the current trading session. It acts as an immediate Support & Resistance map based on historical price action.
2. Multi-Timeframe Logic
Modes --
Daily Mode: Projects yesterday's data onto today.
Weekly Mode: Projects last week's data onto the current week.
3. Key Levels Visualized The script calculates seven distinct price levels:
OHLC: Previous Open, High, Low, and Close.
Equilibrium (Mid): The exact 50% mark between the previous High and Low.
Wick Midpoints (New):
Upper Wick 50%: The midpoint between the High and the top of the body.
Lower Wick 50%: The midpoint between the Low and the bottom of the body.
4. Smart "Gap" Visualization The script uses unique starting points to help traders visualize market gaps:
Standard Levels (High, Low, Open, Mids): These lines originate from the Previous Period's Open, showing the full context of the level relative to time.
Close Level: This line originates from the Current Period's Open. This visually highlights the "Gap" (the jump in price between where the market closed previously and where it opened today).
5. Full Customization
Aesthetics: Every line can be individually toggled on/off.
Styling: Users can independently change the color, line style (Solid, Dotted, Dashed), and thickness for every specific level.

Debt-Cycle vs Bitcoin-CycleDebt-Cycle vs Bitcoin-Cycle Indicator
The Debt-Cycle vs Bitcoin-Cycle indicator is a macro-economic analysis tool that compares traditional financial market cycles (debt/credit cycles) against Bitcoin market cycles. It uses Z-score normalization to track the relative positioning of global financial conditions versus cryptocurrency market sentiment, helping identify potential turning points and divergences between traditional finance and digital assets.
Key Features
Dual-Cycle Analysis: Simultaneously tracks traditional financial cycles and Bitcoin-specific cycles
Z-Score Normalization: Standardizes diverse data sources for meaningful comparison
Multi-Asset Coverage: Analyzes currencies, commodities, bonds, monetary aggregates, and on-chain metrics
Divergence Detection: Identifies when Bitcoin cycles move independently from traditional finance
21-Day Timeframe: Optimized for Long-term cycle analysis
What It Measures
Finance-Cycle (White Line)
Tracks traditional financial market health through:
Currencies: USD strength (DXY), global currency weights (USDWCU, EURWCU)
Commodities: Oil, gold, natural gas, agricultural products, and Bitcoin price
Corporate Bonds: Investment-grade spreads, high-yield spreads, credit conditions
Monetary Aggregates: M2 money supply, foreign exchange reserves (weighted by currency)
Treasury Bonds: Yield curve (2Y/10Y, 3M/10Y), term premiums, long-term rates
Bitcoin-Cycle (Orange Line)
Tracks Bitcoin market positioning through:
On-Chain Metrics:
MVRV Ratio (Market Value to Realized Value)
NUPL (Net Unrealized Profit/Loss)
Profit/Loss Address Distribution
Technical Indicators:
Bitcoin price Z-score
Moving average deviation
Relative Strength:
ETH/BTC ratio (altcoin strength indicator)
Visual Elements
White Line: Finance-Cycle indicator (positive = expansionary conditions, negative = contractionary)
Orange Line: Bitcoin-Cycle indicator (positive = bullish positioning, negative = bearish)
Zero Line: Neutral reference point
Interpretation
Cycle Alignment
Both positive: Risk-on environment, favorable for crypto
Both negative: Risk-off environment, caution warranted
Divergence: Potential opportunities or warning signals
Divergence Signals
Finance positive, Bitcoin negative: Bitcoin may be undervalued relative to macro conditions
Finance negative, Bitcoin positive: Bitcoin may be overextended or decoupling from traditional finance
Important Limitations
This indicator uses some technical and macro data but still has significant gaps:
⚠️ Limited monetary data - missing:
Funding rates (repo, overnight markets)
Comprehensive bond spread analysis
Collateral velocity and quality metrics
Central bank balance sheet details
⚠️ Basic economic coverage - missing:
GDP growth rates
Inflation expectations
Employment data
Manufacturing indices
Consumer confidence
⚠️ Simplified on-chain analysis - missing:
Exchange flow data
Whale wallet movements
Mining difficulty adjustments
Hash rate trends
Network fee dynamics
⚠️ No sentiment data - missing:
Fear & Greed Index
Options positioning
Futures open interest
Social media sentiment
The indicator provides a high-level cycle comparison but should be combined with comprehensive fundamental analysis, detailed on-chain research, and proper risk management.
Settings
Offset: Adjust the horizontal positioning of the indicators (default: 0)
Timeframe: Fixed at 21 days for optimal cycle detection
Use Cases
Macro-crypto correlation analysis: Understand when Bitcoin moves with or against traditional markets
Cycle timing: Identify potential tops and bottoms in both cycles
Risk assessment: Gauge overall market conditions across asset classes
Divergence trading: Spot opportunities when cycles diverge significantly
Portfolio allocation: Balance traditional and crypto assets based on cycle positioning
Technical Notes
Uses Z-score normalization with varying lookback periods (40-60 bars)
Applies HMA (Hull Moving Average) smoothing to reduce noise
Asymmetric multipliers for upside/downside movements in certain metrics
Requires access to FRED economic data, Glassnode, CoinMetrics, and IntoTheBlock feeds
21-day timeframe optimized for cycle analysis
Strategy Applications
This indicator is particularly useful for:
Cross-asset allocation - Decide between traditional finance and crypto exposure
Cycle positioning - Identify where we are in credit/debt cycles vs. Bitcoin cycles
Regime changes - Detect shifts in market leadership and correlation patterns
Risk management - Reduce exposure when both cycles turn negative
Disclaimer: This indicator is a cycle analysis tool and should not be used as the sole basis for investment decisions. It has limited coverage of monetary conditions, economic fundamentals, and on-chain metrics. The indicator provides directional insight but cannot predict exact timing or magnitude of market moves. Always conduct thorough research, consider multiple data sources, and maintain proper risk management in all investment decisions.

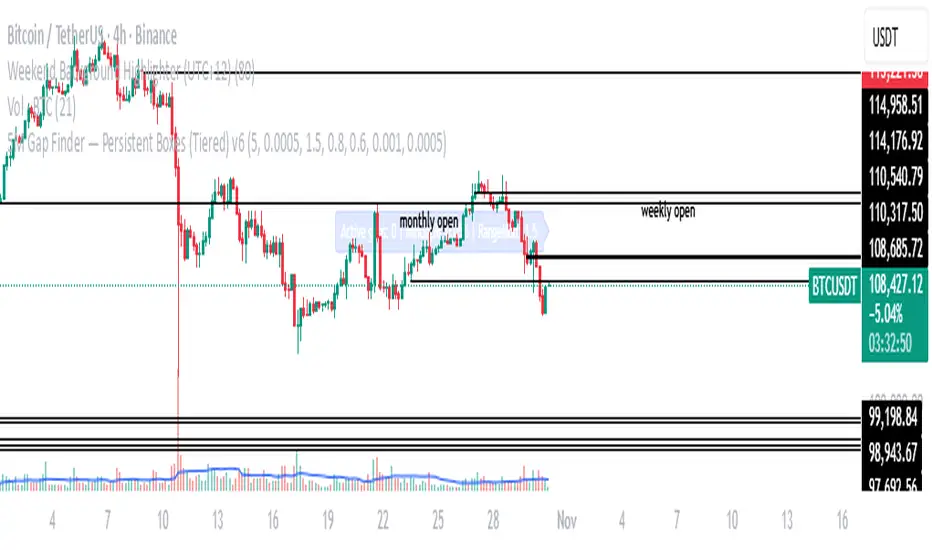
5M Gap Finder — Persistent Boxes (Tiered) v65 M gap finder, using 3 different types of gaps: Tier Definition Tightness Frequency Use Case
Tier A (Strict) Gap ≥ 0.10%, body ≥ 70% of range Rare Institutional-strength displacement
Tier B (Standard) Gap ≥ 0.05%, body ≥ 60% of range Medium Baseline trading setup
Tier C (Loose) Gap ≥ 0.03%, no body condition Common Data collection and observation
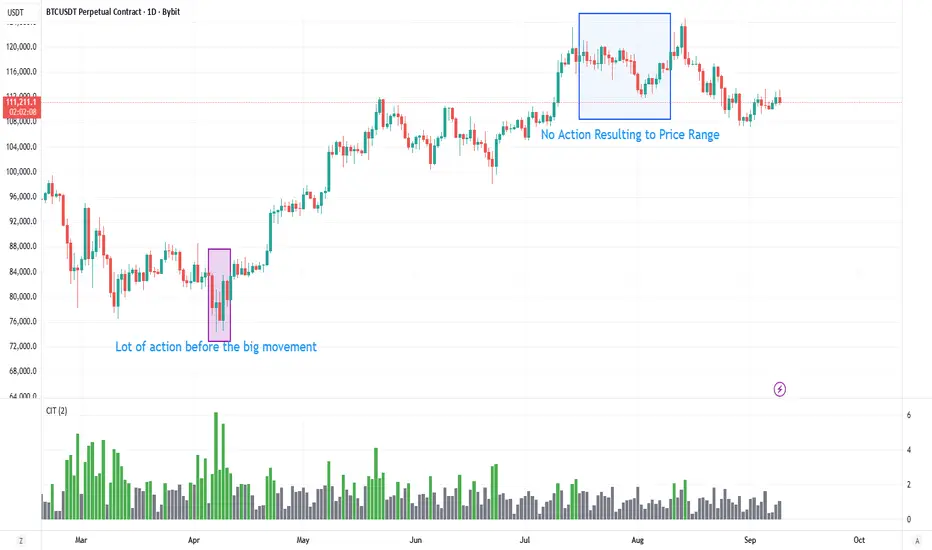
Contract Interest Turnover T3 [T69]Overview
--------
Contract Interest Turnover (CIT) estimates how “churny” a crypto derivatives market is by comparing the amount traded in a bar to the base stock of outstanding contracts (open interest). It normalizes both Volume and Open Interest (OI) by Price (Close), then plots a Turnover Rate = (Volume/Close) ÷ (OI/Close) as colored columns. Higher values = faster contract recycling (strong momentum / hype potential).
Features
--------
- Auto-fetch OI: Pulls OI via request.security(_OI, …) when the exchange/symbol exposes an OI stream on TradingView.
- Price-normalized comparison: Converts both Volume and OI into comparable notional terms by dividing each by Close.
- Turnover columns with threshold: Color the columns green once Turnover ≥ your set threshold; gray otherwise.
- Status-line readouts: Displays normalized Volume and OI values for quick sanity checks.
- Crypto-aware timeframe: Uses chart TF for crypto; forces daily OI when not crypto to avoid noisy intraday pulls.
How to Use
----------
1. Add the script on a perpetual/futures symbol that has OI on TradingView (e.g., BTC perps where an _OI feed exists).
2. Watch the Turnover Rate bars: spikes above your threshold flag sessions where contracts are actively flipping.
3. Interpret spikes as a signal of movement or activity — it does not specify price direction, only that the market is engaged and contracts are being traded more intensely than usual.
Configuration
-------------
- Interest Turnover Threshold (default 1.0): colors columns green when Turnover ≥ threshold. Tune per market’s typical churn profile.
Under the Hood (Formulas & Logic)
---------------------------------
- Fetch OI
oiClose ← request.security(ticker.standard(syminfo.tickerid) + "_OI", timeframe, close) with ignore_invalid_symbol = true.
If none is found, the script throws a clear runtime error.
- Normalize to price
vol_norm = volume / close
oi_norm = oiClose / close
This converts both to a common notional basis so their ratio is meaningful even as price changes.
- Turnover Rate
turnover = vol_norm / oi_norm
Interpretation: fraction/multiples of the outstanding contract base traded in the bar. Color = green if turnover ≥ threshold.
Why Open Interest ≈ “Float” Proxy
---------------------------------
In stocks, float ≈ shares the public can trade. In derivatives, there are no “shares,” so Open Interest acts as the live stock of active contracts. It’s the best proxy for “what’s available in play” because it counts open positions that persist across bars. Using Volume ÷ OI mirrors stock float-turnover logic: how fast the tradable base is being recycled each period.
Why Normalize by Price
----------------------
Derivatives volume and OI may be reported in contracts, not notional value. One contract’s economic weight changes with price (especially on inverse contracts). Dividing both Volume and OI by Close:
- Puts them on a comparable notional footing.
- Prevents false spikes purely from price moves.
- Makes Turnover comparable across time even as price trends.
Advanced Tips
-------------
- Calibrate threshold: Start from the 80th–90th percentile of the last 60–90 bars of Turnover; set the threshold a touch below that to surface early heat.
- Add OI-delta: Layer an OI change histogram (current − prior) to separate new positioning from pure churn.
- Linear vs inverse: For linear (USDT-margined) contracts, the normalization still works and keeps visuals consistent; for inverse, it’s essential.
Limitations
-----------
- Data availability: Works only if your symbol exposes an _OI feed on TradingView; otherwise it errors out.
- Exchange conventions: Volume units differ by venue (contracts, coin, notional). Normalization mitigates, but cross-symbol comparisons still need caution.
- Intrabar gaps: OI is typically end-of-bar; rapid intrabar shifts won’t appear until the bar closes.
Notes
-----
- Designed primarily for crypto derivatives. For non-crypto, the script blanks OI to avoid misleading plots and uses a daily TF when needed.
Credit
------
- Concept & data: Built for TradingView data feeds.
- Acknowledgment: Credit to TradingView default indicator as requested.
- Source: This write-up reflects the logic present in your uploaded script.
Disclaimer
----------
Markets move; indicators simplify. Use with position sizing, hard stops, and catalyst awareness. The Turnover Rate flags activity, not direction.
Enhanced Daily Sentiment & Auction Area Trading StrategyDetermine Daily Sentiment (Anchor Chart - Daily TF):
Analyze Yesterday's Daily Candle: Look at the previous day's daily candlestick (high, low, open, close). This is the "most important information."
Establish Bias: If yesterday's candle was bullish (closed higher), the bias for today is generally long (approx. 80% of the time). If bearish, the bias is short.
Moving Average Context: Note if the daily price is above or below its short-term moving average (e.g., 21 or 50 MA). This should align with the candle's bias (e.g., bullish daily candle above its MA).
Pre-Market & Opening Analysis (Information Gathering):
Check for Gaps: Observe if the market is gapping up or down in the pre-market session relative to yesterday's close. This provides an early clue to current sentiment.
Consider Overall Sentiment: Briefly factor in relevant news or overarching market sentiment (e.g., data releases, overall market feeling from yields, gold etc.). Trading Window: Focus primarily on trading within the first hour of the U.S. market open, as this is when volatility is typically highest, which the strategy relies on.
Setup 5-Minute Chart for Execution (Trading TF - 5-min):
Apply Moving Average: Use the same short-term moving average (e.g., 21 or 50 MA) as on the daily chart.
Seek Alignment (Crucial): The 5-minute chart's trend and price action relative to its MA must align with the daily chart's bias and MA relationship.
If Daily bias is LONG (price above daily MA), the 5-minute chart should also show price establishing itself above its 5-min MA, ideally with a similar "45-degree angle" uptrend.
If Daily bias is SHORT (price below daily MA), the 5-minute chart should also show price establishing itself below its 5-min MA, with a similar downtrend. If there's no clear alignment between the daily and 5-minute chart structure/MA, do not trade.
Identify the "Auction Area" (Value/Congestion) on the 5-Minute Chart:
This is a recent area of congestion, a small support/resistance flip, or where price has paused, consolidated, and is retesting, often near the 5-minute MA.
Uptrend (Long Bias): Look for a pullback (a small "V" shape dip) towards the 5-minute MA or a recent small resistance-turned-support area. This is the "auction retest" before a potential breakout higher.
Downtrend (Short Bias): Look for a pullback rally (an inverted "V" shape) towards the 5-minute MA or a recent small support-turned-resistance area.

CLS Patterns + Price Action Levels📌 Key Features:
✅ CLS Candle Patterns Detection:
CLS Type 1 (Sweeps & Closes Opposite) – Confirms liquidity sweeps with opposite direction close.
CLS Type 2 (Sweeps but No Opposite Close) – Identifies liquidity traps without full reversal.
CLS Type 3 (Engulfing Candles) – Strong momentum shifts with engulfing price action.
CLS Type 4 (Order Block Reversals) – Institutional order flow recognition.
✅ Institutional & Price Action Levels:
250 Pip Institutional Levels – Major S&R zones for Forex & Indices.
Minor Quarter Points (25 Pips) – Intraday precision for refined entries.
✅ Liquidity Imbalance & Order Flow Gaps:
Detects early impulse moves & liquidity voids
Highlights areas of market inefficiency & potential reversals
✅ Higher Timeframe EMA for Trend Confirmation:
Customizable Weekly 3 EMA Overlay
Dynamic color change based on price action
✅ Built-in Alerts for CLS Patterns:
Real-time alerts for CLS buy/sell signals
Configurable notifications for trade execution
🎯 How to Use:
1️⃣ Enable CLS Pattern Signals to spot liquidity sweep candles with directional confirmation.
2️⃣ Use Institutional & QP Levels to identify key areas where price is likely to react.
3️⃣ Monitor Liquidity Imbalances to detect inefficient price moves that may fill.
4️⃣ Confirm Trend with HTF EMA to trade with momentum.
5️⃣ Set Alerts for CLS patterns and key price levels to stay ahead of the market.
This indicator is ideal for Forex, Indices, and Crypto traders looking to refine their entries with precise price action confirmations.

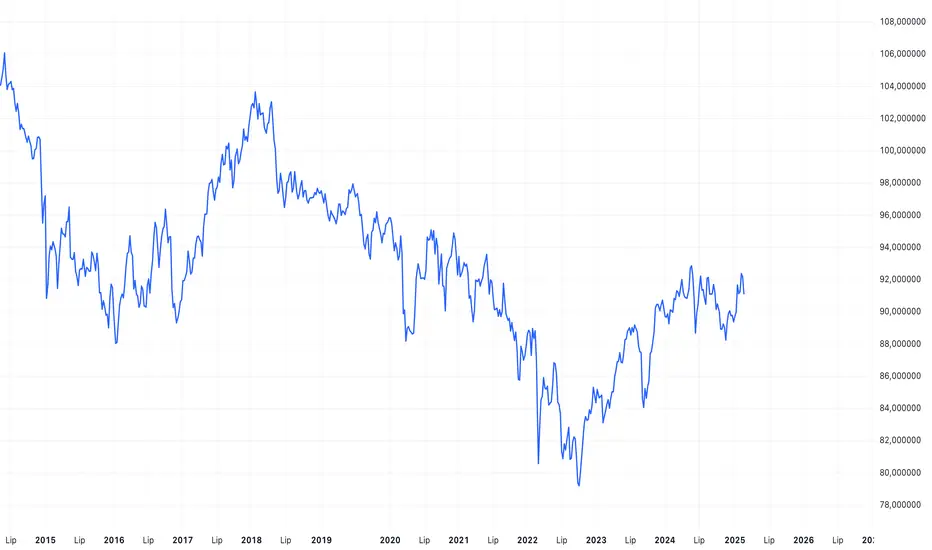
PLN IndexThe "PLN Index" is a custom indicator developed for TradingView using Pine Script (version 6). It tracks the relative strength of the Polish Zloty (PLN) against a basket of four major currencies: the U.S. Dollar (USD), Swiss Franc (CHF), Euro (EUR), and British Pound (GBP), with each currency contributing an equal weight of 25%. Modeled after the Polish Zloty Index (PLN_I) concept, this indicator offers traders a tool to monitor PLN’s performance across various forex market conditions.
How It Works
The indicator fetches closing prices for the currency pairs USDPLN, CHFPLN, EURPLN, and GBPPLN from TradingView’s data provider (FX_IDC). These pairs represent the amount of PLN needed to purchase one unit of each respective foreign currency. To measure PLN’s strength, the script inverts these rates (e.g., PLNUSD = 1/USDPLN) and calculates the geometric mean of the resulting values using the formula geom_mean = (PLNUSD * PLNCHF * PLNEUR * PLNGBP)^(0.25). The result is then normalized to a base value of 100 at the first bar with complete data, allowing users to observe relative changes in PLN’s value over time. A rising index indicates PLN appreciation, while a falling index suggests depreciation against the basket.
Key Features
Data Inputs: Retrieves closing prices for USDPLN, CHFPLN, EURPLN, and GBPPLN on the selected timeframe.
Calculation: Computes the geometric mean of the inverted exchange rates and normalizes it to 100 based on the first valid bar.
Visualization: Plots the index as a blue line with a linewidth of 2 on a separate chart pane (non-overlay).
Robust Normalization: Normalizes the index using the first bar where all data is available, improving reliability across different timeframes.
Usage
The PLN Index is useful for:
Evaluating the Polish Zloty’s strength or weakness relative to a balanced currency basket.
Identifying long-term trends or short-term shifts in PLN’s value for forex trading or economic analysis.
Supporting technical analysis when paired with additional indicators, such as moving averages or oscillators.
Limitations
Data Dependency: The indicator relies on the availability of historical data for all four currency pairs. Missing data (e.g., on higher timeframes like D1 or W1) may prevent accurate plotting.
Relative Normalization: Unlike the official PLN_I, which uses a fixed historical base date (e.g., January 2, 1984), this indicator normalizes to 100 at the first valid bar, making it a relative rather than absolute measure.
Potential Data Gaps: On higher timeframes, inconsistencies or limited historical data from the FX_IDC provider may result in incomplete index values.
Notes
This version of the PLN Index includes an improved normalization method that sets the base value (100) at the first bar with valid data, enhancing its adaptability compared to earlier iterations. It performs best on timeframes up to H4, where data availability is generally consistent. For higher timeframes, users should verify data completeness to ensure reliable results.
Luma Signals – Orderflow ImbalanceLuma Signals – Imbalance Detector
The Luma Signals – Imbalance Detector highlights price inefficiencies where buying or selling pressure dominates, causing rapid market movements. These imbalances can act as potential support and resistance zones or indicate areas where liquidity needs to be filled.
🔹 Key Features:
✔ Identifies Bullish & Bearish Imbalances – Blue candles indicate strong buying pressure, red candles indicate strong selling pressure.
✔ Clear Market Structure – Normal bullish candles appear in light gray, normal bearish candles in white.
✔ Dynamic Orderflow Analysis – Helps traders spot high-volatility price movements and potential reversals.
✔ No repainting & lightweight – The indicator works in real-time without altering past data.
📊 How to Use:
Trend Confirmation: If an imbalance aligns with a strong trend, it may indicate trend continuation.
Liquidity Gaps: Price often revisits imbalances before continuing its movement.
Scalping & Intraday Trading: Identify key reaction points for short-term trades.
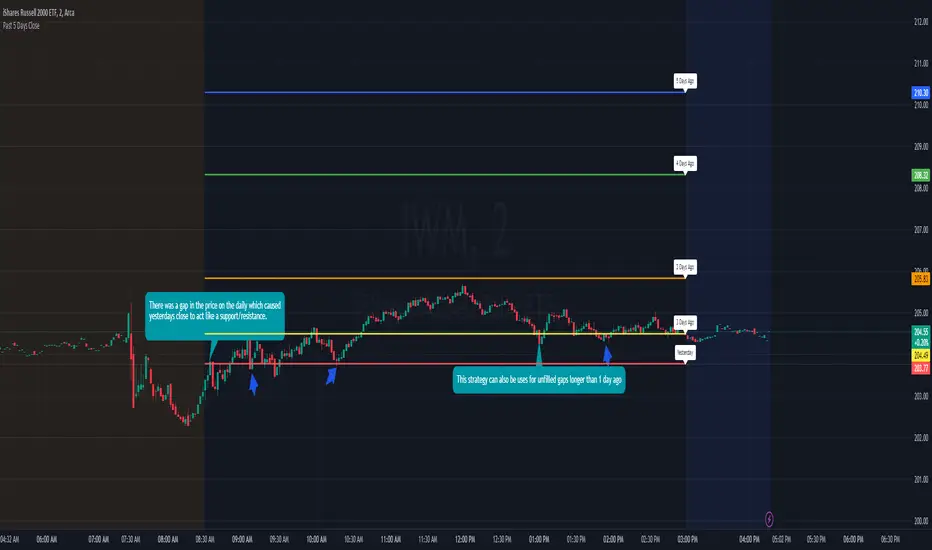
Previous 5 Day Market CloseThis indicator can be used with a strategy known as gap close reversal. Gap close reversal is a trading strategy based on the idea that when a market experiences a gap (a significant difference between the previous day's close and the current day's open), there's a tendency for the price to fill or "close" the gap by moving back to the previous day's closing price. Traders often look for such opportunities as potential entry or exit points.
Here's how you can use this script for gap close reversal trading:
Identify Gaps: Look for instances where the current day's open price significantly deviates from the previous day's close, resulting in a gap on the chart. This could be a gap-up (where the open is higher than the previous close) or a gap-down (where the open is lower than the previous close).
Plot the Script: Apply the "Past 5 Days Close" script to your chart. This will plot the closing prices of the past five trading days as lines on the chart. These lines will serve as reference points for potential gap close levels.
Look for Reversal Signals: Monitor the price action as the market opens and observe how it behaves in relation to the previous day's close and the lines plotted by the script. If the price starts to move towards one of the past closing prices after a gap, it could indicate a potential reversal.
Confirm with Other Indicators: Use additional technical indicators or chart patterns to confirm the potential reversal signal. For example, you might look for bullish or bearish candlestick patterns, support or resistance levels, or momentum indicators aligning with the reversal.
Price Range Volume Profile [Pt]█ Introduction
The Price Range Volume Profile (PRVP) is a revolutionary indicator. This tool stands out from its peers due to its unique ability to capture the entire price chart history, thus providing a comprehensive volume profile of the entire asset's trading history, as available on TradingView chart. It's worth noting that I believe this tool is the first of its kind to accomplish such a feat. A much recommended tool if you are a volume profile trader.
█ Main Features
► Historical Lookback: This feature dives deep into the past, grasping all the historical data of an asset. It's equipped to handle up to 20,000 bars, although users without a premium TradingView account are advised to keep it at a maximum of 10,000 bars, or just use the "Full Historical Lookback" feature.
► Volume Profile / POC: Displays the distribution of volume across price levels for the selected price range. The Point of Control (POC), which is the price level with the highest traded volume, is also highlighted.
► Customization: Users have the flexibility to adjust the profile's appearance, including profile width, horizontal offset, and the option to fill the background of the profile range.
► Time Weighting: This feature allows users to give more weight to recent trading activity, which can be especially useful for intraday traders or during times of high volatility. Note that this feature will impact the volume profile and POC level.
► Settings Table: A settings table is displayed on the chart for users to quickly reference their input parameters.
█ Input Parameters
► Lookback Timeframe: Determines the period for which the volume profile is generated.
► Price Range: The percentage distance to consider for the profile, adjusted above and below the current closing price.
► Profile Step size: The granularity of the volume profile. Users can opt for automatic step size based on a predefined calculation or set their preferred tick step size.
► Historical Bars Lookback: Determines the number of bars to include in the volume profile calculation.
► Profile Visuals: Adjust the appearance and layout of the volume profile on the chart.
► Extra: Additional settings including the display of a settings table and its location.
█ Basic Understanding of Volume Profile - How to use PRVP?
Volume Profile is a valuable tool for traders who want insights into where the majority of trading activity has occurred. Here are some tips to make the most of it:
► Understand the Basics: Before using the Volume Profile, ensure you understand the difference between it and the standard volume histogram. While both represent volume, the former displays it against price while the latter shows it against time.
► Identify High Volume Nodes (HVN) and Low Volume Nodes (LVN):
◊ HVN: Areas where there's a lot of trading activity and where the price has spent a lot of time. These areas can act as strong support or resistance.
◊ LVN: Areas where there's a lack of trading activity. Prices might move quickly through these areas, and they can act as potential breakpoints or accelerators for price movement.
► Locate the Point of Control (POC): This is the price level with the highest traded volume for a specified period. It often acts as a magnet for price, and it can serve as a pivot or reference point.
► Trend Confirmation: A shift in the volume profile from one price level to another can confirm a trend. For instance, if higher volume starts to build at higher price levels, it may indicate a strong uptrend.
► Watch for Volume Gaps: If there's a significant gap in the volume profile, prices may move quickly through these levels as there's little historical trading activity to act as support or resistance.
█ Other Usage Tips
◊ For optimal performance, ensure that the chosen timeframe aligns closely with the chart timeframe. Differences in timeframes may lead to minor discrepancies in the volume profile.
◊ To address any errors arising from too many levels displayed on the volume profile, consider increasing the Profile Step size or reducing the Price Range.

ATR BandsIn many strategies, it's quite common to use a scaled ATR to help define a stop-loss, and it's not uncommon to use it for take-profit targets as well. While it's possible to use the built-in ATR indicator and manually calculate the offset value, we felt this wasn't particularly intuitive or efficient, and could lead to the potential for miscalculations. And while there are quite a few indicators that plot ATR bands in some form or another already on TV, we could not find one that actually performed the exact way that we wanted. They all had at least one of the following gaps:
The ATR offset was not configurable (usually hard-coded to be based off the high or low, while we generally prefer to use close)
It would only print a single band (either the upper or lower), which would require the same indicator to be added twice
The ATR scaling factor was either not configurable or only stepped in whole numbers (often time fractional factors like 1.5 yield better results)
To that end, we took to making this enhanced version to meet all of the above requirements. While we were doing so, we decided to take this opportunity to also make some non-functional enhancements as well:
Updated the indicator to the most recent version of Pine
Updated the indicator definition to allow alternate (non-chart) timeframe usage
Made the input types explicitly defined to improve consistency
Updated the inputs with appropriate minimum values and step sizes where appropriate
Separated settings into logical groups
Added helptext to the indicator settings noting usage and common settings values
Explicitly titled the on-chart plots of the ATR bands so that they can more easily be identified and referenced in other indicators/scripts, as well as the Data Window
Food for thought : When looking at some of the behaviors of these ATR bands, you can see that when price first levels out, you can draw a "consolidation zone" from the first peak of the upper ATR band to the first valley of the lower ATR band that price will generally respect. Look for price to break and close outside of that zone. When that happens, price will usually (but not always) make a notable move in that direction, which can be used as either a potential trigger or as an additional confluence with other indicators/price action.
Finally, while we have made what we feel are some noteworthy updates and enhancements to this indicator, and have every intention of continuing to do so as we find worthy opportunities for enhancement, credit is still due to the original author: AlexanderTeaH

SMC N-Gram Probability Matrix [PhenLabs]📊 SMC N-Gram Probability Matrix
Version: PineScript™ v6
📌 Description
The SMC N-Gram Probability Matrix applies computational linguistics methodology to Smart Money Concepts trading. By treating SMC patterns as a discrete “alphabet” and analyzing their sequential relationships through N-gram modeling, this indicator calculates the statistical probability of which pattern will appear next based on historical transitions.
Traditional SMC analysis is reactive—traders identify patterns after they form and then anticipate the next move. This indicator inverts that approach by building a transition probability matrix from up to 5,000 bars of pattern history, enabling traders to see which SMC formations most frequently follow their current market sequence.
The indicator detects and classifies 11 distinct SMC patterns including Fair Value Gaps, Order Blocks, Liquidity Sweeps, Break of Structure, and Change of Character in both bullish and bearish variants, then tracks how these patterns transition from one to another over time.
🚀 Points of Innovation
First indicator to apply N-gram sequence modeling from computational linguistics to SMC pattern analysis
Dynamic transition matrix rebuilds every 50 bars for adaptive probability calculations
Supports bigram (2), trigram (3), and quadgram (4) sequence lengths for varying analysis depth
Priority-based pattern classification ensures higher-significance patterns (CHoCH, BOS) take precedence
Configurable minimum occurrence threshold filters out statistically insignificant predictions
Real-time probability visualization with graphical confidence bars
🔧 Core Components
Pattern Alphabet System: 11 discrete SMC patterns encoded as integers for efficient matrix indexing and transition tracking
Swing Point Detection: Uses ta.pivothigh/pivotlow with configurable sensitivity for non-repainting structure identification
Transition Count Matrix: Flattened array storing occurrence counts for all possible pattern sequence transitions
Context Encoder: Converts N-gram pattern sequences into unique integer IDs for matrix lookup
Probability Calculator: Transforms raw transition counts into percentage probabilities for each possible next pattern
🔥 Key Features
Multi-Pattern SMC Detection: Simultaneously identifies FVGs, Order Blocks, Liquidity Sweeps, BOS, and CHoCH formations
Adjustable N-Gram Length: Choose between 2-4 pattern sequences to balance specificity against sample size
Flexible Lookback Range: Analyze anywhere from 100 to 5,000 historical bars for matrix construction
Pattern Toggle Controls: Enable or disable individual SMC pattern types to customize analysis focus
Probability Threshold Filtering: Set minimum occurrence requirements to ensure prediction reliability
Alert Integration: Built-in alert conditions trigger when high-probability predictions emerge
🎨 Visualization
Probability Table: Displays current pattern, recent sequence, sample count, and top N predicted patterns with percentage probabilities
Graphical Probability Bars: Visual bar representation (█░) showing relative probability strength at a glance
Chart Pattern Markers: Color-coded labels placed directly on price bars identifying detected SMC formations
Pattern Short Codes: Compact notation (F+, F-, O+, O-, L↑, L↓, B+, B-, C+, C-) for quick pattern identification
Customizable Table Position: Place probability display in any corner of your chart
📖 Usage Guidelines
N-Gram Configuration
N-Gram Length: Default 2, Range 2-4. Lower values provide more samples but less specificity. Higher values capture complex sequences but require more historical data.
Matrix Lookback Bars: Default 500, Range 100-5000. More bars increase statistical significance but may include outdated market behavior.
Min Occurrences for Prediction: Default 2, Range 1-10. Higher values filter noise but may reduce prediction availability.
SMC Detection Settings
Swing Detection Length: Default 5, Range 2-20. Controls pivot sensitivity for structure analysis.
FVG Minimum Size: Default 0.1%, Range 0.01-2.0%. Filters insignificant gaps.
Order Block Lookback: Default 10, Range 3-30. Bars to search for OB formations.
Liquidity Sweep Threshold: Default 0.3%, Range 0.05-1.0%. Minimum wick extension beyond swing points.
Display Settings
Show Probability Table: Toggle the probability matrix display on/off.
Show Top N Probabilities: Default 5, Range 3-10. Number of predicted patterns to display.
Show SMC Markers: Toggle on-chart pattern labels.
✅ Best Use Cases
Anticipating continuation or reversal patterns after liquidity sweeps
Identifying high-probability BOS/CHoCH sequences for trend trading
Filtering FVG and Order Block signals based on historical follow-through rates
Building confluence by comparing predicted patterns with other technical analysis
Studying how SMC patterns typically sequence on specific instruments or timeframes
⚠️ Limitations
Predictions are based solely on historical pattern frequency and do not account for fundamental factors
Low sample counts produce unreliable probabilities—always check the Samples display
Market regime changes can invalidate historical transition patterns
The indicator requires sufficient historical data to build meaningful probability matrices
Pattern detection uses standardized parameters that may not capture all institutional activity
💡 What Makes This Unique
Linguistic Modeling Applied to Markets: Treats SMC patterns like words in a language, analyzing how they “flow” together
Quantified Pattern Relationships: Transforms subjective SMC analysis into objective probability percentages
Adaptive Learning: Matrix rebuilds periodically to incorporate recent pattern behavior
Comprehensive SMC Coverage: Tracks all major Smart Money Concepts in a unified probability framework
🔬 How It Works
1. Pattern Detection Phase
Each bar is analyzed for SMC formations using configurable detection parameters
A priority hierarchy assigns the most significant pattern when multiple detections occur
2. Sequence Encoding Phase
Detected patterns are stored in a rolling history buffer of recent classifications
The current N-gram context is encoded into a unique integer identifier
3. Matrix Construction Phase
Historical pattern sequences are iterated to count transition occurrences
Each context-to-next-pattern transition increments the appropriate matrix cell
4. Probability Calculation Phase
Current context ID retrieves corresponding transition counts from the matrix
Raw counts are converted to percentages based on total context occurrences
5. Visualization Phase
Probabilities are sorted and the top N predictions are displayed in the table
Chart markers identify the current detected pattern for visual reference
💡 Note:
This indicator performs best when used as a confluence tool alongside traditional SMC analysis. The probability predictions highlight statistically common pattern sequences but should not be used as standalone trading signals. Always verify predictions against price action context, higher timeframe structure, and your overall trading plan. Monitor the sample count to ensure predictions are based on adequate historical data.

Smart Money Concepts [Modern Neon V2]This is a visually overhauled version of the popular Smart Money Concepts (SMC) indicator, designed specifically for traders who prefer Dark Mode, High Contrast, and Maximum Visibility.
While the underlying logic preserves the robust structure detection of the original LuxAlgo script, the visual presentation has been completely modernized. The default "dull" colors have been replaced with a vibrant Cyberpunk Neon palette, and text labels have been significantly upscaled to ensure market structure is readable at a glance, even on high-resolution monitors.
🎨 Visual & Style Enhancements:
Neon Palette:
Bullish: Electric Cyan (#00F5FF)
Bearish: Neon Hot Pink (#FF007F)
Neutral/Levels: Bright Gold (#FFD700)
High Visibility Text: Market Structure labels (BOS, CHoCH, HH/LL) have been upgraded from "Tiny" to Normal size. Key Swing Points (Strong High/Low) are set to Large.
Modern "Solid" Blocks: Order Blocks and FVGs feature reduced transparency (60%) for a bolder, solid look that doesn't get washed out on dark backgrounds.
Decluttered: Removed unnecessary "Small" elements and dotted lines to focus on price action.
🛠 Key Features:
Real-Time Structure: Automatic detection of Internal and Swing structure (BOS & CHoCH) with trend coloring.
Order Blocks: Highlights Bullish and Bearish Order Blocks with new mitigation logic.
Fair Value Gaps (FVG): Auto-threshold detection for high-probability gaps.
Premium & Discount Zones: Automatically plots equilibrium zones for better entry targeting.
Multi-Timeframe Levels: Display Daily, Weekly, and Monthly highs/lows.
Trend Dashboard: (If you added the dashboard code) A clean panel displaying the current Internal and Swing trend bias.
CREDITS & LICENSE: This script is a modification of the "Smart Money Concepts " indicator.
Original Author: © LuxAlgo
License: Attribution-NonCommercial-ShareAlike 4.0 International (CC BY-NC-SA 4.0)
creativecommons.org

WorldCup Dashboard + Institutional Sessions© 2025 NewMeta™ — Educational use only.
# Full, Premium Description
## WorldCup Dashboard + Institutional Sessions
**A trade-ready, intraday framework that combines market structure, real flow, and institutional timing.**
This toolkit fuses **Institutional Sessions** with a **price–volume decision engine** so you can see *who is active*, *where value sits*, and *whether the drive is real*. You get: **CVD/Delta**, volume-weighted **Momentum**, **Aggression** spikes, **FVG (MTF)** with nearest side, **Daily Volume Profile (VAH/POC/VAL)**, **ATR regime**, a **24h position gauge**, classic **candle patterns**, IBH/IBL + **first-hour “true close”** lines, and a **10-vote confluence scoreboard**—all in one view.
---
## What’s inside (and how to trade it)
### 🌍 Institutional Sessions (Sydney • Tokyo • London • New York)
* Session boxes + a highlighted **first hour**.
* Plots the **true close** (first-hour close) as a running line with a label.
**Use:** Many desks anchor risk to this print. Above = bullish bias; below = bearish. **IBH/IBL** breaks during London/NY carry the most signal.
### 📊 CVD / Delta (Flow)
* Net buyer vs seller pressure with smooth trend state.
**Use:** **Rising CVD + acceptance above mid/POC** confirms continuation. Bearish price + rising CVD = caution (possible absorption).
### ⚡ Volume-Weighted Momentum
* Momentum adjusted by participation quality (volume).
**Use:** Momentum>MA and >0 → trend drive is “real”; <0 and falling → distribution risk.
### 🔥 Aggression Detector
* ROC × normalized volume × wick factor to flag **forceful** candles.
**Use:** On spikes, avoid fading blindly—wait for pullbacks into **aligned FVG** or for aggression to cool.
### 🟦🟪 Fair Value Gaps (with MTF)
* Detects up to 3 recent FVGs and marks the **nearest** side to price.
**Use:** Trend pullbacks into **bullish FVG** for longs; bounces into **bearish FVG** for shorts. Optional threshold to filter weak gaps.
### 🧭 24h Gauge (positioning)
* Shows current price across the 24h low⇢high with a mid reference.
**Use:** Above mid and pushing upper third = momentum continuation setups; below mid = sell the rips bias.
### 🧱 Daily Volume Profile (manual per day)
* **VAH / POC / VAL** derived from discretized rows.
**Use:** **POC below** supports longs; **POC above** caps rallies. Fade VAH/VAL in ranges; treat them as break/hold levels in trends.
### 📈 ATR Regime
* **ATR vs ATR-avg** with direction and regime flag (**HIGH / NORMAL / LOW**).
**Use:** HIGH ⇒ give trades room & favor trend following. LOW ⇒ fade edges, scale targets.
### 🕯️ Candle Patterns (contextual, not standalone)
* Engulfings, Morning/Evening Star, 3 Soldiers/Crows, Harami, Hammer/Shooting Star, Double Top/Bottom.
**Use:** Only with session + flow + momentum alignment.
### 🤝 Price–Volume Classification
* Labels each bar as **continuation**, **exhaustion**, **distribution**, or **healthy pullback**.
**Use:** Align continuation reads with trend; treat “Price↑ + Vol↓” as a caution flag.
### 🧪 Confluence Scoreboard & B/S Meter
* Ten elements vote: 🔵 bull, ⚪ neutral, 🟣 bear.
**Use:** Execution filter—take setups when the board’s skew matches your trade direction.
---
## Playbooks (actionable)
**Trend Pullback (Long)**
1. London/NY active, Momentum↑, CVD↑, price above 24h mid & POC.
2. Pullback into **nearest bullish FVG**.
3. Invalidate under FVG low or **true-close** line.
4. Targets: IBH → VAH → 24h high.
**Range Fade (Short)**
1. Asia/quiet regime, **Price↑ + Vol↓** into **VAH**, ATR low.
2. Nearest FVG bearish or scoreboard skew bearish.
3. Invalidate above VAH/IBH.
4. Targets: POC → VAL.
**News/Impulse**
Aggression spike? Don’t chase. Let it pull back into the aligned FVG; require CVD/Momentum agreement before entry.
---
## Alerts (included)
* **Bull/Bear Confluence ≥ 7/10**
* **Intraday Target Achieved** / **Daily Target Achieved**
* **Session True-Close Retests** (Sydney/Tokyo/London/NY)
*(Keep alerts “Once per bar” unless you specifically want intrabar triggers.)*
---
## Setup Tips
* **UTC**: Choose the reference that matches how you track sessions (default UTC+2).
* **Volume threshold**: 2.0× is a strong baseline; raise for noisy alts, lower for majors.
* **CVD smoothing**: 14–24 for scalps; 24–34 for slower markets.
* **ATR lengths**: Keep defaults unless your asset has a persistent regime shift.
---
## Why this framework?
Because **timing (sessions)**, **truth (flow)**, and **location (value/FVG)** together beat any single signal. You get *who is trading*, *how strong the push is*, and *where risk lives*—on one screen—so execution is faster and cleaner.
---
**Disclaimer**: Educational use only. Not financial advice. Markets are risky—backtest and size responsibly.

BOCS Channel Scalper Indicator - Mean Reversion Alert System# BOCS Channel Scalper Indicator - Mean Reversion Alert System
## WHAT THIS INDICATOR DOES:
This is a mean reversion trading indicator that identifies consolidation channels through volatility analysis and generates alert signals when price enters entry zones near channel boundaries. **This indicator version is designed for manual trading with comprehensive alert functionality.** Unlike automated strategies, this tool sends notifications (via popup, email, SMS, or webhook) when trading opportunities occur, allowing you to manually review and execute trades. The system assumes price will revert to the channel mean, identifying scalp opportunities as price reaches extremes and preparing to bounce back toward center.
## INDICATOR VS STRATEGY - KEY DISTINCTION:
**This is an INDICATOR with alerts, not an automated strategy.** It does not execute trades automatically. Instead, it:
- Displays visual signals on your chart when entry conditions are met
- Sends customizable alerts to your device/email when opportunities arise
- Shows TP/SL levels for reference but does not place orders
- Requires you to manually enter and exit positions based on signals
- Works with all TradingView subscription levels (alerts included on all plans)
**For automated trading with backtesting**, use the strategy version. For manual control with notifications, use this indicator version.
## ALERT CAPABILITIES:
This indicator includes four distinct alert conditions that can be configured independently:
**1. New Channel Formation Alert**
- Triggers when a fresh BOCS channel is identified
- Message: "New BOCS channel formed - potential scalp setup ready"
- Use this to prepare for upcoming trading opportunities
**2. Long Scalp Entry Alert**
- Fires when price touches the long entry zone
- Message includes current price, calculated TP, and SL levels
- Notification example: "LONG scalp signal at 24731.75 | TP: 24743.2 | SL: 24716.5"
**3. Short Scalp Entry Alert**
- Fires when price touches the short entry zone
- Message includes current price, calculated TP, and SL levels
- Notification example: "SHORT scalp signal at 24747.50 | TP: 24735.0 | SL: 24762.75"
**4. Any Entry Signal Alert**
- Combined alert for both long and short entries
- Use this if you want a single alert stream for all opportunities
- Message: "BOCS Scalp Entry: at "
**Setting Up Alerts:**
1. Add indicator to chart and configure settings
2. Click the Alert (⏰) button in TradingView toolbar
3. Select "BOCS Channel Scalper" from condition dropdown
4. Choose desired alert type (Long, Short, Any, or Channel Formation)
5. Set "Once Per Bar Close" to avoid false signals during bar formation
6. Configure delivery method (popup, email, webhook for automation platforms)
7. Save alert - it will fire automatically when conditions are met
**Alert Message Placeholders:**
Alerts use TradingView's dynamic placeholder system:
- {{ticker}} = Symbol name (e.g., NQ1!)
- {{close}} = Current price at signal
- {{plot_1}} = Calculated take profit level
- {{plot_2}} = Calculated stop loss level
These placeholders populate automatically, creating detailed notification messages without manual configuration.
## KEY DIFFERENCE FROM ORIGINAL BOCS:
**This indicator is designed for traders seeking higher trade frequency.** The original BOCS indicator trades breakouts OUTSIDE channels, waiting for price to escape consolidation before entering. This scalper version trades mean reversion INSIDE channels, entering when price reaches channel extremes and betting on a bounce back to center. The result is significantly more trading opportunities:
- **Original BOCS**: 1-3 signals per channel (only on breakout)
- **Scalper Indicator**: 5-15+ signals per channel (every touch of entry zones)
- **Trade Style**: Mean reversion vs trend following
- **Hold Time**: Seconds to minutes vs minutes to hours
- **Best Markets**: Ranging/choppy conditions vs trending breakouts
This makes the indicator ideal for active day traders who want continuous alert opportunities within consolidation zones rather than waiting for breakout confirmation. However, increased signal frequency also means higher potential commission costs and requires disciplined trade selection when acting on alerts.
## TECHNICAL METHODOLOGY:
### Price Normalization Process:
The indicator normalizes price data to create consistent volatility measurements across different instruments and price levels. It calculates the highest high and lowest low over a user-defined lookback period (default 100 bars). Current close price is normalized using: (close - lowest_low) / (highest_high - lowest_low), producing values between 0 and 1 for standardized volatility analysis.
### Volatility Detection:
A 14-period standard deviation is applied to the normalized price series to measure price deviation from the mean. Higher standard deviation values indicate volatility expansion; lower values indicate consolidation. The indicator uses ta.highestbars() and ta.lowestbars() to identify when volatility peaks and troughs occur over the detection period (default 14 bars).
### Channel Formation Logic:
When volatility crosses from a high level to a low level (ta.crossover(upper, lower)), a consolidation phase begins. The indicator tracks the highest and lowest prices during this period, which become the channel boundaries. Minimum duration of 10+ bars is required to filter out brief volatility spikes. Channels are rendered as box objects with defined upper and lower boundaries, with colored zones indicating entry areas.
### Entry Signal Generation:
The indicator uses immediate touch-based entry logic. Entry zones are defined as a percentage from channel edges (default 20%):
- **Long Entry Zone**: Bottom 20% of channel (bottomBound + channelRange × 0.2)
- **Short Entry Zone**: Top 20% of channel (topBound - channelRange × 0.2)
Long signals trigger when candle low touches or enters the long entry zone. Short signals trigger when candle high touches or enters the short entry zone. Visual markers (arrows and labels) appear on chart, and configured alerts fire immediately.
### Cooldown Filter:
An optional cooldown period (measured in bars) prevents alert spam by enforcing minimum spacing between consecutive signals. If cooldown is set to 3 bars, no new long alert will fire until 3 bars after the previous long signal. Long and short cooldowns are tracked independently, allowing both directions to signal within the same period.
### ATR Volatility Filter:
The indicator includes a multi-timeframe ATR filter to avoid alerts during low-volatility conditions. Using request.security(), it fetches ATR values from a specified timeframe (e.g., 1-minute ATR while viewing 5-minute charts). The filter compares current ATR to a user-defined minimum threshold:
- If ATR ≥ threshold: Alerts enabled
- If ATR < threshold: No alerts fire
This prevents notifications during dead zones where mean reversion is unreliable due to insufficient price movement. The ATR status is displayed in the info table with visual confirmation (✓ or ✗).
### Take Profit Calculation:
Two TP methods are available:
**Fixed Points Mode**:
- Long TP = Entry + (TP_Ticks × syminfo.mintick)
- Short TP = Entry - (TP_Ticks × syminfo.mintick)
**Channel Percentage Mode**:
- Long TP = Entry + (ChannelRange × TP_Percent)
- Short TP = Entry - (ChannelRange × TP_Percent)
Default 50% targets the channel midline, a natural mean reversion target. These levels are displayed as visual lines with labels and included in alert messages for reference when manually placing orders.
### Stop Loss Placement:
Stop losses are calculated just outside the channel boundary by a user-defined tick offset:
- Long SL = ChannelBottom - (SL_Offset_Ticks × syminfo.mintick)
- Short SL = ChannelTop + (SL_Offset_Ticks × syminfo.mintick)
This logic assumes channel breaks invalidate the mean reversion thesis. SL levels are displayed on chart and included in alert notifications as suggested stop placement.
### Channel Breakout Management:
Channels are removed when price closes more than 10 ticks outside boundaries. This tolerance prevents premature channel deletion from minor breaks or wicks, allowing the mean reversion setup to persist through small boundary violations.
## INPUT PARAMETERS:
### Channel Settings:
- **Nested Channels**: Allow multiple overlapping channels vs single channel
- **Normalization Length**: Lookback for high/low calculation (1-500, default 100)
- **Box Detection Length**: Period for volatility detection (1-100, default 14)
### Scalping Settings:
- **Enable Long Scalps**: Toggle long alert generation on/off
- **Enable Short Scalps**: Toggle short alert generation on/off
- **Entry Zone % from Edge**: Size of entry zone (5-50%, default 20%)
- **SL Offset (Ticks)**: Distance beyond channel for stop (1+, default 5)
- **Cooldown Period (Bars)**: Minimum spacing between alerts (0 = no cooldown)
### ATR Filter:
- **Enable ATR Filter**: Toggle volatility filter on/off
- **ATR Timeframe**: Source timeframe for ATR (1, 5, 15, 60 min, etc.)
- **ATR Length**: Smoothing period (1-100, default 14)
- **Min ATR Value**: Threshold for alert enablement (0.1+, default 10.0)
### Take Profit Settings:
- **TP Method**: Choose Fixed Points or % of Channel
- **TP Fixed (Ticks)**: Static distance in ticks (1+, default 30)
- **TP % of Channel**: Dynamic target as channel percentage (10-100%, default 50%)
### Appearance:
- **Show Entry Zones**: Toggle zone labels on channels
- **Show Info Table**: Display real-time indicator status
- **Table Position**: Corner placement (Top Left/Right, Bottom Left/Right)
- **Long Color**: Customize long signal color (default: darker green for readability)
- **Short Color**: Customize short signal color (default: red)
- **TP/SL Colors**: Customize take profit and stop loss line colors
- **Line Length**: Visual length of TP/SL reference lines (5-200 bars)
## VISUAL INDICATORS:
- **Channel boxes** with semi-transparent fill showing consolidation zones
- **Colored entry zones** labeled "LONG ZONE ▲" and "SHORT ZONE ▼"
- **Entry signal arrows** below/above bars marking long/short alerts
- **TP/SL reference lines** with emoji labels (⊕ Entry, 🎯 TP, 🛑 SL)
- **Info table** showing channel status, last signal, entry/TP/SL prices, risk/reward ratio, and ATR filter status
- **Visual confirmation** when alerts fire via on-chart markers synchronized with notifications
## HOW TO USE:
### For 1-3 Minute Scalping with Alerts (NQ/ES):
- ATR Timeframe: "1" (1-minute)
- ATR Min Value: 10.0 (for NQ), adjust per instrument
- Entry Zone %: 20-25%
- TP Method: Fixed Points, 20-40 ticks
- SL Offset: 5-10 ticks
- Cooldown: 2-3 bars to reduce alert spam
- **Alert Setup**: Configure "Any Entry Signal" for combined long/short notifications
- **Execution**: When alert fires, verify chart visuals, then manually place limit order at entry zone with provided TP/SL levels
### For 5-15 Minute Day Trading with Alerts:
- ATR Timeframe: "5" or match chart
- ATR Min Value: Adjust to instrument (test 8-15 for NQ)
- Entry Zone %: 20-30%
- TP Method: % of Channel, 40-60%
- SL Offset: 5-10 ticks
- Cooldown: 3-5 bars
- **Alert Setup**: Configure separate "Long Scalp Entry" and "Short Scalp Entry" alerts if you trade directionally based on bias
- **Execution**: Review channel structure on alert, confirm ATR filter shows ✓, then enter manually
### For 30-60 Minute Swing Scalping with Alerts:
- ATR Timeframe: "15" or "30"
- ATR Min Value: Lower threshold for broader market
- Entry Zone %: 25-35%
- TP Method: % of Channel, 50-70%
- SL Offset: 10-15 ticks
- Cooldown: 5+ bars or disable
- **Alert Setup**: Use "New Channel Formation" to prepare for setups, then "Any Entry Signal" for execution alerts
- **Execution**: Larger timeframes allow more analysis time between alert and entry
### Webhook Integration for Semi-Automation:
- Configure alert webhook URL to connect with platforms like TradersPost, TradingView Paper Trading, or custom automation
- Alert message includes all necessary order parameters (direction, entry, TP, SL)
- Webhook receives structured data when signal fires
- External platform can auto-execute based on alert payload
- Still maintains manual oversight vs full strategy automation
## USAGE CONSIDERATIONS:
- **Manual Discipline Required**: Alerts provide opportunities but execution requires judgment. Not all alerts should be taken - consider market context, trend, and channel quality
- **Alert Timing**: Alerts fire on bar close by default. Ensure "Once Per Bar Close" is selected to avoid false signals during bar formation
- **Notification Delivery**: Mobile/email alerts may have 1-3 second delay. For immediate execution, use desktop popups or webhook automation
- **Cooldown Necessity**: Without cooldown, rapidly touching price action can generate excessive alerts. Start with 3-bar cooldown and adjust based on alert volume
- **ATR Filter Impact**: Enabling ATR filter dramatically reduces alert count but improves quality. Track filter status in info table to understand when you're receiving fewer alerts
- **Commission Awareness**: High alert frequency means high potential trade count. Calculate if your commission structure supports frequent scalping before acting on all alerts
## COMPATIBLE MARKETS:
Works on any instrument with price data including stock indices (NQ, ES, YM, RTY), individual stocks, forex pairs (EUR/USD, GBP/USD), cryptocurrency (BTC, ETH), and commodities. Volume-based features are not included in this indicator version. Multi-timeframe ATR requires higher-tier TradingView subscription for request.security() functionality on timeframes below chart timeframe.
## KNOWN LIMITATIONS:
- **Indicator does not execute trades** - alerts are informational only; you must manually place all orders
- **Alert delivery depends on TradingView infrastructure** - delays or failures possible during platform issues
- **No position tracking** - indicator doesn't know if you're in a trade; you must manage open positions independently
- **TP/SL levels are reference only** - you must manually set these on your broker platform; they are not live orders
- **Immediate touch entry can generate many alerts** in choppy zones without adequate cooldown
- **Channel deletion at 10-tick breaks** may be too aggressive or lenient depending on instrument tick size
- **ATR filter from lower timeframes** requires TradingView Premium/Pro+ for request.security()
- **Mean reversion logic fails** in strong breakout scenarios - alerts will fire but trades may hit stops
- **No partial closing capability** - full position management is manual; you determine scaling out
- **Alerts do not account for gaps** or overnight price changes; morning alerts may be stale
## RISK DISCLOSURE:
Trading involves substantial risk of loss. This indicator provides signals for educational and informational purposes only and does not constitute financial advice. Past performance does not guarantee future results. Mean reversion strategies can experience extended drawdowns during trending markets. Alerts are not guaranteed to be profitable and should be combined with your own analysis. Stop losses may not fill at intended levels during extreme volatility or gaps. Never trade with capital you cannot afford to lose. Consider consulting a licensed financial advisor before making trading decisions. Always verify alerts against current market conditions before executing trades manually.
## ACKNOWLEDGMENT & CREDITS:
This indicator is built upon the channel detection methodology created by **AlgoAlpha** in the "Smart Money Breakout Channels" indicator. Full credit and appreciation to AlgoAlpha for pioneering the normalized volatility approach to identifying consolidation patterns. The core channel formation logic using normalized price standard deviation is AlgoAlpha's original contribution to the TradingView community.
Enhancements to the original concept include: mean reversion entry logic (vs breakout), immediate touch-based alert generation, comprehensive alert condition system with customizable notifications, multi-timeframe ATR volatility filtering, cooldown period for alert management, dual TP methods (fixed points vs channel percentage), visual TP/SL reference lines, and real-time status monitoring table. This indicator version is specifically designed for manual traders who prefer alert-based decision making over automated execution.

Premarket Power MovePremarket Power Move is an intraday research tool that tracks what happens after strong premarket or opening gaps.
📊 Core Idea
• When a stock opens +X% above the prior close, it often attracts momentum traders.
• This script measures whether the stock continues to follow through higher or instead fades back down within the first trading hour.
• It calculates:
• The probability of a post-gap rally vs. a drawdown
• Average and maximum retracements after the surge
• Event-day hit rate (how many days actually triggered the condition)
🎯 Use Cases
• Identify “gap-and-go” opportunities where strong premarket strength leads to further gains.
• Spot potential fade setups where early enthusiasm quickly reverses.
• Backtest your intraday strategies with objective statistics instead of gut feeling.
⚙️ Features
• Customizable thresholds for premarket/open surge (%) and follow-through window (minutes).
• Marks the chart with reference lines:
• Prior close
• Surge threshold (e.g. +6%)
• Intraday high/low used for probability calculations.
• Outputs summary statistics (probabilities, averages, counts) directly on the chart.
🔔 Note
This is not a buy/sell signal generator. It is a probability and behavior analysis tool that helps traders understand how often strong premarket gaps continue vs. fade.

Theil-Sen Line Filter [BackQuant]Theil-Sen Line Filter
A robust, median-slope baseline that tracks price while resisting outliers. Designed for the chart pane as a clean, adaptive reference line with optional candle coloring and slope-flip alerts.
What this is
A trend filter that estimates the underlying slope of price using a Theil-Sen style median of past slopes, then advances a baseline by a controlled fraction of that slope each bar. The result is a smooth line that reacts to real directional change while staying calm through noise, gaps, and single-bar shocks.
Why Theil-Sen
Classical moving averages are sensitive to outliers and shape changes. Ordinary least squares is sensitive to large residuals. The Theil-Sen idea replaces a single fragile estimate with the median of many simple slopes, which is statistically robust and less influenced by a few extreme bars. That makes the baseline steadier in choppy conditions and cleaner around regime turns.
What it plots
Filtered baseline that advances by a fraction of the robust slope each bar.
Optional candle coloring by baseline slope sign for quick trend read.
Alerts when the baseline slope turns up or down.
How it behaves (high level)
Looks back over a fixed window and forms many “current vs past” bar-to-bar slopes.
Takes the median of those slopes to get a robust estimate for the bar.
Optionally caps the magnitude of that per-bar slope so a single volatile bar cannot yank the line.
Moves the baseline forward by a user-controlled fraction of the estimated slope. Lower fractions are smoother. Higher fractions are more responsive.
Inputs and what they do
Price Source — the series the filter tracks. Typical is close; HL2 or HLC3 can be smoother.
Window Length — how many bars to consider for slopes. Larger windows are steadier and slower. Smaller windows are quicker and noisier.
Response — fraction of the estimated slope applied each bar. 1.00 follows the robust slope closely; values below 1.00 dampen moves.
Slope Cap Mode — optional guardrail on each bar’s slope:
None — no cap.
ATR — cap scales with recent true range.
Percent — cap scales with price level.
Points — fixed absolute cap in price points.
ATR Length / Mult, Cap Percent, Cap Points — tune the chosen cap mode’s size.
UI Settings — show or hide the line, paint candles by slope, choose long and short colors.
How to read it
Up-slope baseline and green candles indicate a rising robust trend. Pullbacks that do not flip the slope often resolve in trend direction.
Down-slope baseline and red candles indicate a falling robust trend. Bounces against the slope are lower-probability until proven otherwise.
Flat or frequent flips suggest a range. Increase window length or decrease response if you want fewer whipsaws in sideways markets.
Use cases
Bias filter — only take longs when slope is up, shorts when slope is down. It is a simple way to gate faster setups.
Stop or trail reference — use the line as a trailing guide. If price closes beyond the line and the slope flips, consider reducing exposure.
Regime detector — widen the window on higher timeframes to define major up vs down regimes for asset rotation or risk toggles.
Noise control — enable a cap mode in very volatile symbols to retain the line’s continuity through event bars.
Tuning guidance
Quick swing trading — shorter window, higher response, optionally add a percent cap to keep it stable on large moves.
Position trading — longer window, moderate response. ATR cap tends to scale well across cycles.
Low-liquidity or gappy charts — prefer longer window and a points or ATR cap. That reduces jumpiness around discontinuities.
Alerts included
Theil-Sen Up Slope — baseline’s one-bar change crosses above zero.
Theil-Sen Down Slope — baseline’s one-bar change crosses below zero.
Strengths
Robust to outliers through median-based slope estimation.
Continuously advances with price rather than re-anchoring, which reduces lag at turns.
User-selectable slope caps to tame shock bars without over-smoothing everything.
Minimal visuals with optional candle painting for fast regime recognition.
Notes
This is a filter, not a trading system. It does not account for execution, spreads, or gaps. Pair it with entry logic, risk management, and higher-timeframe context if you plan to use it for decisions.

BTC CME Gap – detector & single signals# BTC CME Gap — Detector & Single Signals (Pine v5)
**What it does**
This indicator finds the **weekend gap** on **CME Bitcoin futures** and turns it into a clean, tradable object:
* Draws a **gap zone** (Friday close ↔ Monday open) as a right-extending box.
* Fires **one-time signals** per gap:
* **ENTER** – first touch of the gap zone by price.
* **FILL** – gap is considered filled when price tags **Friday’s close**.
It works on any BTC chart (spot or futures). The gap itself is calculated from **CME\:BTC1!** daily data.
---
## How it works
1. Pulls **daily** `open`/`close` from `CME:BTC1!` (`request.security`, no lookahead).
2. On **Monday**, compares Monday **open** with previous **Friday close**:
* If different → a **gap** exists.
3. Defines the zone:
* `gapTop = max(MonOpen, FriClose)`
* `gapBot = min(MonOpen, FriClose)`
4. Renders a box + boundary lines, **extending right** until price action resolves it.
5. Signals:
* **ENTER**: the first bar that **enters** the gap zone.
* **FILL**: first bar that **touches Friday close** (gap completion).
6. Each new Monday gap **replaces** the previous box and signals.
---
## Inputs
* **CME symbol** (default `CME:BTC1!`)
* **Gap timeframe** (default `D`)
* **Colors** for the box and edges
---
## Plot & Signals
* **Box** = visual gap zone (transparent fill, outlined).
* **ENTER** = triangle up below bar.
* **FILL** = triangle down above bar.
* Optional label prints **Top / Bottom / Fill** levels.
---
## Notes on behavior
* Uses `barmerge.lookahead_off` and daily aggregation, so the gap definition **does not repaint** once Monday’s daily bar is confirmed.
* Signals are **single-shot** per gap (no clutter).
* Works on any chart timeframe; the gap logic always references **CME daily**.
---
## Practical use
* Track obvious **“magnets”** for mean-reversion, stop-runs, or liquidity grabs.
* Combine with your higher-timeframe bias (e.g., **1D trend filter**) and execution on **4H/1H**.
* Typical outcomes: quick Monday fill, staged fill after partial rejection, or delayed fill during later consolidation.
---
## Customization ideas
* Add `alertcondition(enterSignal, …)` / `alertcondition(fillSignal, …)` for automation.
* Gate trades with trend filters (EMA/SMA, Kernel regression, ADX) or session tools (VWAP/POC).
* Persist multiple historical gap boxes if you want to track **unfilled** gaps.
---
**Credits**: Built for BTC CME weekend gaps; minimal, publication-ready visualization with single-event signals to keep charts clean.

Pasrsifal.RegressionTrendStateSummary
The Parsifal.Regression.Trend.State Indicator analyzes the leading coefficients of linear and quadratic regressions of price (against time). It also considers their first- and second-order changes. These features are aggregated into a Trend-State background, shown as a gradient color. In addition, the indicator generates fast and slow signals that can be used as potential entry- or exit triggers.
This tool is designed for advanced trend-following strategies, leveraging information from multiple trendline features.
Background
Trendlines provide insight into the state of a trend or the “trendiness” of a price process. While moving averages or pivot-based lines can serve as envelopes and breakout levels, they are often too lagging for swing traders, who need tools that adapt more closely to price swings, ideally using trendlines, around which the price process swings continuously.
Regression lines address this by cutting directly through the data, making them a natural anchor for observing how price winds around a central trendline within a chosen lookback period.
Regression Trendlines
• Linear Regression:
o Minimizes distance to all closing values over the lookback period.
o The slope represents the short-term linear trend.
o The change of slope indicates trend acceleration or deceleration.
o Linear regression lags during phases of rapid market shifts.
• Quadratic Regression:
o Fits a second-degree polynomial to minimize deviation from closing prices.
o The convexity term (leading coefficient) reflects curvature:
Positive convexity → accelerating uptrend or fading downtrend.
Negative convexity → accelerating downtrend or fading uptrend.
o The change of convexity detects early shifts in momentum and often reacts faster than slope features.
Features Extracted
The indicator evaluates six features:
• Linear features: slope, first derivative of slope, second derivative of slope.
• Quadratic features: convexity term, first derivative of the convexity term, second derivative of the convexity term.
• Linear features: capture broad, background trend behavior.
• Quadratic features: detect deviations, accelerations, and smaller-scale dynamics.
Quadratic terms generally react first to market changes, while linear terms provide stability and context.
Dynamics of Market Moves as seen by linear and quadratic regressions
• At the start of a rapid move:
The change of convexity reacts first, capturing the shift in dynamics before other features. The convexity term then follows, while linear slope features lag further behind. Because convexity measures deviation from linearity, it reflects accelerating momentum more effectively than slope.
• At the end of a rapid move:
Again, the change of convexity responds first to fading momentum, signaling the transition from above-linear to below-linear dynamics. Even while a strong trend persists, the change of convexity may flip sign early, offering a warning of weakening strength. The convexity term itself adjusts more slowly but may still turn before the price process does. Linear features lag the most, typically only flipping after price has already reversed, thereby smoothing out the rapid, more sensitive reactions of quadratic terms.
________________________________________
Parsifal Regression.Trend.State Method
1. Feature Mapping:
Each feature is mapped to a range between -1 and 1, preserving zero-crossings (critical for sign interpretation).
2. Aggregation:
A heuristic linear combination*) produces a background information value, visualized as a gradient color scale:
o Deep green → strong positive trend.
o Deep red → strong negative trend.
o Yellow → neutral or transitional states.
3. Signals:
o Fast signal (oscillator): ranges from -1 to 1, reflecting short-term trend state.
o Slow signal (smoothed): moving average of the fast signal.
o Their interactions (crossovers, zero-crossings) provide actionable trading triggers.
How to Use
The Trend-State background gradient provides intuitive visual feedback on the aggregated regression features (slope, convexity, and their changes). Because these features reflect not only current trend strength but also their acceleration or deceleration, the color transitions help anticipate evolving market states:
• Solid Green: All features near their highs. Indicates a strong, accelerating uptrend. May also reflect explosive or hyperbolic upside moves (including gaps).
• Fading Solid Green: A recently strong uptrend is losing momentum. Price may shift into a slower uptrend, consolidation, or even a reversal.
• Fading Green → Yellow: Often appears as a dirty yellow or a rapidly mixing pattern of green and red. Signals that the uptrend is weakening toward neutrality or beginning to turn negative.
• Yellow → Deepening Red: Two possible scenarios:
o Coming from a strong uptrend → suggests a sharp fade, though the trend may still technically be up.
o Coming from a weaker uptrend or sideways market → suggests the start of an accelerating downtrend.
• Solid Red: All features near their lows. Indicates a strong, accelerating downtrend. May also reflect crash-type conditions or downside gaps.
• Fading Solid Red: A recently strong downtrend is losing strength. Market may move into a slower decline, consolidation, or early reversal upward.
• Fading Red → Yellow : The downtrend is weakening toward neutral, with potential for a bullish shift.
• Yellow → Increasing Green: Two possible scenarios:
o Coming from a strong downtrend, it reflects a sharp fade of bearish momentum, though the market may still technically be trending down.
o Coming from a weaker downtrend or sideways movement, it suggests the start of an accelerating uptrend.
Note: Market evolution does not always follow this neat “color cycle.” It may jump between states, skip stages, or reverse abruptly depending on market conditions. This makes the background coloring particularly valuable as a contextual map of current and evolving price dynamics.
Signal Crossovers:
Although the fast signal is very similar (but not identical) to the background coloring, it provides a numerical representation indicating a bullish interpretation for rising values and bearish for falling.
o High-confidence entries:
Fast signal rising from < -0.7 and crossing above the slow signal → potential long entry.
Fast signal falling from > +0.7 and crossing below the slow signal → potential short entry.
o Low-confidence entries:
Crossovers near zero may still provide a valid trigger but may be noisy and should be confirmed with other signals.
o Zero-crossings:
Indicate broader state changes, useful for conservative positioning or option strategies. For confirmation of a Fast signal 0-crossing, wait for the Slow signal to cross as well.
________________________________________
*) Note on Aggregation
While the indicator currently uses a heuristic linear combination of features, alternatives such as Principal Component Analysis (PCA) could provide a more formal aggregation. However, while in the absence of matrix algebra, the required eigenvalue decomposition can be approximated, its computational expense does not justify the marginal higher insight in this case. The current heuristic approach offers a practical balance of clarity, speed, and accuracy.

XAUUSD 1H – FVG Buy/Sell Signals XAUUSD 1H – Fair Value Gap (FVG) Buy/Sell Signals (No Boxes)
What it is:
A clean, signal-only indicator for Gold on the 1-hour chart. It detects 3-bar Fair Value Gaps, waits for a deep retest, then confirms with strong candle structure + trend + ADX before printing a BUY/SELL arrow. No rectangles or clutter—just selective, high-quality signals.
Why it works:
Instead of chasing breakouts, the script hunts for imbalances (FVGs) where price often returns to “fair value.” It only fires when:
price revisits the gap by a configurable depth,
the candle closes beyond the far edge with a small buffer,
the candle body is ≥ ATR × K (confirms intent),
the broader trend (EMA-50/EMA-200) agrees, and
ADX (Wilder, manual) shows sufficient strength.
Key features
✅ Signal-only: arrows/labels—no boxes on chart.
✅ Deep retest logic (percentage of zone), not just a touch.
✅ Strong close filter (edge + buffer) + ATR body filter.
✅ Trend filter (EMA-50 vs EMA-200) to keep trades with the regime.
✅ ADX strength to avoid chop.
✅ One signal per zone (optional “delete on use”).
✅ Alerts for both BUY and SELL.
✅ Built for Pine v6, non-repainting logic on bar close.
Inputs you can tune
Min FVG size (pts) – ignore tiny gaps.
Retest depth (%) – how deep price must come back into the gap.
Close buffer (pts) – extra confirmation beyond zone edge.
Min body ≥ ATR× – candle strength requirement.
Min ADX – trend strength threshold.
Expire after X bars – keep zones fresh.
Delete zone after signal – true = one-shot signals.
How I use it
Apply to XAUUSD 1H.
Keep default filters for selective signals.
For more setups, lower Min FVG size or ADX and reduce retest depth; for stricter signals, do the opposite.
Combine with S/R or session timing (London/NY) for added confluence.
Notes
Signals are generated on bar close.
Designed for clarity and discipline—fewer, cleaner arrows over constant noise.
Works on other symbols/timeframes, but tuned for Gold 1H.
Tags: #XAUUSD #Gold #FVG #SmartMoney #1H #TrendFollowing #ADX #ATR #PineV6 #TradingView

Rube Goldberg Top/Bottom Finder [theUltimator5]This is what I call the Rube Goldberg Top and Bottom Finder. It is an overly complex method of plotting a simple buy or sell label on a chart.
I utilize several standard TA techniques along with several of my own to try and locate ideal Buy/Sell conditions. I came up with the name because there are way too many conditional variables to come up with a single buy or sell condition, when most standard indicators use simple crossovers or levels.
There are two unique triggers that are calculated using completely independent techniques. If both triggers turn true within a small timeframe between each other, the buy/sell trigger turns true and plots a "buy" or "sell" label on the chart.
This indicator was designed to be fully functioning out of the box and can be customized only if the user wishes to. It is effective on all timeframes, but longer timeframes (daily +) may require signal length adjustment for best results.
imgur.com
The signals used in the leading trigger are as follows:
(1)RSI
The user can select among any of the following moving averages (base is EMA) (#3) , and have an RSI generated at a user defined length (base is 14). (#4)
SMA, EMA, DEMA, TEMA, WMA, VWMA, SMMA, HMA, LSMA, ALMA
The user can select whether or not the RSI is filtered with the following options:
None, Kalman, Double EMA, ALMA
The filter conditions are hard coded to minimize the amount of selections that the user is required to make to reduce the user interface complexity.
The user can define overbought (base 70) and oversold (base 30) conditions. (#2)
When the RSI crosses above or below the threshold values, the plot will turn red. This creates condition 1 of the leading trigger.
(2) ADX and DI
This portion of the indicator is a derivative of my ADX Divergence and Gap Monitor indicator.
This technique looks at the ADX value as well as for spikes in either +DI or -DI for large divergences. When the ADX reaches a certain threshold and also outpaces a preset ADX moving average, this creates condition 2 of the leading trigger.
There is an additional built-in functionality in this portion of the indicator that looks for gaps. It triggers when the ADX is below a certain threshold value and either the +DI or -DI spike above a certain threshold value, indicating a sudden gap in price after a period of low volatility.
The user can set whether or nor to show when a gap appears on the chart or as a label on the plot below the chart (disabled by default) . If the user chooses to overlay gaps on the chart, it creates a horizontal fill showing the starting point of the gap. The theory here is that the price will return at some point in the near future to the starting point of the gap.
imgur.com
(3) DI based Multi-Symbol reference and divergence
Part of the script computes both the +DI (positive directional index) and -DI (negative directional index) for the currently selected chart symbol and three reference symbols.
The averaged directional move of the reference symbols are compared to the current ticker on your chart and if the divergence exceeds a certain threshold, then the third condition of the trigger is met.
The components that are referenced are based on what stock/chart you are looking at. The script automatically detects if you are looking at a crypto, and uses a user selectable toggle between Large Cap or Small Cap. (#1) The threshold levels are determined by the asset type and market cap.
The leading trigger highlights under several conditions:
1) All (3) portions of the trigger result in true simultaneously
OR
2) Any of triggers 2 or 3 reach a certain threshold that indicates extreme market/price divergence as well as trigger 1 being overbought or oversold.
AND
3) If the trigger didn't highlight
For the lagging part of the trigger:
The lagging trigger is used as a confirmation after the leading trigger to indicate a possible optimized entry/exit point. It can also be used by itself, as well as the leading indicator.
The lagging indicator utilizes the parabolic Stop And Reverse (SAR). It utilizes the RSI length that is defined in portion 1 of the leading trigger as well as the overbought and oversold thresholds. I have found excellent results in catching reversals because it catches rate-of-change events rather than price reversals alone.
imgur.com
When both the leading triggers FOLLOWED BY the lagging trigger result in true within a user defined timeframe, then the buy or sell trigger results in true, plotting a label on the chart.
All portions of the leading and lagging indicators can be toggled on or off, but most of them are toggled off by default in order to reduce noise on the plot.
imgur.com
The leading, lagging, and buy/sell triggers each have built-in alerts that can be toggled on or off in the alert menu.
I have an optional built-in toggle to show green or red dots on the RSI line using two separate RSI lengths that are amplified and plot based on RSI divergence and strength. This can be used as a visual confirmation (or rejection) against the chart overlay plots.
imgur.com
This indicator is not a strategy, so there are no built-in exits or stop losses.
