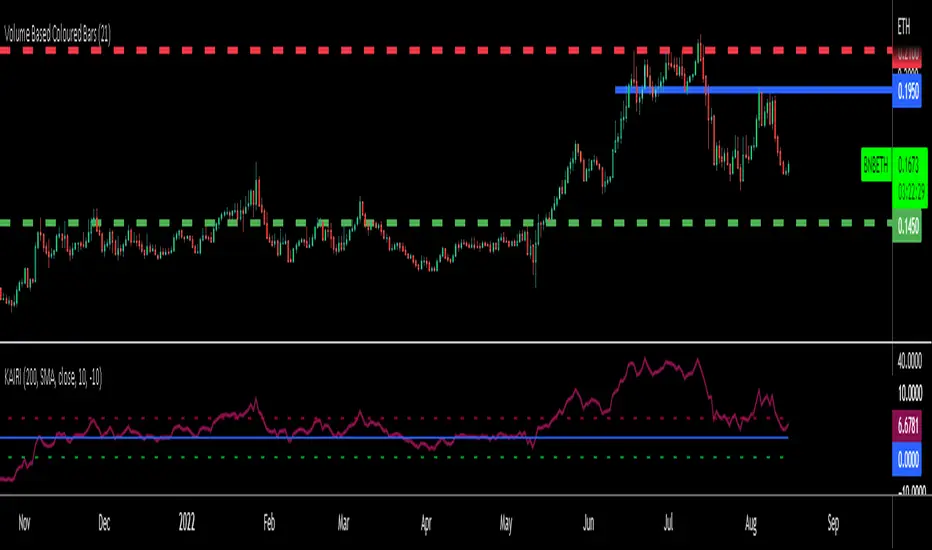
KAIRI RELATIVE INDEXAn old but gold Japanese indicator for Mean Reverting strategies and ideal for Pairs Trading...
The Kairi Relative Index measures the distance between closing prices and a Moving Average in percent value (generally SMA).
Extreme reading in the KRI are considered buy and sell signals.
Extreme readings will vary by asset, with more volatile assets reaching much higher and lower extremes that more sedate assets.
The KRI is not an accurate timing signal, and therefore, should be combined with other forms of analysis to generate trade signals.
You can calculate percent difference between the price and 10 different types of Moving Averages in this version of KAIRI as:
SMA : Simple Moving Average
EMA : Exponential Moving Average
WMA : Weighted Moving Average
TMA : Triangular Moving Average
VAR : Variable Index Dynamic Moving Average a.k.a. VIDYA
WWMA : Welles Wilder's Moving Average
ZLEMA : Zero Lag Exponential Moving Average
TSF : True Strength Force
HULL : Hull Moving Average
VWMA: Volume Veighted Moving Average
Personal advice: try using bigger length of Moving Averages like 50-100-200 for pairs and mean reversion strategies
"index"に関するスクリプトを検索
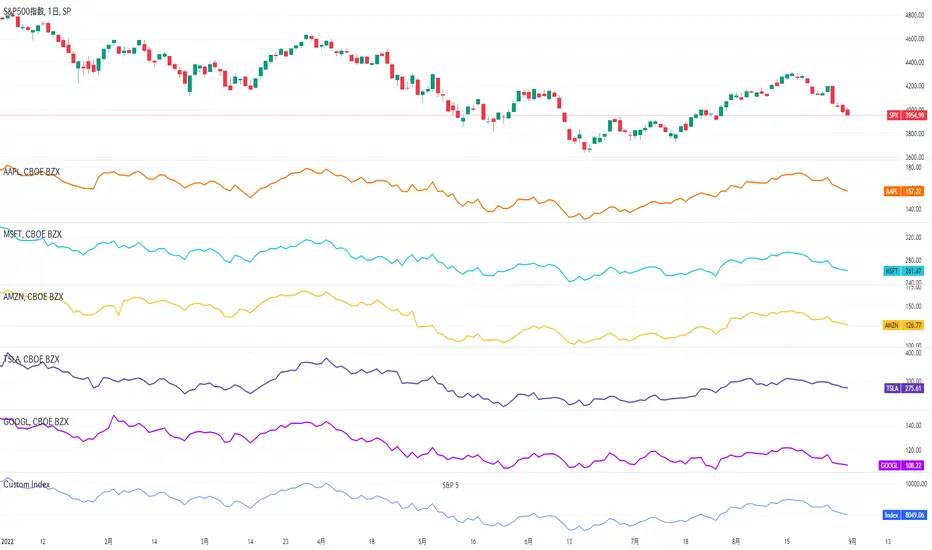
Custom IndexCreate your own stock index with up to 20 tickers!
The weight of the index can be selected from market capitalization and equal weight.
You can easily see how your favorite stocks are performing.
In addition, moving average lines (10SMA, 20SMA, 50SMA, 100SMA, 150SMA, 200SMA) can also be displayed as an option.
----以下日本語
最大20銘柄を用いて独自の株価指数を作成できます!
指数のウェイトは時価総額、イコールウェイトから選択でき、
お気に入りの銘柄群がどのようなパフォーマンスなのか簡単に分かります。
また、移動平均線(10SMA、20SMA、50SMA、100SMA、150SMA、200SMA)もオプションで表示可能です。
TSI + DivergencesTrue Strength Indicator (TSI) + Divergences + Alerts + Lookback periods.
This version of the True Strength Indicator adds the following 3 additional features to the stock TSI by Tradingview:
- Optional divergence lines drawn directly onto the oscillator.
- Configurable alerts to notify you when divergences occur.
- Configurable lookback periods to fine tune the divergences drawn in order to suit different trading styles and timeframes.
This indicator adds additional features onto the stock TSI by Tradingview, whose core calculations remain unchanged. Namely the configurable option to automatically, quickly and clearly draw divergence lines onto the oscillator for you as they occur, with minimal delay. It also has the addition of unique alerts, so you can be notified when divergences occur without spending all day watching the charts. Furthermore, this version of the TSI comes with configurable lookback periods, which can be configured in order to adjust the sensitivity of the divergences, in order to suit shorter or higher timeframe trading approaches.
The True Strength Indicator
Tradingview describes the True Strength Indicator as follows:
“The True Strength Index (TSI) is a momentum oscillator that ranges between limits of -100 and +100 and has a base value of 0. Momentum is positive when the oscillator is positive (pointing to a bullish market bias) and vice versa. It was developed by William Blau and consists of 2 lines: the index line and an exponential moving average of the TSI, called the signal line. Traders may look for any of the following 5 types of conditions: overbought, oversold, centerline crossover, divergence and signal line crossover. The indicator is often used in combination with other signals..”
What are divergences?
Divergence is when the price of an asset is moving in the opposite direction of a technical indicator, such as an oscillator, or is moving contrary to other data. Divergence warns that the current price trend may be weakening, and in some cases may lead to the price changing direction.
There are 4 main types of divergence, which are split into 2 categories;
regular divergences and hidden divergences. Regular divergences indicate possible trend reversals, and hidden divergences indicate possible trend continuation.
Regular bullish divergence: An indication of a potential trend reversal, from the current downtrend, to an uptrend.
Regular bearish divergence: An indication of a potential trend reversal, from the current uptrend, to a downtrend.
Hidden bullish divergence: An indication of a potential uptrend continuation.
Hidden bearish divergence: An indication of a potential downtrend continuation.
Setting alerts.
With this indicator you can set alerts to notify you when any/all of the above types of divergences occur, on any chart timeframe you choose.
Configurable lookback values.
You can adjust the default lookback values to suit your prefered trading style and timeframe. If you like to trade a shorter time frame, lowering the default lookback values will make the divergences drawn more sensitive to short term price action.
How do traders use divergences in their trading?
A divergence is considered a leading indicator in technical analysis, meaning it has the ability to indicate a potential price move in the short term future.
Hidden bullish and hidden bearish divergences, which indicate a potential continuation of the current trend are sometimes considered a good place for traders to begin, since trend continuation occurs more frequently than reversals, or trend changes.
When trading regular bullish divergences and regular bearish divergences, which are indications of a trend reversal, the probability of it doing so may increase when these occur at a strong support or resistance level. A common mistake new traders make is to get into a regular divergence trade too early, assuming it will immediately reverse, but these can continue to form for some time before the trend eventually changes, by using forms of support or resistance as an added confluence, such as when price reaches a moving average, the success rate when trading these patterns may increase.
Typically, traders will manually draw lines across the swing highs and swing lows of both the price chart and the oscillator to see whether they appear to present a divergence, this indicator will draw them for you, quickly and clearly, and can notify you when they occur.
Disclaimer : This script includes code from the stock TSI by Tradingview as well as the RSI divergence indicator.

Color Library: Rainbow Index & Simplest Return ColorLibrary "Color Library!"
To help with large projects that need colors!
If you guys make the library bigger, share it so we can all have tons of colors!
2 Functions
Uppercase and Lowercase, because why not?
import library as color
1.) color.this("Brown") // or color.this("brown") both work
2.) color.rainbow(1) //Returns first index of Rainbow
this(x)
TODO: color.this(Brown)
Parameters:
x : TODO: String Color Name
Returns: TODO: Color
rainbow(x)
TODO: Return Rainbow Index
Parameters:
x : TODO: Number is index of Rainbow :)
Returns: TODO: Color

Volatility Quality Index w/ Pips Filtering [Loxx]Volatility Quality Index w/ Pips Filtering is a Volatility Quality Index indicator with various smoothing types and pips filtering
What is the Volatility Quality Index (VQI)?
The idea behind the volatility quality index is to point out the difference between bad and good volatility in order to identify better trade opportunities in the market. This forex indicator works using the True Range algorithm in combination with the open, close, high and low prices.
Included
7 different types of smoothing average
Alerts (coming in future update, stay tuned)
Signals (coming in future update, stay tuned)

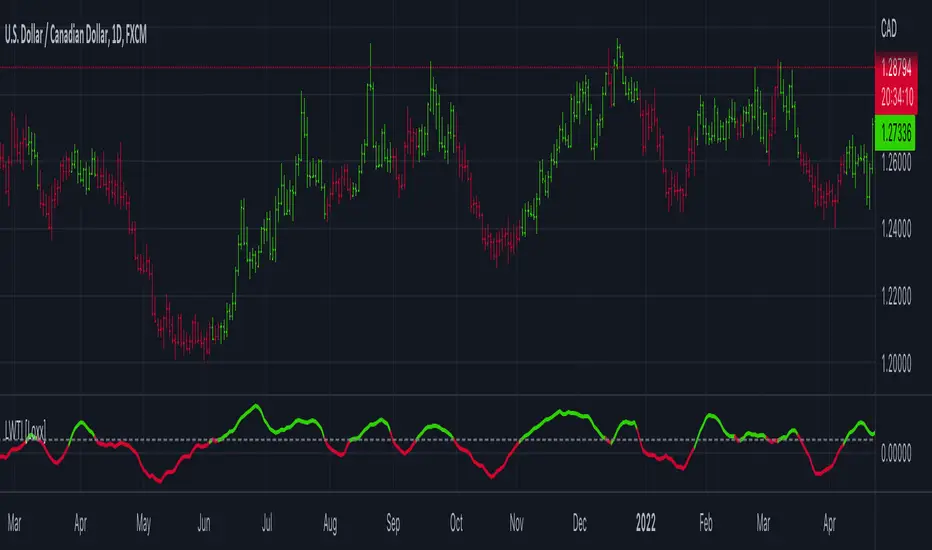
Larry Williams Large Trade Index (LWTI) [Loxx]Larry Williams Large Trade Index (LWTI) is an indicatory by Larry Williams as explained in his book "Trade Stocks and Commodities with the Insiders: Secrets of the COT Report". I've added optional smoothing if you wish to smooth the output.
What is the Larry Williams Large Trade Index (LWTI)?
The original concept was specifically based on Trader (or Market) Sentiment and predicting market reversals. It's calculated as follows:
MovingAvg(Close - Close , bars used in average)/MovingAvg(Range,bars used in average)*50 + 50
Included
Bar coloring
Signals
Alerts
Larry Williams Proxy Index (LWPI) [Loxx]Larry Williams Proxy Index (LWPI) is an indicatory by Larry Williams as explained in his book "Trade Stocks and Commodities with the Insiders: Secrets of the COT Report", pages 129-135. This is an INVERSE indicator, so follow the signals and colors to understand what it's doing. I've added optional smoothing if you wish to smooth the output.
What is the Larry Williams Proxy Index (LWPI)?
The original concept was specifically based on Trader (or Market) Sentiment and predicting market reversals. It's calculated as follows:
MovingAvg(Open-Close, bars used in average)/MovingAvg(Range, bars used in average)*50+50
Included
Bar coloring
Signals
Alerts

Range Bound Channel Index (RBCI) w/ Expanded Source Types [Loxx]Range Bound Channel Index (RBCI) w/ Expanded Source Types is a reversal and trend indicator. This version includes Bollinger bands to show trend exhaustion
What is Range Bound Channel Index (RBCI)?
Range Bound Channel Index (RBCI) is calculated by using a channel (bandwidth) filter (CF). Channel filter simultaneously fulfills two functions: removes low frequent trend formed by low frequent components of the spectrum; removes high frequency noise formed by the high frequent components of the spectrum.
When RBCI approaches its local maximum the prices approach upper border of the trading channel and when RBCI approach its local minimum the prices approach the lower border of the trading corridor.
Included:
-Toggle on/off bar coloring
-Loxx's Expanded Source Types

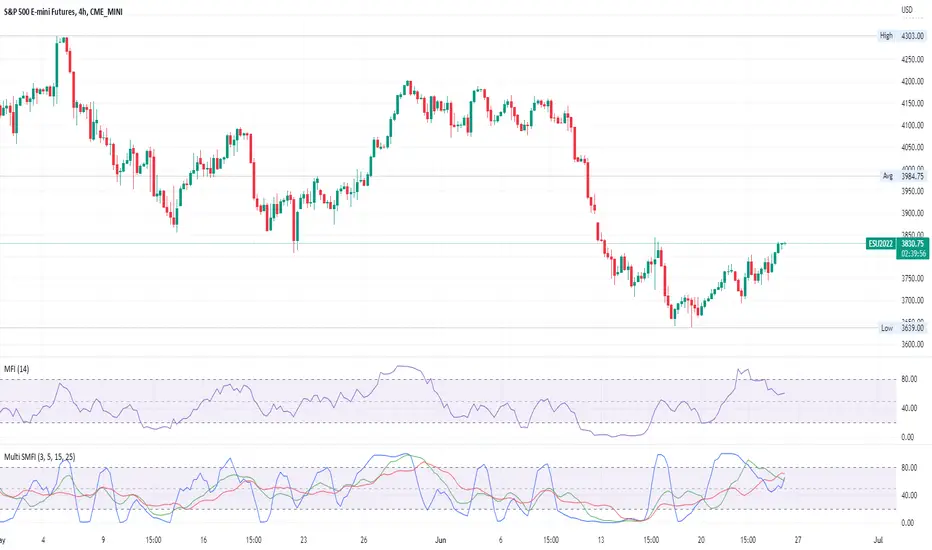
Multi Perdiod Smoothed Money Flow IndexUsing the Built in function of the Money Flow Index, except it plots three different smoothed lengths of the MFI.
(The Money Flow Index (MFI) is a technical indicator that generates overbought or oversold signals using both prices and volume data.)
This indicator plots three smoothed lines of the Money Flow Index, each with different period length. The idea here is that having multiple signals given from analysing different period lengths should minimise the amount of false signals taken by the MFI.
Idea taken from the existence of the same styled indicator for Stochastics.
Ehlers Adaptive Relative Strength Index (RSI) [Loxx]Ehlers Adaptive Relative Strength Index (RSI) is an implementation of RSI using Ehlers Autocorrelation Periodogram Algorithm to derive the length input for RSI. Other implementations of Ehers Adaptive RSI rely on the inferior Hilbert Transformer derive the dominant cycle.
In his book "Cycle Analytics for Traders Advanced Technical Trading Concepts", John F. Ehlers describes an implementation for Adaptive Relative Strength Index in order to solve for varying length inputs into the classic RSI equation.
What is an adaptive cycle, and what is the Autocorrelation Periodogram Algorithm?
From his Ehlers' book mentioned above, page 135:
"Adaptive filters can have several different meanings. For example, Perry Kaufman’s adaptive moving average (KAMA) and Tushar Chande’s variable index dynamic average (VIDYA) adapt to changes in volatility. By definition, these filters are reactive to price changes, and therefore they close the barn door after the horse is gone.The adaptive filters discussed in this chapter are the familiar Stochastic, relative strength index (RSI), commodity channel index (CCI), and band-pass filter.The key parameter in each case is the look-back period used to calculate the indicator.This look-back period is commonly a fixed value. However, since the measured cycle period is changing, as we have seen in previous chapters, it makes sense to adapt these indicators to the measured cycle period. When tradable market cycles are observed, they tend to persist for a short while.Therefore, by tuning the indicators to the measure cycle period they are optimized for current conditions and can even have predictive characteristics.
The dominant cycle period is measured using the autocorrelation periodogram algorithm. That dominant cycle dynamically sets the look-back period for the indicators. I employ my own streamlined computation for the indicators that provide smoother and easier to interpret outputs than traditional methods. Further, the indicator codes have been modified to remove the effects of spectral dilation.This basically creates a whole new set of indicators for your trading arsenal."
What is Adaptive RSI?
From his Ehlers' book mentioned above, page 137:
"The adaptive RSI starts with the computation of the dominant cycle using the autocorrelation periodogram approach. Since the objective is to use only those frequency components passed by the roofing filter, the variable "filt" is used as a data input rather than closing prices. Rather than independently taking the averages of the numerator and denominator, I chose to perform smoothing on the ratio using the SuperSmoother filter. The coefficients for the SuperSmoother filters have previously been computed in the dominant cycle measurement part of the code."
Happy trading!

Esqvair's Relative Strength IndexThe Indicator
Esqvair's Relative Strength Index is the another modification of very popular Relative Strength Index by J. Welles Wilder
The Modification
This version uses de-lagged price as source, de-lagging price improves performance of the indicator.
How to use
The ways of usage are same as original Relative Strength Index that means you can use it as overbought and oversold indicator or as divergence indicator.

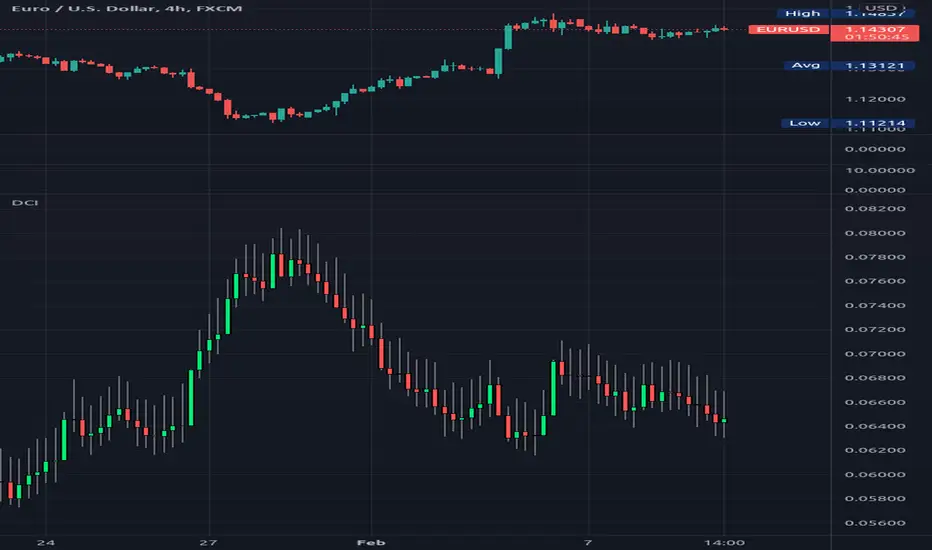
Volatility Trigger IndexThe script allows to assess the volatility of an asset.
It works by calculating the rate of change and the standard deviation.
The index is useful to determine the lowest volatility periods (could be useful to look strategies) and also it determine the highest volatility periods (maybe for exits or partial closes).
It has 3 iputs:
Lenght.
Low volatility value.
High volatility value.
The low and high values are set after a visual inspection. The values changes in each time frame. Usually when the timeframe is higher the value of the index is higher as well. So the low and high levels must be changed after each time frame set.
As an idea could be used in combination with any moving average to determine the market direction and the index used as a trigger.

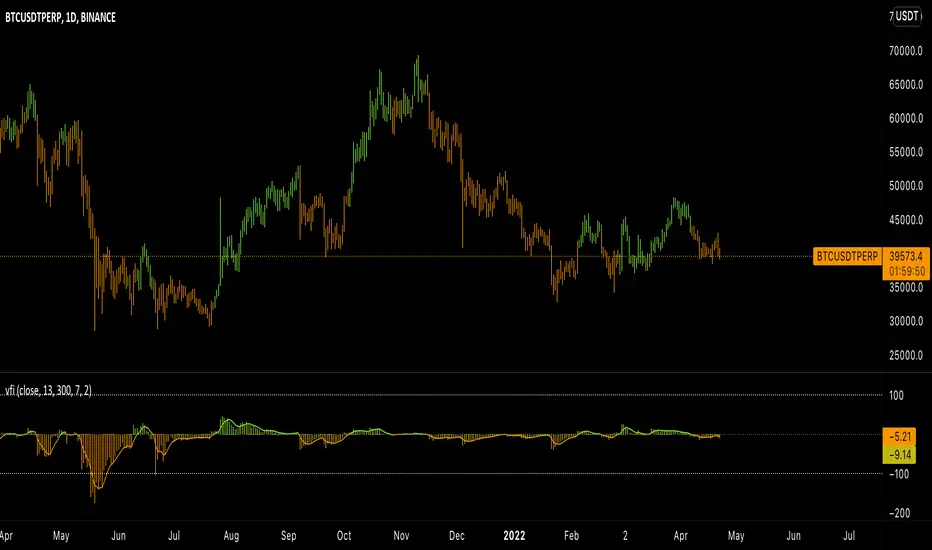
Viral Force IndexBased on the Elder Force Index (EFI) indicator, the Viral Force Index (VFI) attempts to normalize the original indicator by plotting EFI on the interval ]-100, 100 [.
VFI comes with a bar coloring feature, allowing users to get an idea of the current value of the indicator without having to look away from the chart.
Additionally, the linear regression line provides a simple way to filter out the noise with little to no additional 'lag'.
License tl;dr: Don't sell it, or distribute it without permission, and you'll be fine.
If you find a bug, or you have feedback, feel free to leave a comment.
Kasper indexSimple index built from 6 coins to compare price development
Coins used CRV, ADA, DASH, SOL, DOGE and XTZ from BINANCE exchange
Price action normalized on a scale 0-100 for comparison
Selectables ->
1. Time period
2. Smoothness (chart lines)
3. Switch on/off individual coins under display tab
The index line in fat lime green, individual coins in separate colors and 50% transparency.

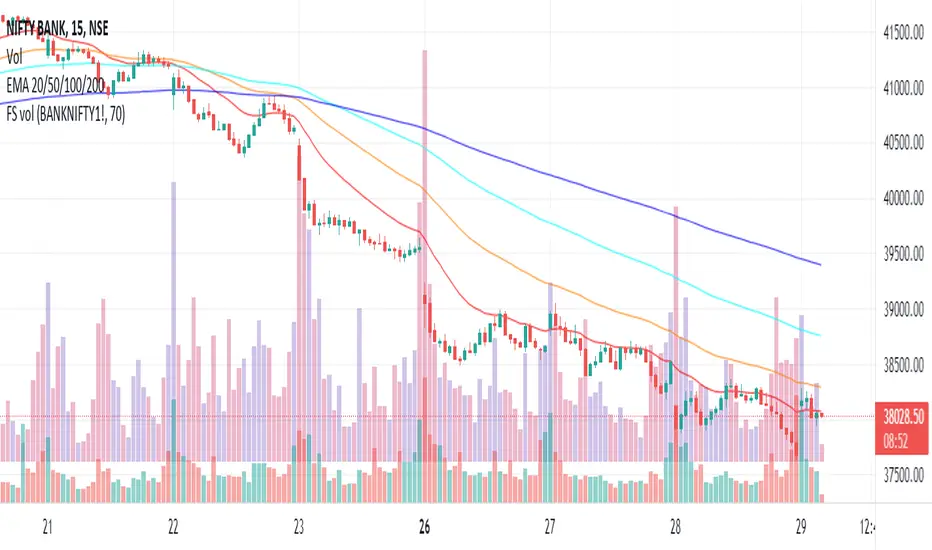
Plot futures volumes with indexMost of the times, F&O traders like to draw their own trendlines or mark other levels on the underlying instrument where volumes of the underlying is a key parameter. When such an instrument is a non-tradeable index, then one needs to switch to the futures chart for volumes. This script plots the volumes from futures on the underlying index so that traders don't need to switch charts just for futures volumes! Hope it is useful to some. Cheers!
High Low Index SPY Top 40Modification from original code for "High Low Index" by © LonesomeTheBlue
- Made modification specifically for Top 40 AMEX:SPY holdings
- Added Market sentiment histogram (Total count green vs red), and SMA line for it
- Added arrows for peaks and dips on High Low Index and Market Sentiment MA
Idea behind this indicator is that SPY should follow the overall sentiment of its top holdings. I believe this bring great value to SPY traders.
Enjoy~!

[RS]Dollar Composite IndexExperimental:
a composite of the dollar index with equal weights.
this is a repost of:
www.tradingview.com
Didi index alertsThis is a script that helps traders automate the Needles hunt, by adding alerts to the Didi Index indicator. It also alerts for fake Long and Short signals.
To use it add an alert (alt+A) to the indicator.
Available alerts are:
Long Needles
Short Needles
Fake Short
Fake Long
Use the parameters "Minimum and Maximum needle distances" in the config window to calibrate the desired precision of a needle signal.
It is highly recommended that this indicator is used in conjunction with a trend indicator such as DMI, and with a volatility indicator as Bollinger Bands to filter the wrong signals.
-----------------
Esse script ajuda os caçadores de agulhadas a automoatizar a procura de sinais no Didi Index, pois inclui alertas que avisam quando uma agulhada acontece. Também inclui alertas para compra e venda falsas.
Para usar, basta criar um alerta (alt+A) no indicador.
Inclui os alertas:
Long Needles (Agulhada de Compra)
Short Needles (Agulhada de Venda)
Fake Short (Venda falsa)
Fake Long (Compra falsa)
Use os parametros "Minimum and Maximum needle distances" na janela de configuração do indicador para calibrar a precisão das agulhadas. Mais abaixo explico como as agulhadas são detectadas.
É altamente recomendado se use em conjunto com outros indicadores de tendencia (ex. DMI) e volatilidade (ex. Bollinger bands) para filtrar os sinais fora de contexto.
----------------
Sobre o cálculo do indicador
As agulhadas surgem quando os sinas de alerta e a confirmação do trade, dados pelas médias móveis no Didi Index, acontecem ao mesmo tempo ou quase simultanemante. Há também o famoso Beijo da Mulher Aranha, a Agulhada Queijo Minas e outras situações onde as médias não necessariamente se cruzam, mas as agulhadas acontecem.
Para resolver o problema, o cálculo da agulhadas usa além dos cruzamentos das médias, cálculos de trigonometria para determinar quando as médias se afastam simultaneamente da média normal (a linha reta do indicador).
Esse cálculo de trigonometria projeta retroativamente as médias e determina em quantas barras passadas o cruzamento aconteceu (ou teria acontecido). O alerta é disparado quando as projeções estão entre esses parametros "Minimum and Maximum needle distances". A precisão da agulhada é determinada por esses parametros que são configuráveis. As linhas pontillhadas amarelas no gráfico acima exemplificam as projeções.

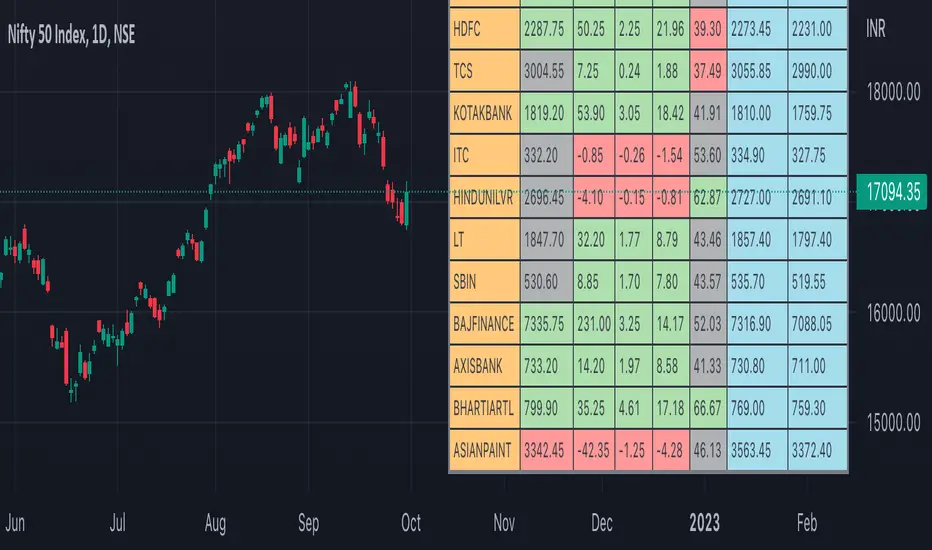
Nifty50 Participants - Top 25Nifty50 Index is calculated based on the movements of its participants. Every time you think of why is Index going up/down, who is actively dragging the index either ways, this Indicator gives you answer for the same in realtime!
This indicator will help you in pre-planning your trades based on the movements shown by different stocks of various sectors in Index calculation.
RSI column is an add-on to the participation table which will help you in getting RSI values of different stocks of Nifty 50 at a glance. You will see values getting updated in realtime in live market.
Checkout for customisations in indicator settings.
Note:
1. Participants present in this indicator and their participation percentage is taken from the official NSE website.
2. Table shows Top 25 participants by default. If you want to see less than 25 rows, you can update the input via indicator settings.
Feel free to contribute/comment changes if any! Comment in case of any suggestions :)
- Published by Soham Dixit
Fear and Greed Intraday IndexThis script uses all of the sub-components of my 'Fear and Greed Index' which can be used on intraday timeframes. Most of the components of this script are based on the popular fear and greed index website and are briefly described in the code comments.
Several of the subcomponents have been recalculated to use RSIs instead of being compared to moving averages, which means as opposed to being used a contrarian timing indicator as the daily timeframe Fear and Greed Index is, this indicator now may potentially be used more like a momentum indicator.
It's up to you!
Enjoy!

EMA Index Cross by Hassonya
While the indicator is working on any stock chart, it shows the two ema average breakdown/breakup of the index or any other stock with an arrow. In this way, you will be able to follow the ema intersections of the index chart while working on a normal stock chart.
I will add other moving average options if you like it.
I hope you will be satisfied using it.
TURKISH
------------
Gösterge, herhangi bir hisse senedi grafiği üzerinde çalışırken, endeksin veya başka bir hisse senedinin iki ema ortalama dağılımını/dökülmesini bir okla gösterir.
Bu sayede normal bir hisse senedi grafiği üzerinde çalışırken endeks grafiğinin ema kesişimlerini takip edebileceksiniz.
Eğer beğenirseniz başka ortalama seçenekleri de ekleyeceğim.
Güle güle kullanın.

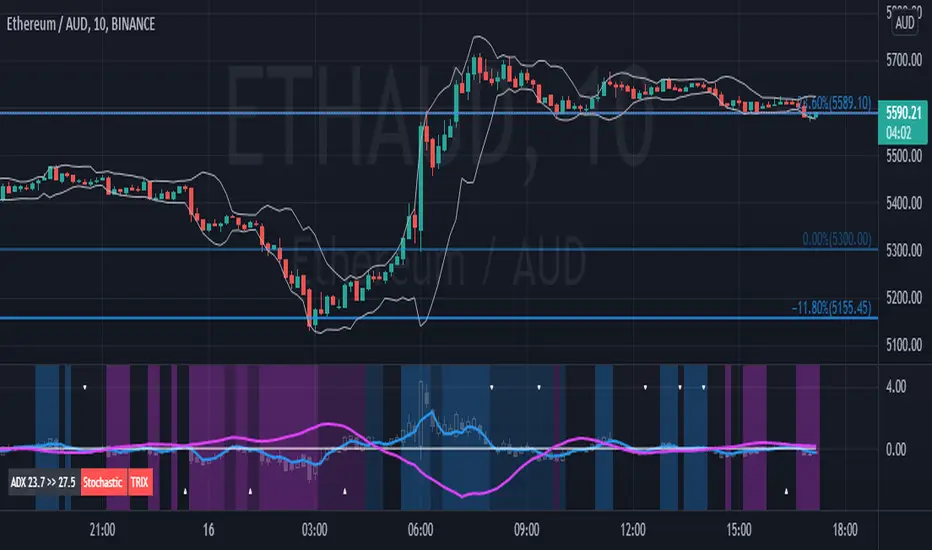
Didi Index PlusAbout this indicator (translation to Portuguese on the second half of the description):
The indicator follows the way Didi Aguiar teaches his trading system. Didi Aguiar is an old school Brazilian trader with over 40 years experience, who created the Didi Index and the famous agulhadas - or how I like to say in English: threads in the needle, an explosive price movement.
This version of the Didi Index adds what matters about DMI/ADX, Stochastic and TRIX to the regular Didi Index indicator.
The lines indicate alert and confirmations:
BLUE line crossing UP white line - BUY alert
PINK line crossing DOWN white line - BUY confirmation
Simultaneous Buy Alert and Confirmation = BUY AGULHADA.
BLUE line crossing DOWN white line - SHORT alert
PINK line crossing UP white line - SHORT confirmation
Simultaneous Short Alert and Confirmation = SHORT AGULHADA.
The background color changes according to the way Didi Aguiar reads the DMI and ADX.
Blue = Up trend
Bright Blue = Accelerating up trend
Purple = Down trend
Bright Purple = Accelerating down trend
Change from bright to dark color = ADX's bounce.
No coloured background = no trend.
The triangles on the top and bottom of the chart are the exit indicators.
They appear every time the Fast Stochastic and TRIX are in agreement:
Triangle on TOP of the chart means to EXIT LONG position.
- TRIX is selling and Stochastic just gave the sell signal; OR
- Stochastic is selling and TRIX just gave the sell signal
Triangle on BOTTOM of the chart means to EXIT SHORT position.
- TRIX is buying and Stochastic just gave the buy signal; OR
- Stochastic is buying and TRIX just gave the buy signal
Use this indicator with Bollinger Bands or other volatility indicator.
Not recommended for color-blind people :)
-----------------------------------------
Esse indicador segue a maneira que Didi Aguiar ensina o seu "trading system". Didi Aguiar é um trader velha-guarda com mais de 40 anos de experiência, que criou o Didi Index e as famosas Agulhadas, um movimento the preço explosivo.
Essa versão do Didi Index inclui o que interessa sobre outros três indicadores que o Didi usa em seu sistema: DMI/ADX, TRIX, e Estocástico.
As linhas indicam alerta e confirmação para o trade:
Linha AZUL cruzando a linha branca de BAIXO PARA CIMA - Alerta de compra
Linha ROSA cruzando a linha branca de CIMA PARA BAIXO - Confirmação de compra
ALERTA e CONFIRMAÇÃO de compra simultaneos = AGULHADA DE COMPRA
Linha AZUL cruzando a linha branca de CIMA PARA BAIXO - Alerta de venda
Linha ROSA cruzando a linha branca de BAIXO PARA CIMA - Confirmação de venda
ALERTA e CONFIRMAÇÃO de cenda simultaneos = AGULHADA DE VENDA
A cor do fundo muda de acordo com a maneira que o Didi lê o DMI e ADX
Fundo AZUL = Tendencia de compra
Fundo ROXO = Tendencia de venda
Cor mais saturada (vibrante) = Tendencia acelerante
Passou de cor mais clara para mais escura = Kick do ADX
Sem coloração de fundo = Sem tendencia
Os triângulos brancos na parte de cima e de baixo do indicador sinalizam a saida do trade.
Aparecem todas a vezes que o Etocastico e o TRIX ficam de acordo.
Triangulo na parte de CIMA sinaliza a SAÍDA da COMPRA.
- TRIX está vendido e o Estocástico acabou de vender; OU
- Estocástico está vendido e o TRIX acabou de vender
Triangulo na parte de BAIXO sinaliza a SAÍDA da VENDA.
- TRIX está comprado e o Estocástico acabou de comprar; OU
- Estocástico está comprado e o TRIX acabou de comprar
Use esse indicador em conjunto com as Bandas de Bollinger ou outro indicador de volatilidade.
Não é indicado para pessoas que sofrem de daltonismo :)
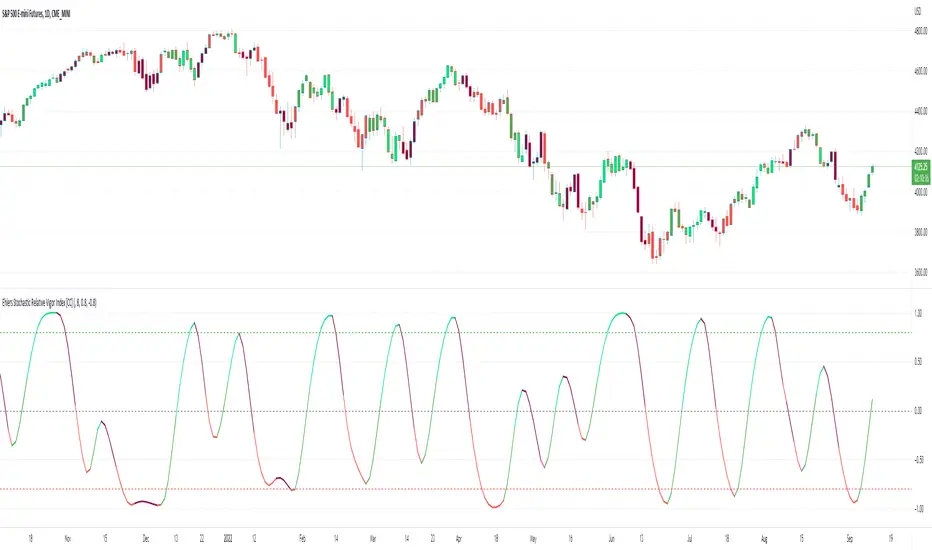
Ehlers Stochastic Relative Vigor Index [CC]The Stochastic Relative Vigor Index was created by John Ehlers (Cybernetic Analysis For Stocks And Futures pgs 84-89) and this of course is very similar to the Ehlers Fisher Stochastic Relative Vigor Index I just published. In hindsight I probably should have published this one first but just like with the other script this is a stochastic version of a Relative Vigor Index and I added some smoothing to make buy and sell signals clearer. There are several ways to identify buy and sell signals but generally in the long term it is a buy signal when the indicator is below the oversold line and is moving up and in the short term when the indicator is above it's trigger line which is what I coded the buy and sell signals to follow. Buy when the line is green and sell when it turns red.
Let me know if there are any other scripts you would like to see me publish!