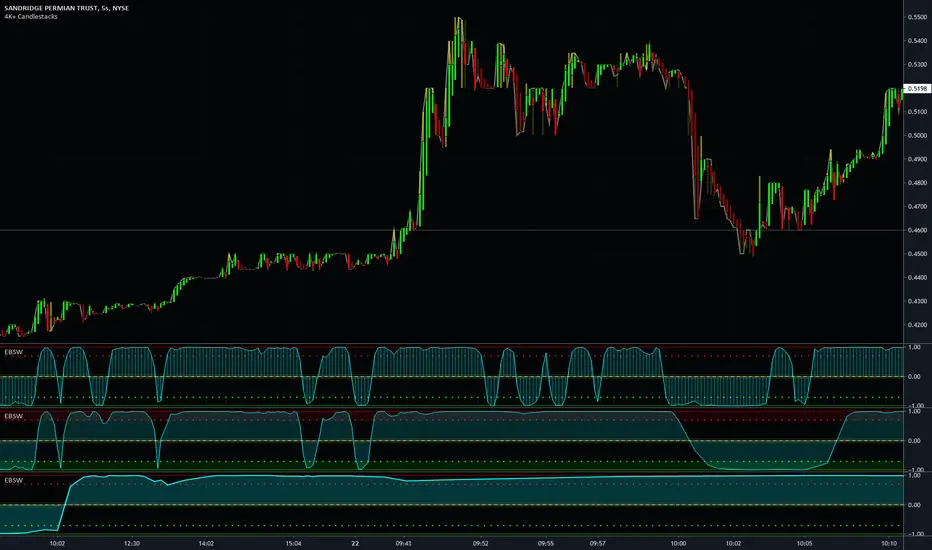
MTF Even Better Sine Wave - Dr. John EhlersThis is my enhanced "MTF Even Better Sine Wave" indicator using Pine Script version 4.0. This originates from the book "Cycle Analytics for Traders" written by Dr. John Ehlers in Chapter 12. While the original was simplistically designed, I enhanced it by adding a multitude of features Pine Script now accommodates.
Most noticeably is the multiple time frame (MTF) features in the indicator "Settings". The three displayed indicators are using 5 second, 30 second, and 7 minute time frames. This may be the first PSv4.0 script to accommodate seconds in MTF adequately, but don't quote me on that. I haven't spent hours extensively looking for them. Be forewarned, second-based time frames are currently for Premium subscribers only, until such time in the future when the prerogative of TV might change. I will be adding second-based time frames to my other indicators where I feel it is beneficial to the indicator.
Unlike Dr. John Ehlers' other Sinewave indicator that is intended for identifying turning points in cycling price fluctuations, the "Even Better Sine Wave", having stochastic like qualities, is intended for trending assets.
Features List Includes:
I.P.O.C.S.(Initial Public Offering Clean Start) Technology
Enable/disable dark background for enhanced visibility
"Source" selection with multiple time frame adjustments - including seconds
"Duration" adjustment
"Super Smoother BandEdge" adjustment
"Display Area" selection for visual mutations displayed above
Ranges and thresholds are enable/disable capable
Upper threshold adjustment
Lower threshold adjustment
Adjustable centered medial zone
Normalized zero mean to +/-1
This is not a freely available indicator, FYI. To witness my Pine poetry in action, properly negotiated requests for unlimited access, per indicator, may ONLY be obtained by direct contact with me using TV's "Private Chats" or by "Message" hidden in my member name above. The comments section below is solely just for commenting and other remarks, ideas, compliments, etc... regarding only this indicator, not others. If you do have any questions or comments regarding this indicator, I will consider your inquiries, thoughts, and concepts presented below in the comments section, when time provides it. When my indicators achieve more prevalent use by TV members, I will implement more ideas when they present themselves as worthy additions. As always, "Like" it if you simply just like it with a proper thumbs up, and also return to my scripts list occasionally for additional postings. Have a profitable future everyone!
"mtf"に関するスクリプトを検索
MTF Bollinger Bands, SuperTrend, TEMA Wave and ATR Stop LossThis script is a combination of useful overlay indicators that can be used for day trading or swing trading. You can use it for long term positions as well, but some tweaking may be required. I also added the multi time frame possibility for the majority of settings. This indicator gives you a lot of opportunities and trade setups. Default settings are made for day trading, using intraday time frames.
This script can display the following:
4 independent Bollinger Bands (MTF)
4 independent SuperTrends (MTF)
6 independent TEMAs (MTF)
ATR Stop loss for longs / shorts
Default settings display 3 Bollinger Bands, 2 TEMAs(I have found these two TEMAs particullarly useful, see screenshots below) and a signle SuperTrend.
Do not forget to always use a proper stop loss and risk management.
Here you can see the script in action in different markets:
BTC - BitMex - Setup before the drop from 7400 USD
BTC - BitMex - Setup before the drop from 8400 USD
BTC - BitMex - Setup before the pump to 7800 USD
BTC - BitMex - Setup before the pump to 6800 USD
MTF Dashboard Table - Sachin ThakareOne Dashboard, Complete Market View!
By - Sachin Thakare (India, Mumbai)
MTF HUD Indicator - All-in-One Market Dashboard
📊 Basic Information
Indicator Name: MTF HUD Table - Bias Column
Created By: Sachin Thakare
Version: Pine Script v5
Type: Multi-Timeframe Heads-Up Display (HUD)
Category: Strategy/Utility Tool
🎯 What This Indicator Does
This is a comprehensive Multi-Timeframe Market Dashboard that displays key technical indicators across 8 different timeframes (3min to Monthly) in a single, easy-to-read table format. It helps traders quickly assess market bias and make informed decisions.
✨ Key Features
📈 Multi-Timeframe Analysis
8 Timeframes: 3m, 5m, 15m, 1H, 4H, Daily, Weekly, Monthly
Real-time Updates: All timeframes update simultaneously
Color-coded Signals: Instant visual feedback
🔢 Technical Indicators Included
Price Change & % Change - Immediate price movement
VWAP - Volume Weighted Average Price
EMA 9/21 - Exponential Moving Average crossover
200 MA - Long-term trend indicator
SuperTrend 10/3 - Trend-following indicator
RSI 9 - Momentum oscillator
MACD 8/21/5 - Moving Average Convergence Divergence
ADX 7/7 - Average Directional Index
Alligator - Bill Williams' trend indicator
Stochastic 5/3/3 - Overbought/Oversold levels
ATR 10 - Average True Range (volatility)
PH/PL - Previous Day High/Low position
🎨 Visual Design
Color Psychology:
🟢 Green: Strong Bullish
🟩 Light Green: Bullish
🔴 Red: Strong Bearish
🟥 Light Red: Bearish
⚪ Gray: Neutral
Customizable Position: Top/Bottom, Left/Right, Center
Clean Table Format: Professional HUD-style display
⚙️ Smart Features
Bias Column: Automatic market bias calculation
Score-based System: 11 indicators contribute to bias score
Customizable Thresholds: Adjust bull/bear levels
Multi-timeframe Security: Accurate timeframe calculations
🚀 How to Use
For Beginners:
Install the indicator on any chart
Look at the BIAS column for overall market direction
Check consistency across timeframes
Stronger signals when multiple timeframes agree
For Advanced Traders:
Identify confluence - When multiple indicators align
Timeframe alignment - Look for agreements across timeframes
Divergence spotting - When timeframes show conflicting signals
Entry/Exit points - Use with price action confirmation
Trading Strategies:
Trend Following: Follow the dominant bias across higher timeframes
Mean Reversion: Look for extreme readings in oscillator columns
Breakout Trading: Use PH/PL and ATR columns
Swing Trading: Focus on 4H and Daily timeframes
⚙️ Customization Settings
Position Settings:
Choose from 5 display positions
Adjust to your preferred chart layout
Indicator Parameters:
Adjust all indicator lengths and periods
Modify OB/OS levels for RSI and Stochastic
Change MA types (SMA/EMA) for 200 MA
Bias Thresholds:
Strong Bull Threshold: 8 (default)
Bull Threshold: 3 (default)
Bear Threshold: -3 (default)
Strong Bear Threshold: -8 (default)
💡 Pro Tips
Start with Higher Timeframes - Daily and Weekly first
Look for Alignment - Best trades when 3+ timeframes agree
Watch the BIAS Column - Quick market sentiment check
Combine with Price Action - Use support/resistance with signals
Risk Management - Never trade on indicator alone
⚠️ Important Notes
Not a Standalone System: Use with other analysis methods
Lagging Indicators: Most components are trend-following
Market Conditions: Works best in trending markets
Customize for Your Style: Adjust parameters for your trading style
🔄 Updates & Support
The indicator is regularly updated based on user feedback and market changes. For suggestions or issues, please leave a comment on the TradingView script page.
Perfect For: Day Traders, Swing Traders, Position Traders, Market Analysts, and anyone needing quick multi-timeframe analysis.
Best Results: When combined with fundamental analysis, risk management, and proper trading psychology.

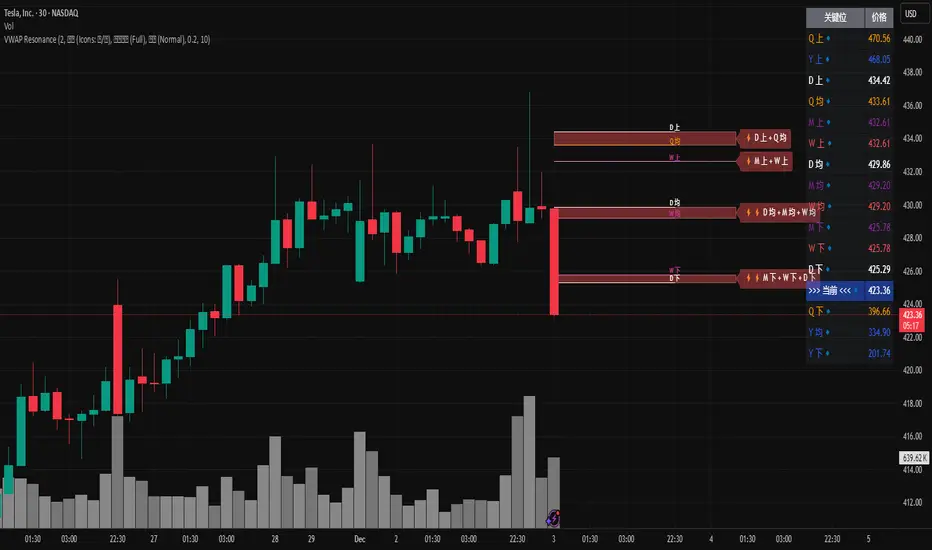
MTF VWAP Resonance [By Testeded]📈 MTF VWAP Resonance Hunter
(多级别 VWAP 共振捕猎者 - 终极版)
🇬🇧 English Description
1. Design Philosophy: The Institutional Edge
While typical indicators measure simple price action, VWAP (Volume Weighted Average Price) measures Value and Institutional Cost.
Professional traders and algorithms anchor their decisions to time-based benchmarks: Daily, Weekly, Monthly, and Quarterly. When prices return to these levels, they are testing the average cost basis of the market participants from that period.
The Logic of "Multi-Level Resonance" (MTF): A single VWAP line can be broken. However, when the Daily VWAP, Weekly Upper Band, and Quarterly Basis all overlap at the exact same price level, a "Market Consensus" is formed. This tool uses a background algorithm to detect these overlaps across 6 Timeframes (4H to Year) and visualizes them as "Resonance Boxes" instead of cluttering your chart with lines.
2. Key Features
⚓ Anchored VWAP Engine: Calculates VWAP + Standard Deviation Bands for 4H, Daily, Weekly, Monthly, Quarterly, and Yearly cycles simultaneously.
⚡ Smart Resonance Radar: Automatically detects when levels from different timeframes cluster together.
2-Line Confluence: ⚡ (Watch)
3-Line Confluence: ⚡⚡ (Strong)
4+ Line Confluence: ⚡⚡⚡ (Iron Wall)
🧘 Visual Modes (Zen / Focus):
Full Mode: Shows lines, dashboard, and resonance boxes.
Focus Mode: Hides lines, keeps dashboard and boxes.
Zen Mode: Hides EVERYTHING except the Resonance Boxes. Pure price action.
🏢 The Quarterly Line: Specifically designed to track the Quarterly VWAP, a critical level for institutional rebalancing and earnings cycles.
🎨 Customizable UI: Adjustable table text size (Small to Huge) and display styles.
3. How to Trade
Identify the Wall: Look for Red Boxes (Resistance) or Green Boxes (Support) with high star ratings (⚡⚡).
Read the Dashboard: Check the label (e.g., Q VWAP + W Lower). This tells you exactly who is defending this level (e.g., "Quarterly Buyers defending cost").
Sniper Entry: Wait for price to touch the Resonance Box. These levels often trigger sharp reversals or major breakouts.
🇨🇳 中文说明 (Chinese Description)
1. 设计哲学:多级别的全局视角
布林带反映的是波动率,而 VWAP(成交量加权平均价) 反映的是**“真金白银的持仓成本”**。
机构交易者和算法通常会锚定特定的时间周期进行交易:日内、周线、月线以及季度线。 “多级别共振”的逻辑: 单一周期的 VWAP 很容易失效。但是,当 日线 VWAP、周线上轨 和 季度线成本 在同一个价格位置重叠时,意味着短线、中线和长线资金在此处达成了**“价值共识”。 本指标通过后台算法,同时监控 6个时间周期 (4H - 年线),将这些重叠的价位转化为可视化的“共振框”**,提供一个多级别的全局视角。
2. 核心功能
⚓ 全周期锚定 VWAP:后台实时计算 4H, 日线, 周线, 月线, 季度线, 年线 的 VWAP 及其标准差轨道。
⚡ 智能共振雷达:自动检测不同周期的关键位重叠。
2线共振:⚡ (关注)
3线共振:⚡⚡ (强力支撑/阻力)
4线以上:⚡⚡⚡ (核弹级/铁壁共振)
🧘 显示模式 (Zen / Focus):
全面模式:显示所有线条 + 表格 + 共振框。
专注模式:隐藏线条,保留表格 + 共振框。
极简模式 (Zen):隐藏一切干扰,只显示共振框。像狙击手一样只看目标。
🏢 季度线增强:特别加入了 Quarterly VWAP (季度线),这是机构季末调仓和财报周期的重要防守线。
🎨 高度客制化:支持调整表格文字大小(从“小”到“巨大”),适配各种分辨率屏幕。
3. 实战用法
寻找“墙壁”:关注图表上的 红色共振框 (阻力) 或 绿色共振框 (支撑),尤其是带有 ⚡⚡ 标志的区域。
解读筹码:看一眼右上角的仪表盘标签(例如 Q VWAP + W Lower)。这意味着“季度级别的平均成本”与“周线级别的超卖线”重合,支撑力度极强。
警报交易:开启警报功能。不需要盯着屏幕,当价格撞上共振框时,指标会自动通知你。
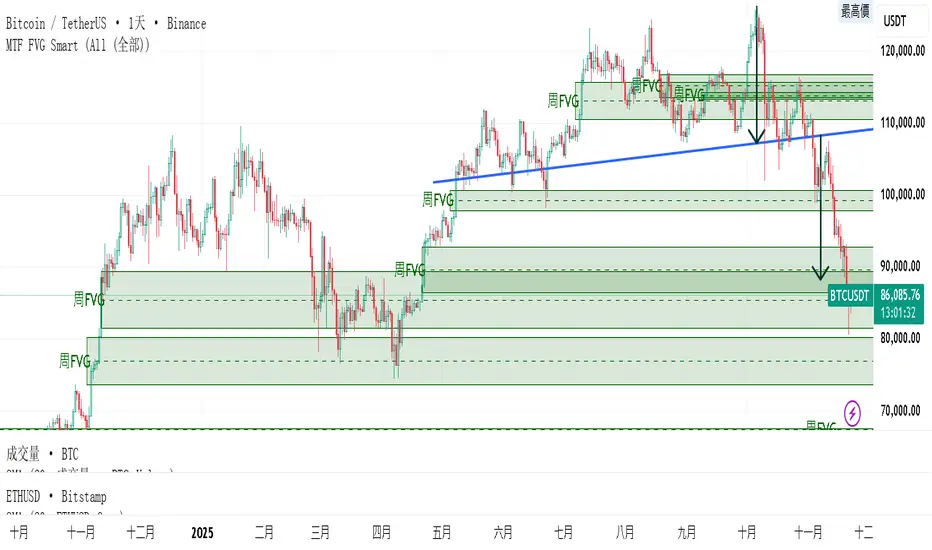
MTF FVG 智能終極版 (Smart Clean)指標名稱:MTF FVG 智能終極版 (Smart Clean)
簡潔介紹
這是一款專為專業交易者設計的 多週期失衡區 (FVG) 監控系統,核心特色如下:
五維度監控:
在任何圖表上同時顯示 月、周、日、4H、2H 五種級別的支撐壓力缺口。
智慧重疊清理 (獨家):
當價格重疊時,自動刪除舊框框,只保留最新的 1~3 個(可設定);若無重疊則完整保留歷史痕跡。確保圖表乾淨且資訊不遺漏。
完美視覺體驗:
大週期無限延伸,小週期固定長度。
文字自動靠右並智慧留白,確保不遮擋右側價格座標。
深色邊框 + 淺色填充 + 中線虛線,層次分明。
Indicator Name: MTF FVG Smart Clean Ultimate Edition
Brief Introduction
This is a multi-timeframe Free Gaps (FVG) monitoring system designed for professional traders. Its core features include:
Five-Dimensional Monitoring: Simultaneously displays support, resistance, and gaps at five timeframes (monthly, weekly, daily, 4H, and 2H) on any chart.
Intelligent Overlap Cleanup (Exclusive): When prices overlap, automatically deletes old boxes, retaining only the latest 1-3 (configurable); if there is no overlap, it retains all historical data. Ensures a clean chart and complete information.
Perfect Visual Experience: Larger timeframes extend infinitely, while smaller timeframes have fixed lengths.
Text automatically aligns to the right with intelligent white space to ensure it doesn't obscure the price coordinates on the right.
Dark borders + light fill + dashed center line create clear visual hierarchy.
MTF Scalper - alemicihanMulti-Timeframe Scalper Strategy: Aligning the Big Picture for Quick Gains
This article presents a robust futures trading strategy designed for high-frequency scalping in the crypto market. It’s built on the principle of minimizing risk by ensuring that short-term entries are always aligned with the dominant, higher-timeframe trend.
The Core Concept: Alignment is Key
A Balanced Trend Follower approach, now refined for rapid scalping, uses a Multi-Timeframe (MTF) confirmation system to filter out market noise and increase the probability of a successful trade.
The strategy operates on a Low Timeframe (LTF) chart (e.g., 3m, 5m, or 15m) but only executes trades if the direction is validated by three Higher Timeframes (HTF).
ComponentPurposeFunctionHTF (D, 4h, 1h) EMA => Trend Confirmation =>Checks if the current price is above/below all three Exponential Moving Averages (EMA 20). This provides a strong directional bias.
LTF (5m) Stochastic RSI => Momentum Entry => Generates the actual buy/sell signal by spotting a swift crossover, indicating fresh momentum in the direction of the confirmed HTF trend.
How The Signal Is Generated
Trend Alignment: The system first confirms the trend. If the price is trading above the Daily, 4-Hour, and 1-Hour EMAs, the market is deemed to be in a Strong LONG Trend. Only LONG signals are permitted.
Momentum Trigger: Once the trend is confirmed, a Long Signal is generated only when the Stochastic K-Line crosses above the D-Line, indicating a momentum shift (a pullback ending) towards the main trend direction.
Short Signal: The inverse logic applies to the Short Trend confirmation and entry signal.
Mandatory Risk Management: ATR-Based Exit
Given the high leverage nature of futures and scalping, static Stop-Loss (SL) and Take-Profit (TP) levels are inefficient. This strategy uses the Average True Range (ATR) indicator to dynamically set profit and loss targets based on current market volatility.
Stop Loss (SL): Set dynamically at 1.5 x ATR below (for long) or above (for short) the entry price. This gives the trade enough room to breathe without risking excessive capital.
Take Profit (TP): Set dynamically at 3.0 x ATR, establishing a robust Risk-to-Reward Ratio of 1:2.
Final Thoughts on Testing
This sophisticated approach combines the reliability of MTF analysis with the speed of momentum indicators. However, data analysis is key. Backtesting these parameters (EMA, ATR Multipliers, RSI/Stochastic lengths) on your chosen asset (like BTC/USDT or ETH/USDT) and timeframe is crucial to achieving optimal performance.

MTF RSI — Centered at Zero# 🌟 **MTF RSI — Centered at Zero(英語版 Description)**
**A multi–timeframe RSI tool designed for trend-filtered entries and safer reversal timing.
This script transforms both the current timeframe RSI and the 4H RSI by centering them at zero (RSI − 50), giving a clean, intuitive regime view.**
---
## 🔍 **Core Concept**
Traditional RSI fluctuates between 0–100, but the true trend cue lies in the relationship to 50.
By centering RSI at zero, you instantly see:
* **Above 0 → bullish pressure**
* **Below 0 → bearish pressure**
On top of this, the script plots the **4H RSI as a histogram**, allowing you to visually confirm whether the market is in a BUY-ONLY or SELL-ONLY environment before taking any signals.
---
## 🎯 **What This Script Helps You Do**
* Avoid dangerous counter-trend trades
* Identify high-quality reversal points only when aligned with the 4H trend
* Enter pullbacks or bounces with noticeably higher accuracy
* Visually detect regime strength and extreme conditions (RSI >70 / <30)
Even during aggressive trending markets, the combined filter
**(4H regime + local RSI extreme + initial reversal signal)**
keeps you only in high-probability opportunities.
---
## 💡 **Color Logic**
### Vertical stripe (per-bar):
* 🔴 **Overbought (RSI >70)** — red / pink
* 🔵 **Oversold (RSI <30)** — blue
* Colors become stronger when the 4H and current RSI extremes align
* Option to show history or only the most recent bar
### Histogram (4H RSI – 50):
* Pink column above 0 → bullish bias
* Blue column below 0 → bearish bias
### Pivot Signals:
* 🟠 **Buy Signal**: RSI crosses up from local weakness *AND* 4H is BUY-ONLY
* 🔴 **Sell Signal**: RSI crosses down from local strength *AND* 4H is SELL-ONLY
These signals often align with classical **Granville #4 / #8** (deep pullback reversals).
---
## ⏱️ **Timeframe Usage**
Works well on:
* **5m** for active traders
* **15m** for conservative entries
* **1H** for swing confirmation
All of them rely on the same principle:
**“Let the 4H trend guide the direction, and take only high-probability reversals.”**
---
## 🚀 **Best Use Case**
Enter only when:
1. 4H histogram clearly shows BUY-ONLY or SELL-ONLY
2. Local RSI hits extreme zones
3. A bounce or breakdown occurs
4. Your stop-loss is clearly defined beneath the reversal structure
This combination creates consistently **small losses, larger wins** —
ideal for systematic short-term trading.
---
---
# 🌟 **MTF RSI — Centered at Zero(日本語版 Description)**
**RSIを 50 でセンタリングすることで、
“相場が上に傾いているのか / 下に傾いているのか” を一瞬で判別できる、
マルチタイムフレーム対応のRSIトレンド・フィルタースクリプトです。**
---
## 🔍 **スクリプトの核心**
RSIの本質は「50を境に強弱が決まる」ことにあります。
そこで **RSI − 50** を使い、
* **0より上 → 上昇バイアス**
* **0より下 → 下降バイアス**
となるように変換しています。
4時間足RSIも同様にゼロ基準でヒストグラム化するため、
**いま市場の“支配方向(BUY ONLY / SELL ONLY)”がひと目で分かる仕様** にしています。
---
## 🎯 **このスクリプトが解決する課題**
* トレンドに逆らった“危険な逆張り”を避けられる
* 4時間足トレンドと一致したときだけ反転シグナルが出る
* 押し目買い・戻り売りの精度が高まる
* 極端ゾーン(RSI >70 / <30)を自動で縦ストライプ表示
特に、
**4時間足のトレンド + 極端ゾーン + 初動シグナル(RSI反転)**
のセットアップは実戦での成功率が非常に高いです。
---
## 🎨 **カラーの意味**
### ◆ 縦ストライプ(バー単位)
* 🔴 RSI > 70 → オーバーボート(赤/ピンク)
* 🔵 RSI < 30 → オーバーソールド(青)
* 4Hも同方向の極端であれば濃く表示
* 「過去の塗りを消すモード」搭載(今バーのみ表示)
### ◆ 4時間足ヒストグラム(RSI − 50)
* ピンク:上昇圧力(BUY ONLY に近い)
* 青:下降圧力(SELL ONLY に近い)
### ◆ 反転シグナル
* 🟠 BUY:RSIが弱い領域から上抜け + 4H BUY ONLY
* 🔴 SELL:RSIが強すぎる領域から下抜け + 4H SELL ONLY
これはグランビルの4番/8番(深い押し・戻りの反転)にも一致します。
---
## 🕒 **推奨タイムフレーム**
* 5分足:素早くエントリーしたい人
* 15分足:最も安定
* 1時間足:ゆったり目線のスイング向け
---
## 🚀 **ベストな使い方**
以下の条件が揃ったとき、統計的に最も強いエントリーになります:
1. 4時間足RSIヒストグラムが BUY ONLY / SELL ONLY
2. 15分足RSIが極端ゾーンに到達
3. 反転初動のシグナルが点灯
4. 損切りラインが構築できている
(直近安値・高値のすぐ外側)
これにより、**損小利大でブレの少ないトレード** が可能になります。

MTF Checklist DashboardMTF Checklist Dashboard
Overview
The MTF Checklist Dashboard is an advanced multi-timeframe analysis tool that provides traders with a comprehensive visual dashboard to analyze market conditions across six customizable timeframes simultaneously. This indicator combines multiple technical analysis methods, including Opening Range Breakouts (ORB), VWAP, EMAs, and daily price levels, to generate high-probability confluence-based trading signals.
Unlike traditional single-timeframe indicators, this dashboard displays all critical information in one organized table, allowing traders to instantly identify when multiple timeframes align for optimal entry and exit opportunities.
Key Features
Multi-Timeframe Analysis
Analyzes up to 6 timeframes simultaneously (default: 1m, 5m, 15m, 30m, 1h, 4h)
Fully customizable timeframe selection via comma-separated input
Color-coded cells for instant visual recognition (green=bullish, red=bearish, yellow=neutral)
Technical Indicators Tracked
Current and previous candle direction
Opening Range Breakout (ORB) positioning with custom period
VWAP relationship (above/below)
200 EMA positioning
Daily and previous day high/low proximity
EMA crossovers (9 vs 21, both vs 200)
Advanced Signal Filtering System
Confluence scoring: Requires multiple timeframes to align (3-6 timeframes)
Higher timeframe confirmation: Ensures 30m/1h/4h agreement
Volume filter: Confirms signals with above-average volume (1.5x default)
ATR volatility filter: Validates sufficient market movement
Session timing: Restricts signals to optimal trading hours (EST)
Momentum confirmation: Requires recent directional strength
Range positioning: Blocks signals near daily extremes
Candle strength: Validates strong directional candles (60%+ body ratio)
Visual Signals
Optional entry arrows (above/below bars)
Background color highlighting
Organized dashboard with real-time price levels
ORB range, current day, and previous day summary rows
Alert Conditions
JSON-formatted alerts for automated trading integration
Separate alerts for long entry, short entry, long exit, and short exit
Compatible with webhook automation systems
How To Use
Dashboard Interpretation
The dashboard displays a color-coded table with the following columns:
TF: Timeframe being analyzed
C: Current candle (Green=bullish, Red=bearish)
P: Previous candle (Green=bullish, Red=bearish)
ORB: Opening Range Breakout position (A=Above, B=Below, W=Within)
VWAP: Price vs VWAP (A=Above, B=Below)
E200: Price vs 200 EMA (A=Above, B=Below)
D Hi/Lo: Proximity to current day high/low (Hi/Lo/Mid)
PD Hi/Lo: Proximity to previous day high/low (Hi/Lo/Mid)
9 vs 21: EMA 9 vs EMA 21 relationship (A=9 above 21, B=9 below 21)
9&21 v200: Both EMAs vs 200 EMA (>>=both above, <<=both below, <>=mixed)
Signal Generation
Long Entry Signal triggers when:
Minimum number of timeframes show bullish alignment (default: 5 of 6)
Higher timeframes (30m/1h/4h) confirm direction (default: 2 of 3)
Price breaks above ORB high with sufficient distance
Volume exceeds average by specified multiplier
ATR shows adequate volatility
Trade occurs during optimal session hours
Recent momentum is upward
Price not too close to daily high
Strong bullish candle forms
Short Entry Signal uses opposite conditions
Exit Signals trigger when opposing timeframe confluence reaches threshold (default: 3 timeframes)
Recommended Workflow
Select your asset and primary trading timeframe
Observe the dashboard - Look for rows showing mostly green (bullish) or red (bearish)
Wait for alignment - The indicator will show arrows when confluence requirements are met
Check the bottom rows - Review ORB levels and daily ranges for context
Set alerts - Enable TradingView alerts using the built-in alert conditions
Manage risk - Use appropriate position sizing and stop losses based on ORB range or daily ATR
Settings Guide
Basic Settings
Timeframes: Enter comma-separated values (e.g., "1,5,15,30,60,240")
Show Header: Toggle column headers on/off
ORB Minutes: Set opening range period (default: 15 minutes)
Near % for daily highs/lows: Define proximity threshold (default: 0.20%)
Use close for comparisons: Compare using close vs current price
Dashboard Position: Choose from 9 screen positions
Confluence Filters
Minimum Timeframes Aligned: Set required confluence (3-6, default: 5)
Require Higher Timeframe Confirmation: Toggle HTF requirement on/off
Min Higher Timeframes: Specify HTF agreement needed (1-3, default: 2)
Volume Filter
Volume Confirmation: Enable/disable volume filtering
Volume vs Average: Set multiplier threshold (default: 1.5x)
Volume Average Length: Period for volume average (default: 20 bars)
Volatility Filter (ATR)
Volatility Filter: Enable/disable ATR confirmation
ATR Length: Calculation period (default: 14)
Min ATR vs Average: Required ATR level (default: 0.5x = 50%)
ORB Filters
ORB Breakout Distance Required: Toggle distance requirement
Min Breakout % Beyond ORB: Additional breakout threshold (default: 0.10%)
Session Filter
Trade Only During Best Hours: Enable time-based filtering
Session 1: First trading window (default: 0930-1130 EST)
Session 2: Second trading window (default: 1400-1530 EST)
Momentum Filter
Recent Momentum Required: Enable directional momentum check
Lookback Bars: Period for momentum comparison (default: 3 bars)
Daily Range Filter
Block Signals Near Daily Extremes: Prevent entries at extremes
Distance from High/Low %: Minimum distance required (default: 2.0%)
Candle Filter
Strong Directional Candle: Require candle strength
Min Candle Body %: Body-to-range ratio threshold (default: 60%)
Visual Signals
Show Entry Signals: Master toggle for visual signals
Show Arrows: Display entry arrows on chart
Background Color: Enable background highlighting
Best Practices
Start with default settings and adjust based on your trading style and asset volatility
Higher confluence requirements (5-6 timeframes) produce fewer but higher-quality signals
Enable all filters for conservative trading; disable some for more frequent signals
Use the dashboard as confirmation alongside your existing trading strategy
Backtest on your specific instruments before live trading
Consider market conditions—trending vs ranging markets may require different settings
Alerts
This indicator includes four alert conditions with JSON formatting for webhook integration:
Long Entry Signal: Triggers when all long conditions are met
Short Entry Signal: Triggers when all short conditions are met
Long Exit Signal: Triggers when opposing confluence reaches exit threshold
Short Exit Signal: Triggers when opposing confluence reaches exit threshold
Alert messages include ticker symbol, action (buy/sell), price, and quantity for automated trading systems.
Important Notes
This indicator works best on liquid instruments with clear price action
Highly volatile markets may require adjusted ATR and ORB distance settings
Session times are in EST timezone—adjust if trading non-US markets
The ORB calculation requires sufficient price history for the day
Signals are generated in real-time but should be confirmed at candle close
Limitations
Maximum of 6 timeframes can be analyzed due to TradingView's security call limits
ORB calculations may not work correctly on instruments with gaps or irregular sessions
The indicator is most effective during regular market hours when volume and volatility are adequate
Lower timeframes (1m, 5m) may produce more false signals in choppy conditions
License
Mozilla Public License 2.0 (MPL-2.0)
This indicator is licensed under the Mozilla Public License 2.0. You are free to use, modify, and distribute this code under the terms of the MPL-2.0. The full license text is available at mozilla.org
Key license provisions:
You may use this code commercially
You may modify and distribute modified versions
Modified versions must be released under the same license
You must include the original license notice in any distributions
No trademark rights are granted
Disclaimer
This indicator is provided for educational and informational purposes only. It is not financial advice, and past performance does not guarantee future results. Trading involves substantial risk of loss. Always:
Practice proper risk management
Test thoroughly on paper/demo accounts before live trading
Use appropriate position sizing
Never risk more than you can afford to lose
Consult with a financial advisor for personalized advice
The creator assumes no liability for trading losses incurred using this indicator.
Version: 2.0
Pine Script Version: v6
Author: © EliasVictor

MTF Cloud With Candle ColorTwo EMA Clouds MTF with option to color candles based on Short > Long on first cloud. With two clouds one can use one for trade and the other for trend. MTF allows for viewing more granular interactions with longer such as daily time frames.
MTF RSI+EMA Trend Dashboard🧭 MTF RSI + EMA Trend Dashboard
📌 Overview
The MTF RSI + EMA Trend Dashboard is a powerful multi-timeframe trend analyzer designed to help traders instantly identify bullish, bearish, and neutral trends across multiple timeframes — all in one compact dashboard.
It combines two of the most reliable momentum and trend indicators — RSI (Relative Strength Index) and EMA (Exponential Moving Average) — to provide a clear and color-coded view of market direction and strength.
⚙️ How It Works
For each selected timeframe (default: 4H, 1D, 1W, 1M, 3M), the indicator calculates:
RSI to measure momentum
EMA to track the prevailing trend
Price position vs. EMA to confirm trend bias
A timeframe is classified as:
🟢 Bullish → RSI > 60 and Price > EMA
🔴 Bearish → RSI < 40 and Price < EMA
🟡 Neutral → Otherwise
These conditions are displayed in a clean table format for quick visual analysis.
📊 Dashboard Details
Column 1: Timeframe
Column 2: RSI value (with dynamic color for overbought/oversold zones)
Column 3: Trend status (Bullish / Bearish / Neutral)
At the bottom-right corner, the indicator shows the Overall Trend Summary:
✅ “Overall: Bullish” → All timeframes are bullish
❌ “Overall: Bearish” → All timeframes are bearish
⚖️ “Overall: Mixed” → Mixed trends across timeframes
🔔 Built-in Alerts
You’ll receive alerts when:
All timeframes turn Bullish → Possible long opportunity
All timeframes turn Bearish → Possible short opportunity
(You can customize RSI thresholds and EMA period in the input settings.)
✨ Key Features
✅ Multi-timeframe RSI + EMA alignment
✅ Clear visual dashboard for quick decision-making
✅ Adjustable RSI and EMA parameters
✅ Fully customizable timeframes
✅ Auto color-coded RSI and trend cells
✅ Optional alerts for strong trend alignment
📈 Ideal For
Swing traders identifying momentum across higher timeframes
Day traders confirming trend bias
Position traders aligning entries with macro trends
⚠️ Disclaimer
This indicator is intended for educational and informational purposes only.
It does not constitute financial advice. Always use proper risk management and confirm signals with other analyses before making trading decisions.

MTF Supply and Demand Zones [MMT]Description
The MTF Supply and Demand Zones indicator is a powerful tool designed to identify and display supply and demand zones across multiple timeframes (MTF) on your TradingView chart. These zones highlight key areas where price is likely to react, based on significant price movements in higher timeframes. The indicator is highly customizable, allowing traders to adjust zone strength, timeframes, colors, and display settings to suit their trading style.
Key Features
Multi-Timeframe Analysis : Detects supply and demand zones from up to five user-defined timeframes (e.g., 30m, 1H, 4H, 1D, 1W).
Zone Strength Filter : Filters zones based on the strength of price movements, ensuring only significant zones are displayed.
Customizable Display : Toggle supply and demand zones on/off, adjust colors, border styles, and label settings for clarity.
Dynamic Zone Extension : Extends zones to the right of the chart for better visibility, with adjustable extension length.
Zone Cleanup : Automatically removes zones when price breaks through them, keeping the chart clean and relevant.
Labels : Displays timeframe labels on zones for easy identification, with customizable size, color, and alignment.
How It Works
Supply Zones : Identified when a strong bearish candle follows a bullish or neutral candle, indicating potential selling pressure.
Demand Zones : Identified when a strong bullish candle follows a bearish or neutral candle, indicating potential buying pressure.
Zones are drawn as boxes, with the top and bottom based on key price levels (e.g., highs/lows or open prices).
The indicator uses a strength filter to ensure only significant zones (based on candle size ratios) are plotted.
Zones are updated dynamically, extending to the right by a user-defined number of bars and removed when price breaks through them.
Settings
S&D Zones Settings
Zone Strength Filter : Adjust the minimum candle size ratio (default: 1.8) to filter weaker zones.
Show Supply/Demand : Enable or disable supply and/or demand zones.
Supply/Demand Colors : Customize the fill and border colors for supply (default: red) and demand (default: green) zones.
Timeframes : Enable up to five timeframes (e.g., 30m, 1H, 4H, 1D, 1W) to analyze zones. Only zones from timeframes higher than the chart’s timeframe are displayed.
Display Settings
Zone Extension : Set how far zones extend to the right (in bars, default: 15).
Show Label: Toggle timeframe labels on zones.
Label Style : Customize label color, size (tiny, small, normal, large, huge), and alignment (horizontal/vertical).
Usage Tips
Use higher timeframes (e.g., 4H, 1D) for stronger, more reliable zones.
Combine with other indicators (e.g., support/resistance, trendlines) to confirm trade setups.
Adjust the Zone Strength Filter to reduce noise in volatile markets.
Enable labels to quickly identify the timeframe of each zone.
Notes
The indicator is overlayed on the price chart and supports up to 500 zones.
Zones are removed when price breaks above (supply) or below (demand), ensuring only active zones remain.
Works best on markets with clear price action, such as futures, forex, stocks, or cryptocurrencies.
Happy trading! 🚀

MTF Oscillator Stack [BigBeluga]🔵 OVERVIEW
The MTF Oscillator Stack brings powerful multi-timeframe momentum analysis directly into your price chart. You can select one oscillator— RSI , MFI , or Stochastic RSI —and display it across up to 4 different timeframes. Each panel is neatly stacked horizontally above price , offering quick insight into cross-timeframe conditions like trend direction, exhaustion zones, and momentum shifts.
🔵 CONCEPTS
Single Oscillator Mode: Select one oscillator type (RSI, MFI, or Stoch RSI) to analyze across all selected timeframes.
Top-Chart Horizontal Panels: Oscillator plots are aligned horizontally at the top of the chart for seamless top-down reading.
Signal Comparison Arrows: Arrows (🢁 / 🢃) indicate oscillator position relative to its signal line.
Overbought/Oversold Zones: Transparent 30–70 fill zones highlight key reversal areas.
Dynamic Display Logic: Only enabled panels are shown; spacing adjusts based on active timeframes.
Timeframe Tagging: Each oscillator panel is labeled with its corresponding timeframe (e.g., 1H, 2H, 4H).
🔵 FEATURES
Choose one oscillator (RSI, MFI, or Stoch RSI) and apply it across up to 4 timeframes.
Each oscillator panel includes: price-synced plot, signal line, and zone shading.
Scale alignment allows users to place charts at the bottom or top.
Clear arrow signals show whether oscillator is bullish or bearish.
Individual length and signal settings per timeframe.
Toggle for alignment mode: evenly spaced or floating layout.
All panels use a consistent layout for faster decision-making.
🔵 HOW TO USE
Select your preferred oscillator and activate 2–4 key timeframes (e.g., 1H, 4H, D1, W1).
Use signal crossovers as a bullish (🢁) or bearish (🢃) trend cue.
Look for aligned extremes (e.g., all timeframes overbought) to spot momentum exhaustion.
Ideal for momentum confluence strategies and top-down confirmation.
Use horizontal layout to stay focused on price while assessing broader structure.
🔵 CONCLUSION
MTF Oscillator Stack simplifies complex multi-timeframe momentum analysis into one clean, actionable visual. Whether you're tracking RSI, MFI, or Stoch RSI, this tool helps you stay aligned with the broader trend—without ever leaving your main chart.

MTF Candles [Fadi x MMT]MTF Candles
Overview
The MTF Candles indicator is a powerful tool designed for traders who want to visualize higher timeframe (HTF) candles directly on their current chart. Built with flexibility and precision in mind, this Pine Script indicator displays up to six higher timeframe candles, complete with customizable styling, sweeps, midpoints, fair value gaps (FVGs), volume imbalances, and trace lines. It’s perfect for multi-timeframe analysis, helping traders identify key levels, market structure, and potential trading opportunities with ease.
Key Features
- Multi-Timeframe Candles : Display up to six higher timeframe candles (e.g., 5m, 15m, 30m, 4H, 1D, 1W) on your chart, with configurable timeframes and visibility.
- Sweeps Detection : Identify liquidity sweeps (highs/lows) with customizable line styles, widths, and colors, plus optional alerts for confirmed bullish or bearish sweeps.
- Midpoint Lines : Plot the midpoint (average of high and low) of the previous HTF candle, with customizable color, width, and style for enhanced market analysis.
- Fair Value Gaps (FVGs) : Highlight gaps between non-adjacent candles, indicating potential areas of interest for price action.
- Volume Imbalances : Detect and display volume imbalances between adjacent candles, aiding in spotting significant price levels.
- Trace Lines : Connect HTF candle open, close, high, and low prices to their respective chart bars, with customizable styles and optional price labels.
- Custom Daily Open Times : Support for custom daily candle open times (Midnight, 8:30, or 9:30) to align with specific market sessions.
- Dynamic Labels : Show timeframe names, remaining time until the next HTF candle, and interval labels (e.g., day of the week for daily candles) with adjustable positions and sizes.
- Highly Customizable : Fine-tune candle appearance, spacing, padding, and visual elements to suit your trading style.
How It Works
The indicator renders HTF candles as boxes (bodies) and lines (wicks) on the right side of the chart, with each timeframe offset for clarity. It dynamically updates candles in real-time, tracks their highs and lows, and displays sweeps and midpoints when conditions are met. FVGs and volume imbalances are calculated based on candle relationships, and trace lines link HTF candle levels to their originating bars on the chart.
Sweep Logic
- A bearish sweep occurs when the current candle’s high exceeds the previous candle’s high, but the close is below it.
- A bullish sweep occurs when the current candle’s low falls below the previous candle’s low, but the close is above it.
- Sweeps are visualized as horizontal lines and can trigger alerts when confirmed on the next candle.
Midpoint Logic
- A midpoint line is drawn at the average of the previous HTF candle’s high and low, extending until the next HTF candle forms.
- Useful for identifying potential support/resistance or mean reversion levels.
Imbalance Detection
- FVGs : Identified when a candle’s low is above the next-but-one candle’s high (or vice versa), indicating a price gap.
- Volume Imbalances : Detected between adjacent candles where the body of one candle doesn’t overlap with the next, signaling potential liquidity zones.
Settings
Timeframe Settings
- HTF 1–6 : Enable/disable up to six higher timeframes (default: 5m, 15m, 30m, 4H, 1D, 1W) and set the maximum number of candles to display per timeframe (default: 4).
- Limit to Next HTFs : Restrict the number of active timeframes (1–6).
Styling
- Body, Border, Wick Colors : Customize bull and bear candle colors (default: light gray for bulls, dark gray for bears).
- Candle Width : Adjust the width of HTF candles (1–4).
- Padding and Spacing : Set the offset from the current price action and spacing between candles and timeframes.
Label Settings
- HTF Label : Show/hide timeframe labels (e.g., "15m", "4H") at the top/bottom of candle sets.
- Remaining Time : Display the countdown to the next HTF candle.
Interval Value: Show day of the week for daily candles or time for intraday candles.
- Label Position/Alignment : Choose to display labels at the top, bottom, or both, and align them with the highest/lowest candles or follow individual candle sets.
Imbalance Settings
- Fair Value Gap : Enable/disable FVGs with customizable color (default: semi-transparent gray).
- Volume Imbalance : Enable/disable volume imbalances with customizable color (default: semi-transparent red).
Trace Settings
- Trace Lines : Enable/disable lines connecting HTF candle levels to their chart bars, with customizable colors, styles (solid, dashed, dotted), and sizes.
- Price Labels : Show price levels for open, close, high, and low trace lines.
- Anchor : Choose whether trace lines anchor to the first or last enabled timeframe.
Sweep Settings
- Show Sweeps : Enable/disable sweep detection and visualization.
- Sweep Line : Customize color, width, and style (solid, dashed, dotted).
- Sweep Alert : Enable alerts for confirmed sweeps.
Midpoint Settings
- Show Midpoint : Enable/disable midpoint lines.
- Midpoint Line : Customize color (default: orange), width, and style (solid, dashed, dotted).
Custom Daily Open
Custom Daily Candle Open : Choose between Midnight, 8:30, or 9:30 (America/New_York) for daily candle opens.
Usage
- Add the indicator to your TradingView chart.
- Configure the desired higher timeframes (HTF 1–6) and enable/disable features via the settings panel.
- Adjust styling, labels, and spacing to match your chart preferences.
Use sweeps, midpoints, FVGs, and volume imbalances to identify key levels for trading decisions.
- Enable sweep alerts to receive notifications for confirmed liquidity sweeps.
Notes
Performance: The indicator is optimized for up to 500 boxes, lines, and labels, with a maximum of 5000 bars back. Can be slow at a time
Time Zone: Custom daily opens use the America/New_York time zone for consistency with major financial markets.
Compatibility: Ensure selected HTFs are valid (higher than the chart’s timeframe and divisible by it for intraday periods).

MTF 5 Big Candles [RanaAlgo]Overview
This Pine Script indicator displays multiple timeframe (MTF) candlesticks from 5 different timeframes on your current chart. It helps traders quickly assess higher timeframe price action without switching charts.
Key Features
5 Customizable Timeframes
Displays candles from user-selected timeframes (e.g., 15m, 30m, 1H, 4H, Daily).
Each candle is offset to avoid clutter.
Visual Customization
Adjustable spacing, width, and colors for bullish/bearish candles.
Option to show/hide wicks, OHLC labels, and price guide lines.
Clear Price Reference
Dotted guide lines extend from the current price to the MTF candles for easy comparison.
OHLC labels (optional) show exact price levels.
and u can also check the remainig time of candles ..
Usefulness
✅ Multi-Timeframe Analysis – Compare trends across different timeframes at a glance.
✅ Avoid Chart Switching – See higher timeframe structure while trading lower TFs.
✅ Identify Key Levels – Spot support/resistance from higher timeframe candles.
✅ Customizable Layout – Adjust spacing and styling to fit your trading style.
Best For
Swing & position traders analyzing multiple timeframes.
Day traders looking for confluence from higher TFs.
Traders who prefer visual candlestick patterns over plain lines.
This script is particularly useful for confirming trends, spotting reversals, and aligning entries with higher timeframe structure.

MTF Analysis Panel [Invesmate]MTF Analysis Panel
This indicator provides a compact Multi-Timeframe (MTF) view of trend and momentum conditions directly on the chart. It combines EMA trend checks, RSI momentum checks, and optional Relative Strength analysis to offer an intuitive overview of market structure across intraday, daily, weekly, and monthly timeframes.
Trend and Momentum Analysis
The script uses two primary methods for assessing the market:
Trend Detection: Based on price relation to a user-selected EMA for each timeframe.
Momentum Detection: Based on whether RSI is above or below 50 for each timeframe.
Users can independently toggle these modules through inputs to customize the panel for different analysis needs.
Trend and momentum are calculated separately to avoid bias, helping traders capture the real state of the market across multiple timeframes.
Relative Strength (Optional)
If enabled, when either Weekly or Monthly timeframes are selected, the panel will display Relative Strength (RS ) data.
RS measures the stock's performance relative to a benchmark symbol (like NSE:NIFTY).
This value shows the percent outperformance or underperformance over a user-defined period (default 55 days), allowing deeper market strength analysis.
Table and Display Logic
The indicator draws a neat panel on the chart using TradingView’s table functionality.
Each selected timeframe (15m, 1h, 4h, 1D, 1W, 1M) will display:
Trend (EMA): Green for bullish trend (Price > EMA), Red for bearish trend (Price < EMA), Gray if neutral or not applicable.
Momentum (RSI): Green if RSI > 50, Red if RSI < 50, Gray if neutral.
Symbols for trend and momentum can be customized between:
Emoji mode (e.g., 🟢, 🔴, 🟦, 🟥)
Text mode (e.g., UP, DOWN, NEUTRAL)
The panel is customizable for position (Top Left, Top Right, Bottom Left, Bottom Right) to fit user preference.
Color Codes
Strong Bullish: All selected timeframes are trending up and momentum is rising — shown with a light green background.
Strong Bearish: All selected timeframes are trending down and momentum is falling — shown with a light red background.
Mixed: Any mixed state (some up, some down) — shown with a neutral gray background.
This helps traders instantly recognize overall market sentiment without manually checking individual timeframes.
Summary Labels
At the bottom of the panel, two powerful summaries are displayed:
Trend Summary: Overall trend aggregation across selected timeframes ("STRONG BULLISH", "STRONG BEARISH", or "MIXED").
Momentum Summary: Overall momentum aggregation ("MOMENTUM UP", "MOMENTUM DOWN", or "MOMENTUM MIXED").
When Relative Strength is available (Weekly or Monthly enabled), it is also shown separately at the bottom, providing a complete strength-versus-benchmark view.
Input Controls
Enable EMA Trend Check: Toggle EMA-based trend detection.
Enable RSI Momentum Check: Toggle RSI-based momentum detection.
Timeframes to Display: 15m, 1h, 4h, 1D, 1W, 1M can be independently turned on or off.
EMA Length per Timeframe: Customize EMA lengths for different timeframes.
RSI Length: Set RSI calculation period.
Comparative Symbol: Select the benchmark symbol for Relative Strength calculations.
RS Period: Choose the lookback period for Relative Strength.
Emoji Display Toggle: Switch between emoji-based or text-based display styles.
Table Location: Choose where the analysis panel appears on the chart.
Special Features
Realtime Updating: The panel updates dynamically as bars close, maintaining real-time relevance.
Maximum Label Control : Designed to respect TradingView's maximum label limits to avoid runtime errors.
Optimized for Performance: Uses conditional requests and security calls efficiently, minimizing script execution load.
Known Limitations
Request.security limitations: Relative Strength is only calculated on Daily data for stability; lower timeframe RS is not implemented.
TradingView Table Size: On some screen sizes or with many timeframes selected, table may overlap candles. Adjust panel location accordingly.

MTF Sqz by The CrazyChrisCC – MTF Sqz/EMA
I create this script to easily be able to see the EMA and the Squeeze on multiple time frame at the same time and to easily create alert without going to each time frame to activate them.
Here how it work :
TF/EMA :
This section show all 13 different time frame with a variable background color. The background color refer to the EMA 8 , 21 and 50. If all EMA are stack up ( ema 8 above ema 21 and ema 21 above ema 50) the background will be Green. If the EMA are stack down ( ema 8 below ema 21 and ema 21 below ema 50) the background will be Red. If the EMA are mix (no direction) the background will be Yellow.
Sqz :
1. This section show the squeeze for each time frame
- Green background = no squeeze
- Gray background = low squeeze
- Red background = medium squeeze
- Orange background = high squeeze
2. This section also show A+Up or A+Down :
- A+Up = EMA stack UP + medium or high squeeze + momentum increase
- A+Down = EMA stack Down + medium or high squeeze + momentum decrease
Buy Zone :
- Bz (green background) = Price between EMA 8 and EMA 21 + EMA stack Up + Medium or High squeeze
- Sz (red background) = Pirce between EMA 21 and EMA 8 + EMA stack Down + Medium or High squeeze
Best part of this indicator are the Alert !!! : They will advert when the price action is in the good spot for long or short depending of what kind of alert you set. (These alert are for information only, you choose by yourself if you want to go long or short or do nothing!)
I personally only used this indicator on the Bullish side ( I’m more of a bullish trader than a bearish trader) but I put different type of alert for all kind of trader.
First you need to go on the setting of this indicator to set the king of alert you want. By default it will activate alert for the Bullish ‘A+ Up + Bz’ condition ( I remove the 1 min , 3 min, daily, weekly and monthly alert to not receive too much alert)
Also before I set the alert I habitually choose a chart time frame of 30 min or around. The reason is if I choose a time frame to short I will received too much alert and if I choose a time frame too long I will not received enough alert but everyone each preference, you have the choose the best time frame that fit your kind of trading
To activate alert, go to the 3 dots (… , more) on the indicator title than chose the first option ( add alert on cc – MTF sqz) than click ‘Create’. From now every time frame that was already select in the setting of this indicator will be monitor and give you an alert when the conditions are met.
I also add some information the TICK indicator, the daily ATR and the Market cap for information purpose only.
Good trading to all
Feel free to comment or add request to this indicator, I try my best to respond to everyone

MTF Countdown with Direction - AynetIndicator Definition and Inputs:
pineCopyindicator('MTF Countdown with Direction - Aynet', overlay = true)
This code creates a Multiple Time Frame (MTF) countdown indicator with direction
The overlay = true parameter places the indicator on top of the price chart
Timeframe Options:
Users can choose to show/hide the following timeframes:
1 minute
5 minutes
15 minutes
30 minutes
1 hour
4 hours
Daily
Time Calculations:
pineCopyget_current_time()
Calculates the current time
Converts Unix timestamp to seconds
Calculates time since midnight
Returns time broken down into hours, minutes, and seconds
Countdown Calculation:
pineCopyget_period_countdown(period_seconds)
Calculates remaining time for each timeframe
Computes elapsed time in current period
Returns remaining time in hours, minutes, and seconds
Direction and Closing Price Calculation:
Separate functions for each timeframe (get_direction_and_close_1m(), get_direction_and_close_5m(), etc.)
Each function:
Gets current closing price
Compares with previous closing price
Determines direction (up: 1, down: -1, sideways: 0)
Returns direction and closing price
Table Creation and Updates:
Creates a table in the top right corner
Table consists of 4 columns:
Period (Timeframe)
Time Left (Remaining time)
Direction (Shown with arrows)
Close (Closing price)
Each row has a different background color
Direction arrows:
Green up arrow (▲): Price rising
Red down arrow (▼): Price falling
Gray line (―): Price sideways
Dynamic Data Structures:
pineCopyvar timeframes = array.new_int()
var timeframe_names = array.new_string()
var show_array = array.new_bool()
Uses dynamic arrays for timeframes
Adds selected timeframes to arrays on first run
Key Features:
Shows remaining time until period close
Displays price direction for each timeframe
Shows current closing prices
All information in a single, easy-to-read table
This indicator helps traders by providing a comprehensive view of:
When each timeframe will close
The direction of price movement
Current closing prices
across multiple timeframes in a single table, making it easier to track market movements across different time periods.
The color-coding and arrow system makes it visually intuitive to understand market direction at a glance, while the countdown timer helps with timing decisions.

MTF Supply & Demand [SMRT Algo] The SMRT Algo Multi-Timeframe Supply & Demand indicator is a powerful tool designed to help traders identify key supply and demand zones across multiple timeframes on their charts without switching the chart timeframe. This indicator simplifies the process of analyzing higher timeframe zones by allowing users to adjust the timeframe settings within the indicator itself, eliminating the need to switch between different chart timeframes. This flexibility makes it easier for traders to incorporate higher timeframe analysis into their trading strategy, enhancing their ability to identify optimal entry and exit points.
Core Features
Supply and Demand Zones Identification:
The indicator automatically identifies and highlights supply and demand zones on the chart, which are critical areas where the market is likely to reverse or experience significant price movement. These zones represent areas of strong buying (demand) or selling (supply) pressure, making them key levels for potential trade setups. The clear visualization of these zones on the chart helps traders quickly identify important price levels without manual analysis.
Multi-Timeframe Functionality:
One of the standout features of the SMRT Algo Multi-Timeframe Supply & Demand indicator is its ability to display supply and demand zones from other timeframes directly on the current chart. Traders can adjust the timeframe of the supply and demand zones through the indicator settings, allowing them to view and analyze higher timeframe zones without switching between different charts. This feature is particularly useful for traders who rely on higher timeframe analysis to make more informed trading decisions.
Customizable Timeframe Settings:
The indicator provides a high degree of customization, allowing users to select the specific timeframe from which they want to view supply and demand zones. Whether a trader prefers to analyze daily, weekly, or even monthly zones while trading on a lower timeframe, this indicator accommodates their needs. This flexibility helps traders align their strategies with broader market trends, ensuring they are aware of significant supply and demand levels across different timeframes.
Potential Entry and Take Profit Zones:
The supply and demand zones identified by the indicator can be used as potential entry points for trades or as take profit zones. Traders can enter long positions near demand zones, where buying pressure is expected to push prices higher, or enter short positions near supply zones, where selling pressure might drive prices lower. Additionally, these zones can serve as logical areas to take profits, as they represent levels where the market is likely to encounter resistance or support.
The identification of supply and demand zones serves as the foundation for potential trade setups, while the multi-timeframe functionality enhances the depth of analysis by allowing traders to view higher timeframe zones without leaving their current chart. This combination ensures that traders can maintain a clear understanding of significant market levels across different timeframes, enabling them to make more informed and strategic trading decisions.
Inputs:
Timeframe: Choose the timeframe for the supply-demand zones shown on the chart.
Sensitivity: Adjust the sensitivity of the S/D zones. A smaller value will lead to fewer zones generated on the chart, while a larger value will lead to more zones shown.
Width: Adjust the width (size) of the zones. A smaller value will result in smaller zones, while a larger value will result in larger zones.
Supply/Demand Color: Freely adjust the colors of the supply-demand zones.
Zones Offset: This affects the extension of the zones (i.e. many bars to the right).
Timeframe Label: The timeframe label is displayed on the top right corner, and can be turned on/off. It displays the timeframe of the MTF Supply Demand. The position and size of the label can also be adjusted.
The ability to view and adjust supply and demand zones from multiple timeframes directly within the indicator settings offers a significant advantage, providing traders with a more comprehensive view of the market.
This indicator is particularly valuable for traders who utilize multi-timeframe analysis as part of their strategy, offering them the ability to stay aware of critical levels across different timeframes without the hassle of constantly switching charts. The customizable nature of the indicator further enhances its utility, making it a versatile tool that can be tailored to suit various trading styles and preferences.
The SMRT Algo Suite, which the SMRT Algo MTF Supply Demand indicator is a part of, offers a comprehensive set of tools and features that extend beyond the capabilities of standard or open-source indicators, providing significant additional value to users.
What you also get with the SMRT Algo Suite:
Advanced Customization: Users can customize various aspects of the indicator, such as toggling the confirmation signals on or off and adjusting the parameters of the MA Filter. This customization enhances the adaptability of the tool to different trading styles and market conditions.
Enhanced Market Understanding: The combination of pullback logic, dynamic S/R zones, and MA filtering offers traders a nuanced understanding of market dynamics, helping them make more informed trading decisions.
Unique Features: The specific combination of pullback logic, dynamic S/R, and multi-level TP/SL management is unique to SMRT Algo, offering features that are not readily available in standard or open-source indicators.
Educational and Support Resources: As with other tools in the SMRT Algo suite, this indicator comes with comprehensive educational resources and access to a supportive trading community, as well as 24/7 Discord support.
The educational resources and community support included with SMRT Algo ensure that users can maximize the indicators’ potential, offering guidance on best practices and advanced usage.
SMRT Algo believe that there is no magic indicator that is able to print money. Indicator toolkits provide value via their convenience, adaptability and uniqueness. Combining these items can help a trader make more educated; less messy, more planned trades and in turn hopefully help them succeed.
RISK DISCLAIMER
Trading involves significant risk, and most day traders lose money. All content, tools, scripts, articles, and educational materials provided by SMRT Algo are intended solely for informational and educational purposes. Past performance is not indicative of future results. Always conduct your own research and consult with a licensed financial advisor before making any trading decisions.

MTF WaveTrend [CryptoSea]The MTF WaveTrend Indicator is a sophisticated tool designed to enhance market analysis through multi-timeframe WaveTrend calculations. This tool is built for traders who seek to identify market momentum and potential reversals with higher accuracy.
In the example below, we can see all the choosen timeframes agree on bearish momentum.
Key Features
Multi-Timeframe WaveTrend Analysis: Tracks WaveTrend values across multiple timeframes to provide a comprehensive view of market momentum.
Customizable Colour Rules: Offers three different colour rules (Traditional, WT1 0 Rule, WT1 & WT2 0 Rule) to suit various trading strategies.
Timeframe Visibility Control: Allows users to enable or disable specific timeframes, providing flexibility in analysis.
Clear Visual Indicators: Uses color-coded squares and labels to clearly display WaveTrend status across different timeframes.
Candle Colouring Option: Includes a setting for neutral candle coloring to enhance chart readability.
This example shows what can happen when all timeframes start alligning with eachother.
How it Works
WaveTrend Calculation: Computes the WaveTrend oscillator by applying a series of exponential moving averages and scaling calculations.
Multi-Timeframe Data Aggregation: Utilizes the `request.security` function to gather and display WaveTrend values from various timeframes without repainting issues.
Conditional Plotting: Displays visual cues only when higher timeframes align with the selected timeframe, ensuring relevant and reliable signals.
Dynamic Colour Rules: Adjusts the indicator colors based on the chosen rule, whether it's a traditional crossover, WT1 crossing zero, or both WT1 & WT2 crossing zero.
Traditional: Colors are determined by the relationship between WT1 and WT2. If WT1 is greater than WT2, it is bullish (bullColour), otherwise bearish (bearColour).
WT1 0 Rule: Colors are based on whether WT1 is above or below zero. WT1 above zero is bullish (bullColour), below zero is bearish (bearColour).
WT1 & WT2 0 Rule: A more complex rule where both WT1 and WT2 need to be above zero for a bullish signal (bullColour) or both below zero for a bearish signal (bearColour). If WT1 and WT2 are not in agreement, a neutral color (neutralColour) is displayed.
This indicator will make sure that the lowest timeframe you can see data from will be the timeframe you are on. This is to avoid false signals as you cannot display 3 x 5 minute candles whilst looking at the 15 minute candle.
Application
Strategic Decision-Making: Assists traders in making informed decisions by providing detailed analysis of WaveTrend movements across different timeframes.
Trend Confirmation: Reinforces trading strategies by confirming potential reversals with multi-timeframe WaveTrend analysis.
Customized Analysis: Adapts to various trading styles with extensive input settings that control the display and sensitivity of WaveTrend data.
The MTF WaveTrend Indicator by is an invaluable addition to a trader's toolkit, offering depth and precision in market trend analysis to navigate complex market conditions effectively.
MTF Bollinger BandWidth [CryptoSea]The MTF Bollinger BandWidth Indicator is an advanced analytical tool crafted for traders who need to gauge market volatility and trend strength across multiple timeframes. This powerful indicator leverages the Bollinger BandWidth concept to provide a comprehensive view of price movements and volatility changes, making it ideal for those looking to enhance their trading strategies with multi-timeframe analysis.
Key Features
Multi-Timeframe Analysis: Allows users to monitor Bollinger BandWidth across various timeframes, providing a macro and micro perspective on market volatility.
Pivot Point Detection: Identifies crucial high and low pivot points, offering insights into potential support and resistance levels. Pivot points are dynamic and adjust based on the timeframe viewed, reflecting short-term fluctuations or longer-term trends.
Customizable Parameters: Includes options to adjust the length of the moving average, the standard deviation multiplier, and more, enabling traders to tailor the tool to their specific needs.
Dynamic Color Coding: Utilizes color changes to indicate different market conditions, aiding in quick visual assessments.
In the example below, notice how changes in BBW across different timeframes provide early signals for potential volatility increases or decreases.
How it Works
Calculation of BandWidth: Measures the percentage difference between the upper and lower Bollinger Bands, which expands or contracts based on market volatility.
High and Low Pivot Tracking: Automatically calculates and tracks the pivots in BBW values, which are critical for identifying turning points in market behavior. High and low levels will change depending on the timeframe, capturing distinct market behaviors from granular movements to broad trends.
Visual Alerts and Table Display: Highlights significant changes in BBW with visual alerts and provides a detailed table view for comparison across timeframes.
In the example below, BBW identifies a significant contraction followed by an expansion, suggesting a potential breakout.
Application
Strategic Market Entry and Exit: Assists traders in making well-informed decisions about when to enter and exit trades based on volatility cues.
Trend Strength Assessment: Helps in determining the strength of the prevailing market trend through detailed analysis of expansion and contraction periods.
Adaptable to Various Trading Styles: Suitable for day traders, swing traders, and long-term investors due to its customization capabilities and effectiveness across different timeframes.
The MTF Bollinger BandWidth Indicator is a must-have in the arsenal of traders who demand depth, accuracy, and responsiveness in their market analysis tools. Enhance your trading decisions by integrating this sophisticated indicator into your strategy to navigate the complexities of various market conditions effectively.

MTF Williams Vix Market Bottoms [CryptoSea]MTF Williams Vix Fix Indicator is a dynamic tool tailored for traders looking to capture market extremes with high precision. This multi-timeframe indicator leverages the concept of the Williams Vix Fix to spot potential reversals before they occur.
Key Features
Multi-Timeframe Analysis: Provides simultaneous visibility across multiple timeframes, enabling traders to assess market conditions comprehensively from a single chart.
Advanced Volatility Detection: Utilizes a modified Vix Fix formula to highlight extreme price deviations, which often precede significant market reversals.
Customizable Settings: Offers extensive input options to tweak the lookback periods, percentile thresholds, and visibility settings, aligning with various trading strategies.
Visual Band Indicators: Features upper bands and range highs that signal potential overbought and oversold conditions, enhancing trading decision-making.
Below, you can see how the indicator performs across different timeframes, providing valuable insights into market behavior.
How it Works
Vix Fix Calculation: Determines the worst-case 'panic' sell-offs in price as a percentage of the high, capturing the emotional extremes of the market.
Statistical Bands: Employs Bollinger bands over the Vix Fix values to define normal and extreme volatility conditions.
Color-Coded Indicators: Uses color differentiation to instantly highlight when readings surpass critical upper band or range high thresholds, signaling key trading opportunities.
For instance, in the analysis provided below, notice how the indicator flags significant market moves, allowing traders to anticipate potential entry or exit points.
Application
Risk Management: Aids in identifying extreme market conditions where prices may revert, helping in effective position sizing and risk management.
Strategic Planning: Enhances strategic trading plans by identifying not only when but also where market extremes may occur, considering multiple timeframes.
Customization: Adapts seamlessly to different market environments with adjustable settings for volatility thresholds and visual display preferences.
The MTF Williams Vix Fix Indicator by is an essential tool for traders aiming to leverage market volatility for optimal entry and exit, ensuring they are well-equipped to handle market extremes with confidence.

MTF Supertrend [CryptoSea]The MTF Supertrend Indicator is a versatile tool crafted to enhance trend analysis across multiple timeframes. Leveraging the reliable Supertrend formula, it provides traders with a comprehensive view of market trends and potential reversal points.
Key Features
Multi Timeframe Analysis: Tracks Supertrend signals over a variety of timeframes, offering a broad perspective on market direction.
Percentage Threshold Display: Filters out Supertrend data that is not within a specified percentage of the current price, keeping the display focused on relevant trends.
Adaptive Visual Display: Features a dynamic table that shows the current Supertrend status, which is fully customizable to the user's display preferences.
Customizable Sensitivity: Users can fine-tune the factor and ATR period settings, allowing for personalized trend sensitivity.
How it Works
Supertrend Calculation: Computes the Supertrend using the Average True Range (ATR) multiplied by a customizable factor, detecting changes in volatility and trend.
Higher Timeframe Filtering: Prioritizes higher timeframe trends over the current chart's timeframe to avoid chart clutter and focus on the most significant trends.
Colour-Coded Trends: Utilizes colour coding to clearly indicate bullish and bearish trends, aiding quick visual analysis.
Responsive Display Options: Includes a switchable table view to overlay trend information on the chart, with options for dark and light themes.
Benefits for Different Trading Styles
Day Traders: Use real-time updates to catch short-term trend reversals and ride the momentum for quick profits.
Swing Traders: Benefit from viewing medium to long-term trends to formulate strategies that span several days or weeks.
Position Traders: Utilize the monthly supertrend data to make long-term investment decisions based on prevailing market directions.
Application
Strategic Decision-Making: Assists traders in making informed decisions by providing a layered view of trend directions across timeframes.
Trend Confirmation: Reinforces trading strategies by confirming trends with higher timeframe Supertrend alignment.
Customized Analysis: Adapts to various trading styles with input settings that control the display and sensitivity of trend data.
The MTF Supertrend Indicator by is a powerful addition to the trader's toolkit, enhancing multi-timeframe trend analysis and contributing to a strategic trading approach in volatile markets.
RSI Graphique and Dashboard MTFMTF RSI Indicator - User Guide
Introduction:
The MTF RSI (Multi-Timeframe Relative Strength Index) Pine Script is designed to provide traders with a comprehensive view of the RSI (Relative Strength Index) across multiple timeframes. The script includes a primary chart displaying RSI values and a dashboard summarizing RSI trends for different time intervals.
Installation:
Copy the provided Pine Script.
Open the TradingView platform.
Create a new script.
Paste the copied code into the script editor.
Save and apply the script to your chart.
Primary Chart:
The primary chart displays RSI values for the selected timeframe (5, 15, 60, 240, 1440 minutes).
different color lines represent RSI values for different timeframes.
Overbought and Oversold Levels:
Overbought levels (70) are marked in red, while oversold levels (30) are marked in blue for different timeframes.
Dashboard:
The dashboard is a quick reference for RSI trends across multiple timeframes.
Each row represents a timeframe with corresponding RSI trend information.
Arrows (▲ for bullish, ▼ for bearish) indicate the current RSI trend.
Arrow colors represent the trend: blue for bullish, red for bearish.
Settings:
Users can customize the RSI length, background color, and other parameters.
The background color of the dashboard can be adjusted for light or dark themes.
Interpretation:
Bullish Trend: ▲ arrow and blue color.
Bearish Trend: ▼ arrow and red color.
RSI values above 70 may indicate overbought conditions, while values below 30 may indicate oversold conditions.
Practical Tips:
Timeframe Selection: Consider the trend alignment across different timeframes for comprehensive market analysis.
Confirmation: Use additional indicators or technical analysis to confirm RSI signals.
Backtesting: Before applying in live trading, conduct thorough backtesting to evaluate the script's performance.
Adjustment: Modify settings according to your trading preferences and market conditions.
Disclaimer:
This script is a tool for technical analysis and should be used in conjunction with other indicators. It is not financial advice, and users should conduct their own research before making trading decisions. Adjust settings based on personal preferences and risk tolerance. Use the script responsibly and at your own risk.
