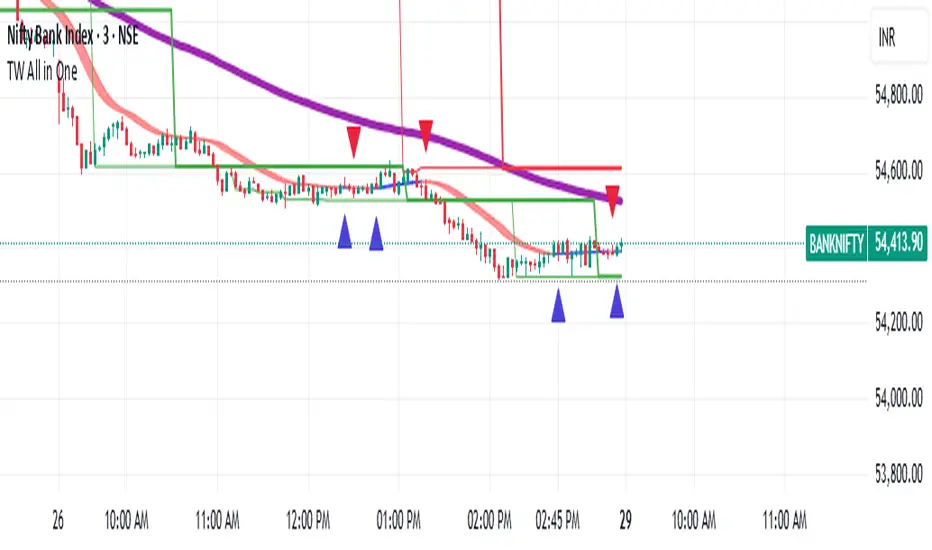
TW All in OneIts a overlap strategy, giving signals for buy and sell.
Mostly suitable for Bank Nifty. Nifty and crude oil
"nifty"に関するスクリプトを検索
Big Player Buy/Sell SignalHow It Works:
Detects volume spikes over SMA of recent volume.
Signals a buy if there’s a green candle near a recent swing low on high volume (possible big player accumulation).
Signals a sell if there’s a red candle near a swing high on high volume (possible big player distribution).
This is a proxy, not a direct measure of institutional trades, but it often works surprisingly well in liquid markets like Nifty 50 or Bank Nifty.
If you want, I can make an advanced version that combines RSI, EMA, and first occurrence detection for higher accuracy in catching big player moves.

✨Smart Option MACD: Bullish, Bearish, Neutral Logic by AKM ✨The **Smart Option MACD: Bullish, Bearish, Neutral Logic by AKM** is an advanced indicator designed for TradingView, tailored for option traders on indices like NIFTY. It automates options trend scanning by applying MACD analysis to both Call (CE) and Put (PE) options near the ATM (At-The-Money) strike, providing actionable market states—Bullish, Bearish, or Neutral—using distinct logic for both strikes and overall market context.
***
### Core Features
- **Option Selection Logic:** The script dynamically calculates ATM, CE, and PE strike prices based on the underlying index spot price and customizable user inputs for expiry, strike distance, and OTM/ITM shift.
- **MACD on Option Prices:** For both CE and PE symbols, the indicator computes the MACD (Moving Average Convergence Divergence) and Signal lines. It uses standard MACD settings: 12-period EMA (fast), 26-period EMA (slow), and 9-period Signal.
- **Strike Status Classification:**
- AZL 🔼: Indicates MACD > 0 for that option, signifying positive momentum.
- BZL 🔽: Indicates MACD 0 & crossover up), PE is bearish (MACD<0 & crossover down).
- **Bearish:** PE is bullish & crossover up, CE is bearish & crossover down.
- **Neutral:** All other scenarios—including mixed or undefined signals.
***
### Table Output
A real-time table is displayed on the chart (top-right) with key option and market details:
- Spot price
- ATM Strike
- CE/PE strike status (momentum + crossover logic)
- Option prices
- Overall market state, color-coded for clarity
***
### How to Use This Indicator
- **Entry Signal:** Use the Bullish/Bearish status for directional trades or option strategies. Bullish calls for buying or selling upward momentum options; Bearish favors downside trades. Neutral advises caution or range-bound trades.
- **Customizability:** Expiry, strike width, OTM/ITM offset, and chart resolution are user-controlled, allowing adaptation to different market contexts.
- **Best Practice:** Use alongside price action, support/resistance zones and other indicators to confirm options momentum, as MACD is powerful yet not infallible.
***
### Who Is It For?
- **Option traders** who want to automate trend/momentum detection for CE/PE strikes instead of manual chart switching.
- **Index traders** (NIFTY, BANKNIFTY...) seeking systematic edge in intraday/positional strategies tied to option momentum.
- **Technical analysts** interested in visual, rule-based signals combining options data and classic MACD logic.
***
The Smart Option MACD indicator streamlines multi-strike, multi-option momentum analysis and presents clear actionable logic directly on your chart for enhanced decision-making. Use it as a core part of your TradingView toolkit for options-focused market views.

DS Gurukul RoundupRoundup (Support & Resistance Indicator) For Bank Nifty
By DS Gurukul
To be used only for Bank Nifty.
Indicator Overview
The Round Figure Indicator identifies key psychological support and resistance levels based on round numbers. These levels often act as strong turning points in price action due to trader psychology and institutional order placement.
How It Works
Key Levels:
Mid Band (Black Solid Line): Major round number
Upper Band (Green Solid Line): Mid Band (resistance)
Lower Band (Red Solid Line): Mid Band (support)
Sub-Bands (Dotted Lines): ±100 levels for tighter zones
Alerts: Triggers when price touches any band, signaling potential reversals or breakouts.
Trading Strategy
✅ Bounce Trades:
Buy near Lower Band or Mid Sub-Lower with bullish confirmation (e.g., hammer candle).
Sell near Upper Band or Mid Sub-Upper with bearish rejection (e.g., shooting star).
✅ Breakout Trades:
Enter long on a close above Upper Band with volume.
Enter short on a close below Lower Band with momentum.
⚠️ Risk Management:
Place stops just beyond the opposite sub-band.
Avoid trading if price is stuck between mid/sub-bands (choppy market).
Why It Works
Round numbers attract limit orders (support/resistance).
Institutions use these levels for stop placements and profit targets.
Works across all timeframes (scalping to swing trading).
🔔 Tip: Combine with RSI/MACD for higher-probability trades!

JJ Highlight Time Ranges with First 5 Minutes and LabelsTo effectively use this Pine Script as a day trader , here’s how the various elements can help you manage trades, track time sessions, and monitor price movements:
Key Components for a Day Trader:
1. First 5-Minute Highlight:
- Purpose: Day traders often rely on the first 5 minutes of the trading session to gauge market sentiment, watch for opening price gaps, or plan entries. This script draws a horizontal line at the high or low of the first 5 minutes, which can act as a key level for the rest of the day.
- How to Use: If the price breaks above or below the first 5-minute line, it can signal momentum. You might enter a long position if the price breaks above the first 5-minute high or a short if it breaks below the first 5-minute low.
2. Session Time Highlights:
- Morning Session (9:15–10:30 AM): The market often shows its strongest price action during the first hour of trading. This session is highlighted in yellow. You can use this highlight to focus on the most volatile period, as this is when large institutional moves tend to occur.
- Afternoon Session (12:30–2:55 PM): The blue highlight helps you track the mid-afternoon session, where liquidity may decrease, and price action can sometimes be choppier. Day traders should be more cautious during this period.
- How to Use: By highlighting these key times, you can:
- Focus on key breakouts during the morning session.
- Be more conservative in your trades during the afternoon, as market volatility may drop.
3. Dynamic Labels:
- Top/Bottom Positioning: The script places labels dynamically based on the selected position (Top or Bottom). This allows you to quickly glance at the session's start and identify where you are in terms of time.
- How to Use: Use these labels to remind yourself when major time segments (morning or afternoon) begin. You can adjust your trading strategy depending on the session, e.g., being more aggressive in the morning and more cautious in the afternoon.
Trading Strategy Suggestions:
1. Momentum Trades:
- After the first 5 minutes, use the high/low of that period to set up breakout trades.
- Long Entry: If the price breaks the high of the first 5 minutes (especially if there's a strong trend).
- Short Entry: If the price breaks the low of the first 5 minutes, signaling a potential downtrend.
2. Session-Based Strategy:
- Morning Session (9:15–10:30 AM):
- Look for strong breakout patterns such as support/resistance levels, moving average crossovers, or candlestick patterns (like engulfing candles or pin bars).
- This is a high liquidity period, making it ideal for executing quick trades.
- Afternoon Session (12:30–2:55 PM):
- The market tends to consolidate or show less volatility. Scalping and mean-reversion strategies work better here.
- Avoid chasing big moves unless you see a clear breakout in either direction.
3. Support and Resistance:
- The first 5-minute high/low often acts as a key support or resistance level for the rest of the day. If the price holds above or below this level, it’s an indication of trend continuation.
4. Breakout Confirmation:
- Look for breakouts from the highlighted session time ranges (e.g., 9:15 AM–10:30 AM or 12:30 PM–2:55 PM).
- If a breakout happens during a key time window, combine that with other technical indicators like volume spikes , RSI , or MACD for confirmation.
---
Example Day Trader Usage:
1. First 5 Minutes Strategy: After the market opens at 9:15 AM, watch the price action for the first 5 minutes. The high and low of these 5 minutes are critical levels. If the price breaks above the high of the first 5 minutes, it might indicate a strong bullish trend for the day. Conversely, breaking below the low may suggest bearish movement.
2. Morning Session: After the first 5 minutes, focus on the **9:15 AM–10:30 AM** window. During this time, look for breakout setups at key support/resistance levels, especially when paired with high volume or momentum indicators. This is when many institutions make large trades, so price action tends to be more volatile and predictable.
3. Afternoon Session: From 12:30 PM–2:55 PM, the market might experience lower volatility, making it ideal for scalping or range-bound strategies. You could look for reversals or fading strategies if the market becomes too quiet.
Conclusion:
As a day trader, you can use this script to:
- Track and react to key price levels during the first 5 minutes.
- Focus on high volatility in the morning session (9:15–10:30 AM) and **be cautious** during the afternoon.
- Use session-based timing to adjust your strategies based on the time of day.

Relative volume zone + Smart Order Flow Dynamic S/ROverview:
The Relative Volume Zone + Smart Order Flow with Dynamic S/R indicator is designed to help traders identify key trading opportunities by combining multiple technical components. This script integrates relative volume analysis, order flow detection, VWAP, RSI filtering, and dynamic support and resistance levels to offer a comprehensive view of the market conditions. It is particularly effective on shorter timeframes (M5, M15), making it suitable for scalping and day trading strategies.
Key Components:
1. Relative Volume Zones:
• The script calculates the relative volume by comparing the current volume with the average volume over a defined lookback period (volLookback). When the relative volume exceeds a specified multiplier (volMultiplier), it indicates a high volume zone, signaling potential accumulation or distribution areas.
• Purpose: Identifies high-volume trading zones that may act as significant support or resistance, indicating possible entry or exit points.
2. Smart Order Flow Analysis:
• The indicator uses Volume Delta (the difference between buying and selling volume) and a Cumulative Delta to detect order imbalances in the market.
• Order Imbalance is identified using a moving average of the Volume Delta (orderImbalance), which helps highlight hidden buying or selling pressure.
• Purpose: Reveals market sentiment by showing whether buyers or sellers dominate the market, aiding in the identification of trend reversals or continuations.
3. VWAP (Volume Weighted Average Price):
• VWAP is calculated over a default daily length (vwapLength) to show the average price a security has traded at throughout the day, based on both volume and price.
• Purpose: Provides insight into the fair value of the asset, indicating whether the market is in an accumulation or distribution phase.
4. RSI (Relative Strength Index) Filter:
• RSI is used to filter buy and sell signals, preventing trades in overbought or oversold conditions. It is calculated using a specified period (rsiPeriod).
• Purpose: Reduces false signals and improves trade accuracy by only allowing trades when RSI conditions align with volume and order flow signals.
5. Dynamic Support and Resistance Levels:
• The script dynamically plots support and resistance levels based on recent swing highs and lows (swingLookback).
• Purpose: Identifies potential reversal zones where price action may change direction, allowing for more precise entry and exit points.
How It Works:
• Buy Signal:
A buy signal is generated when:
• The price enters a high-volume zone.
• The price crosses above a 5-period moving average.
• The cumulative delta shows more buying pressure (cumulativeDelta > SMA of cumulativeDelta).
• The RSI is below 70 (not in overbought conditions).
• Sell Signal:
A sell signal is generated when:
• The price enters a high-volume zone.
• The price crosses below a 5-period moving average.
• The cumulative delta shows more selling pressure (cumulativeDelta < SMA of cumulativeDelta).
• The RSI is above 30 (not in oversold conditions).
• Dynamic Support and Resistance Lines:
Drawn based on recent swing highs and lows, these lines provide context for potential price reversals or breakouts.
• VWAP and Order Imbalance Lines:
Plotted to show the average traded price and highlight order flow shifts, helping to validate buy/sell signals.
How to Use:
1. Apply the Indicator:
Add the script to your chart and adjust the settings to match your trading style and preferred timeframe (optimized for M5/M15).
2. Interpret the Signals:
Use the buy and sell signals in conjunction with dynamic support/resistance, VWAP, and order imbalance lines to identify high-probability trade setups.
3. Monitor Alerts:
Set alerts for significant order flow events to receive notifications when there is a positive or negative order imbalance, indicating potential market shifts.
What Makes It Unique:
This script is unique because it combines multiple market analysis tools — relative volume zones, smart order flow, VWAP, RSI filtering, and dynamic support/resistance — to provide a well-rounded, multi-dimensional view of the market. This integration allows traders to make more informed decisions by validating signals across various indicators, enhancing overall trading accuracy and effectiveness.

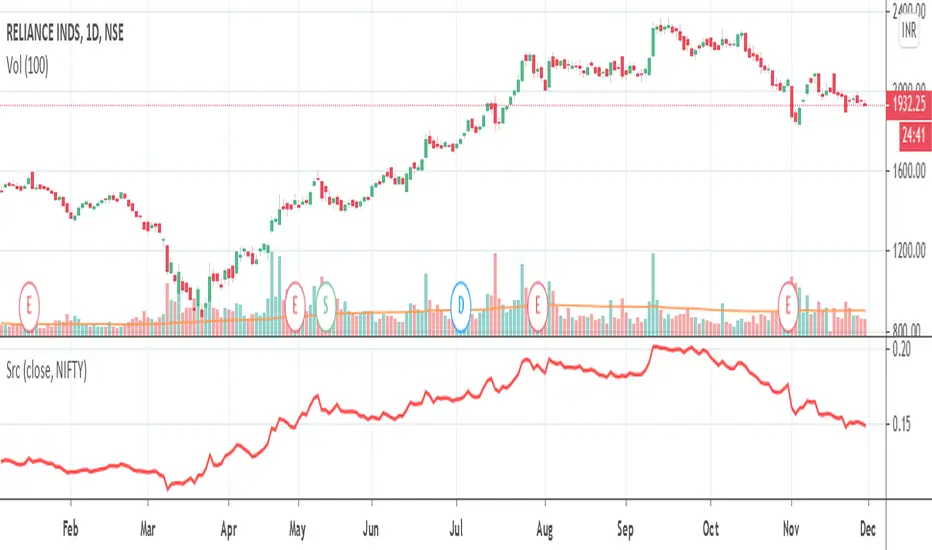
Saral Relative StrengthRelative Strength Indicator
### Overview
The Relative Strength (RS) Indicator is a robust tool designed to measure the performance of a security relative to a benchmark or another security. Unlike traditional indicators, this RS Indicator calculates the outperformance or underperformance in percentage terms, providing a clear and concise comparison.
The equation for calculation can be found in the code itself. This equation compares how much a security's price has changed over a given period (len) relative to the change in price of a benchmark over the same period. The result is expressed as a percentage, showing whether the security has outperformed or underperformed the benchmark. A positive RS value indicates outperformance, while a negative value signals underperformance.
Basically, this indicator is an enhanced version of 'Relative Strength' indicator of 'BharatTrader' Sir with added features like automatic divergence plotting, color-coded filled area and sector names for NSE F&O securities. Default values for some of the parameters are based on discussion by Subhadip Nandy Sir in Trader's Talk with Mr. Rohit Katwal.
### Input Parameters:
Source: The price of a security used in the calculation, with the default being the 'close' price.
Comparative Symbol: Ticker ID of the comparative security, with the default set to NIFTY 50.
Period-RS: The period for calculating the RS line, with a default of 22. The RS line measures the relative performance of the security against the benchmark, helping to identify outperformance or underperformance over time.
Period-MA: The period for calculating the Simple Moving Average (SMA) overlay on the RS line, with a default of 11. The SMA provides a smoothed view of the RS line, helping to identify trends more clearly.
Lookback - Zero Line Trend: Zero Line Trend look-back period, used to determine the angle of the RS line, with a default of 5. This parameter influences the color of the Zero Line based on whether the RS line’s angle is positive or negative.
Lookback - Divergence: Divergence look-back period, with a default of 2, used to detect divergence between the price and the RS line.
Display MA Line: Controls the display of the SMA line. When enabled, the SMA line is plotted over the RS line to indicate trend strength.
Toggle RS Color on MA Crossovers: Controls the color of the RS line. If disabled, the RS line is purple. If enabled, the RS line changes color based on its position relative to the SMA: green for RS > MA, red for RS < MA.
Display Zero Line Trend: Controls the display of the Zero Line. If disabled, the Zero Line is black. If enabled, the Zero Line’s color changes to green or maroon based on the RS line’s angle over time.
Display Divergence: Controls the display of divergence dots on the RS line, indicating potential reversal points.
Display Filled Area: Controls whether the area between the Zero Line and the RS line is filled with color. The fill color changes based on the relationship of the RS line with the SMA & Zero Line as given below.
- Dark Green: RS > 0 and RS > MA, indicating strong outperformance.
- Light Green: RS > 0 and RS < MA, indicating weakening outperformance.
- Dark Red: RS < 0 and RS < MA, indicating strong underperformance.
- Light Red: RS < 0 and RS > MA, indicating weakening underperformance.
Display Sector Name: Controls the display of sector names for NSE F&O securities, helping to plot RS with sectoral indices.
### Key Features:
RS Line:
The RS line represents the relative performance of a security against a benchmark over a specified period (default 22). It helps traders identify whether the security is outperforming or underperforming the benchmark.
SMA Overlay:
A Simple Moving Average (SMA) line is plotted over the RS line, with a default period of 11. The SMA provides a smoothed trend of the RS, making it easier to identify consistent performance trends.
Trend-Sensitive Zero Line:
The Zero Line’s color adapts based on the RS line’s trend:
- Green: Positive angle of the RS line, indicating upward momentum.
- Maroon: Negative angle, indicating downward momentum.
The color can be toggled, with an option to display the Zero Line in black.
Divergence Detection:
Automatically detects and highlights divergences.
- Positive Divergence: RS line rises while the price falls, marked by blue dots.
- Negative Divergence: RS line falls while the price rises, marked by black dots.
Color-Coded Fill Area:
The area between the RS line and the Zero Line is filled with color to visually distinguish different market conditions, with Dark and Light colors providing insight into the strength of the performance:
- Dark Green: Indicates strong outperformance (RS > 0 and RS > MA), suggesting the security is showing significant strength compared to the benchmark.
- Light Green: Indicates weakening outperformance (RS > 0 and RS < MA), signaling that while the security is still outperforming, its strength is diminishing.
- Dark Red: Indicates strong underperformance (RS < 0 and RS < MA), showing the security is significantly weaker than the benchmark.
- Light Red: Indicates weakening underperformance (RS < 0 and RS > MA), suggesting the security is still underperforming but may be regaining some strength.
Sectoral Strength:
Displays sector names for NSE F&O securities, helping users to compare the RS of individual securities with their respective sectoral indices. Comparative Security can be changed easily based on this sector name. Users need not to remember sector names for individual securities.
If any security is not categorized in a specific sector, CNX500 has been considered as a default sector for NSE F&O securities. For other securities, NIFTY50 has been considered as a default sector.

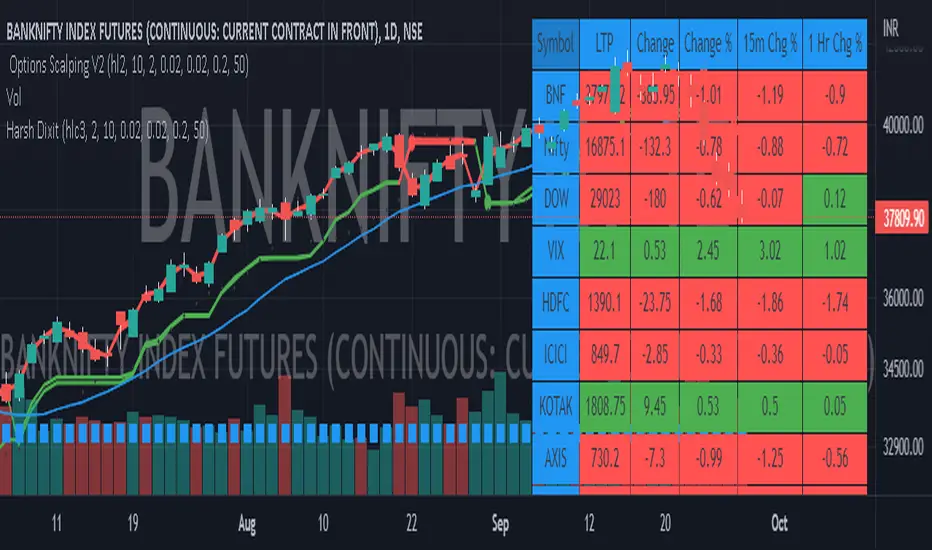
Options Scalping by harsh gbychi this is my script.
Bank Nifty Live OI Change Chart can give very useful clues for intraday support and resistance levels for Bank Nifty. If there is more addition in Open Interest at 12200 Calls, that would mean most market players are comfortable writing call options at this level because they believe it to be a strong resistance. That would be bearish indication for BankNifty.
Similarly is there is highest writing in 12000 Puts that would indicate strong intraday support at that level.
Third Scenario: There is good amount of Open Interest increase in 12000 PE and 12200 CE –> this means we should expect a range bound session for the day, as both bears and bulls are comfortable holding the 12200 and 12000 levels respectively.
Following factors could improve reliability of BankNifty OI Change analysis:
1) Put Call Ratio: Higher PCR means bullishness. If there is more writing at 12000PE and PCR is high and increasing during the day that would add to bullish scenario
If the PCR is declining for the day and more writing happening at 12200CE then this adds to bearishness.
2) Close to expiry: The closer to expiry we are, the more reliable the ‘Open Interest’ analysis. Early in the series, the OI analysis is less reliable.
3) More Players: As the number of players increase, the OI analysis become more reliable.
4) Bid-ask Spread: The lower the bid-ask spread the more reliable the OI analysis.
5) Technical Indicators: The best trades are found by combining OI analysis with other technical indicators. MACD, RSI, Channel lines and EW count give best results with Open Interest Analysis.
RSI+OBVthis strategy works on the basis of crossovers of RSI at different period and OBV at different periods (separately). I am using it for Nifty and Bank Nifty. Entry for long can be taken when green bar appears; and exit has to be done when it disappears. Entry for short has to be taken when red bar appears; and exit has to be done when it disappears.
With little help from price action good results can be achieved.

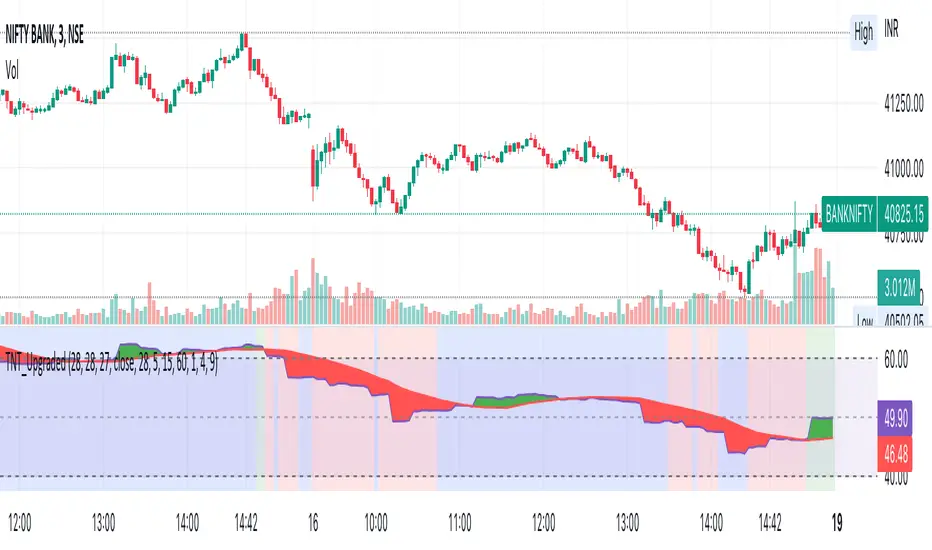
TNT_UpgradedThe background of the indicator to show TrendingUp (Green) / TrendingDown (Red) / Range Bound (Blue) Regions.
The concept is very simple, at each candle we look at the size of the candle and use a moving average of these candle body size (ABS (close-open)) and compare it agains a double smoothened average, i.e. moving average of this average to find trending or not trending periods.
In the upgrade the moving average is now looking only at the current day for intraday timeframe, i.e. in the first 5 bars it is an average of last 5 values, for last 10 candles it is an average of 10 values with the max limited to 28 that is for candle 28 onwards the average is always for 28 candles for default values or as defined by user.
I find it useful primarily for entry in options, a green background is more favourable for call option buying, a red background is favourable for put option buying and blue background is more favourable for option selling.
The coloured ranges show the direction bias, this has been designed using RSI on 3 timeframes with different weight-ages, all customisable by the user.
PS, I only trade Bank Nifty for intraday, all my observations are driven only by Bank Nifty.
Sukrut relative strengthI am publising Relative Strength Comparative.
It is be used to compare a Stock's Performance against another stock/index (Default NIFTY50)
Example: ITC vs NIFTY 50 it will be ITC / NIFTY
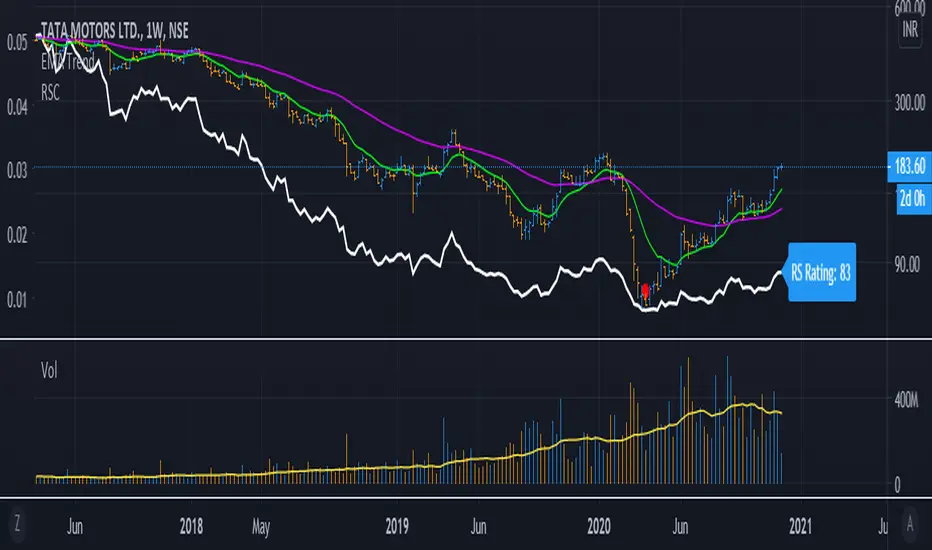
RelativeStrengthComparative_IBD_YRKI am publising Relative Strength Comparative.
It is be used to compare a Stock's Performance against another stock/index (Default NIFTY50)
I also devised a Plot RS Rating which is inspired from IBD's RS Rating and matches to some extent. You can turn off/on the RS Rating as per need.
Example: ITC vs NIFTY 50 it will be ITC / NIFTY
The Indicator can be used in Multiple ways:
1) Check Relative Strength
2) Check RS Rating (This is not Accurate as of now since IBD compares the ratings of all the stocks in an Exchange)
3) Can be used as a Spread Chart for the Division (We need to not divide every time we change Stocks)
4) Design a Template exactly as MarketSmith by using the TradingView feature of "Move to --> Existing Pane Above"
The Formula i used for RS Rating is below with more weightage on the 3 month performance and lesser on 12 month Performance. I am open to Modification of this Formula if a better suggestion
// relative strength IBD style
ThreeMthRS = 0.4*(close/close)
SixMthRS = 0.2*(close/(close*2))
NineMthRS = 0.2*(close/(close*3))
TwelveMthRS = 0.2*(close/(close*4))
Dhananjay Volatility stop strategy v1.0
Sharing one more strategy after getting good feedback on my earlier published strategy.
This is simple volatility stop strategy where in we are using VStop as entry and exit point.
Again smart traders can add MA to decide the trend and can avoid trading in opposite direction of trend which will help them to minimize loss making trades.
There are more than 1 parameters which traders can use/change to make this strategy compatible to their instrument.
To understand what is VStop use google.com :-)
Looking forward to receiving feedback from all of you.

HL MovingAvg2Line Cross Dhananjay
Sharing the simple trend following trading strategy, traders can add their own rules in this, to minimise the losses and maximise the profits. Like below.
1. Go long only if price is above 189 days EMA/SAM
2. Exit position when high or low of previous candle is breached in the opposite direction of the trend.
3. Go long only if price is in up trend on higher time frame charts and go short when price is down trend of higher time frame charts.
Stop loss, target and other things can also be decided by the trader.
Idea is to capture the short term trend to trade in FnO or 2/3 days position in underlying instrument.
Traders can optimise the length of the Moving average so that your traded is set for maximum profit giving settings for this strategy. Different instruments responds to different moving averages because of different volatility.
Idea is to go long when price closes above 9 days EMA of Highs and exit and go short whenever price closes below 9 days EMA of lows, exit short when first condition meets after short trade.
I ma not that good with scripts, have many such ideas, interested script writers can get in touch with me so that we can create trading systems which have grater success rate .

ChartAdvise_Action_ReactionThis script has finetuned the dynamic shifting of prices seen in the previous script.

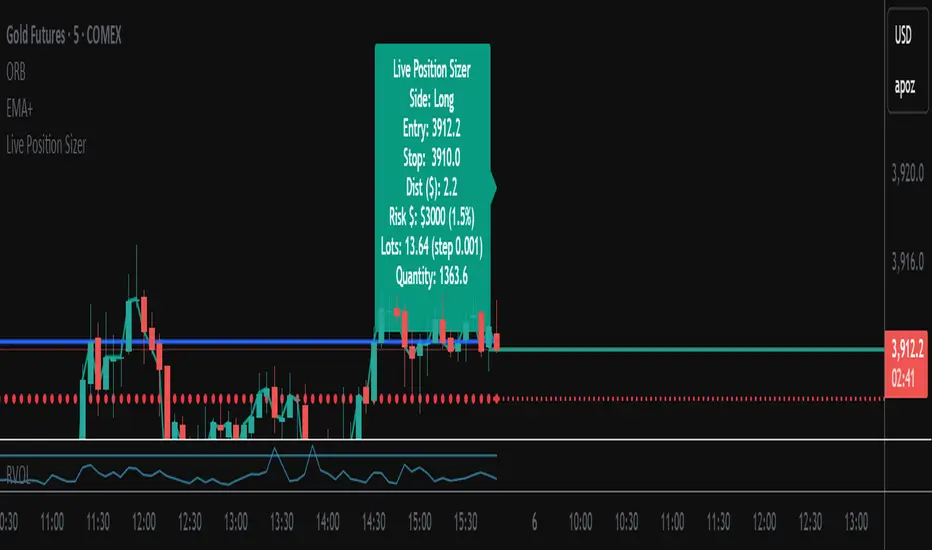
Live Position SizerThis position calculator locks onto the live price in real time and calculates your lot and quantity size for you. Best for scalping if you don't want to open a limit order. You input all the necessary data (Account size, risk, SL placement, LONG/SHORT position, etc...) It also has a nifty feature of allowing you the ability to see TP brackets (+1R, +2R, +3R).
The best way I have used it is seeing where my potential SL will go before I consider opening a position and inputting that. Then when I'm ready to open a position, I already have it calculated for me.
MA Crossover BIFTY BNF with Broker Inputs//@version=6
strategy("MA Crossover with Broker Inputs", overlay=true, margin_long=100, margin_short=100, process_orders_on_close=true)
// === BROKER & ORDER SETTINGS ===
broker = input.string("Dhan", title="Broker", options= )
orderType = input.string("MKT", title="Order Type", options= )
clientID = input.string("", title="Client ID (Optional)")
secretKey = input.string("", title="Secret Key (from JSON)")
// === INSTRUMENT SELECTION ===
instrument = input.string("BANKNIFTY", title="Select Instrument", options= )
expiryMode = input.string("Auto", title="Expiry Mode", options= )
manualExpiry = input.string("17Dec2025", title="Manual Expiry Date (if Manual Mode)")
optionType = input.string("CE", title="Option Type", options= )
strikeSel = input.string("ATM", title="Strike Selection", options= )
// === RISK MANAGEMENT ===
stopLossPts = input.int(50, title="Stop Loss (points)")
takeProfitPts = input.int(100, title="Take Profit (points)")
// === STRATEGY LOGIC: Moving Average Crossover ===
fastLength = input.int(9, title="Fast MA Length")
slowLength = input.int(18, title="Slow MA Length")
price = close
maFast = ta.sma(price, fastLength)
maSlow = ta.sma(price, slowLength)
// Crossover Long
if (ta.crossover(maFast, maSlow))
strategy.entry("Long", strategy.long, comment="MA Crossover Long")
// Crossunder Short
if (ta.crossunder(maFast, maSlow))
strategy.entry("Short", strategy.short, comment="MA Crossover Short")
// Apply SL and TP
strategy.exit("Exit Long", from_entry="Long", stop=close - stopLossPts, limit=close + takeProfitPts)
strategy.exit("Exit Short", from_entry="Short", stop=close + stopLossPts, limit=close - takeProfitPts)
// === PLOTS ===
plot(maFast, color=color.green, title="Fast MA")
plot(maSlow, color=color.red, title="Slow MA")


LA - Opening Price based Previous day Range PivotThis "LA - Opening Price based Previous day Range Pivot" indicator is a custom technical analysis tool designed for Trading View charts. It plots support and resistance levels (often referred to as pivots or ranges) based on the current opening price combined with the previous period's trading range. The "previous period" can be daily, weekly, or monthly, making it a multi-timeframe tool. These levels are projected using Fibonacci-inspired multipliers to create potential breakout or reversal zones.
The core idea is inspired by concepts like the Opening Range Breakout (ORB) strategy or Fibonacci pivots, but it's customized here to use a dynamic range calculation (the maximum of several absolute price differences) rather than a simple high-low range. This makes it more robust for volatile markets. Levels are symmetric above (resistance) and below (support) the opening price, helping traders identify potential entry/exit points, stop-losses, or targets. This will be useful when there is a gap-up/down as in Nifty/Sensex .
Purpose of the Indicator:
To visualize potential support/resistance zones for the current trading session based on the opening price and historical range data. This helps traders anticipate price movements, such as breakouts above resistance or bounces off support
Use Cases:
Intraday Trading: On lower timeframes (e.g., 5-min or 15-min charts), it shows daily levels for short-term trades.
Swing Trading: On higher timeframes (e.g., hourly or daily), it displays weekly/monthly levels for longer holds.
Range Identification: The filled bands highlight "zones" where price might consolidate or reverse.
Conditional Display: Levels only appear on appropriate timeframes (e.g., daily levels on intraday charts <60min), preventing clutter.
Theoretical Basis: It builds on pivot point theory, where the opening price acts as a central pivot. Multipliers (e.g., 0.618 for Fibonacci golden ratio) project levels, assuming price often respects these ratios due to market psychology.
How Calculations Work
Let's dive into the math with examples. Assume a stock with:
Current daily open (cdo) = $100
Previous daily high (pdh) = $105, low (pdl) = $95, close (pdc) = $102, close 2 days ago (pdc2) = $98
Step 1: Dynamic Range Calculation (var_d2):
This is the max of:
|pdh - pdc2| = |105 - 98| = 7
|pdl - pdc2| = |95 - 98| = 3
|pdh - pdl| = |105 - 95| = 10 (previous day range)
|pdh - cdo| = |105 - 100| = 5
|pdl - cdo| = |95 - 100| = 5
|pdc - cdo| = |102 - 100| = 2
|pdc2 - cdo| = |98 - 100| = 2
Max = 10 (so range = 10). This ensures the range accounts for gaps and extended moves, not just high-low.
Step 2: Level Projections:
Resistance (above open): Open + (Range * Multiplier)
dre6 = 100 + (10 * 1.5) = 115
dre5 = 100 + (10 * 1.27) ≈ 112.7
... down to dre0 = 100 + (10 * 0.1) = 101
dre50 = 100 + (10 * 0.5) = 105 (midpoint)
Support (below open): Open - (Range * Multiplier)
dsu0 = 100 - (10 * 0.1) = 99
... up to dsu6 = 100 - (10 * 1.5) = 85
Without Indicator
With Indicator
Pros and Cons
Pros:
Multi-Timeframe Flexibility: Seamlessly integrates daily, weekly, and monthly levels, useful for aligning short-term trades with longer trends (e.g., intraday breakout confirmed by weekly support).
Dynamic Range Calculation: Unlike standard pivots (just (H+L+C)/3), it uses max of multiple diffs, capturing gaps/volatility better—great for stocks with overnight moves.
Customizable via Inputs: Users can toggle levels, adjust multipliers, or change timeframes without editing code. Inline inputs keep the UI clean.
Visual Aids: Filled bands make zones obvious; conditional colors highlight "tight" vs. "wide" ranges (e.g., for volatility assessment).
Fibonacci Integration: Levels based on proven ratios, appealing to technical traders. Symmetric supports/resistances simplify strategy building (e.g., buy at support, sell at resistance).
No Repainting: Uses historical data with lookahead, so levels are fixed once calculated—reliable for back-testing.
Cons:
Chart Clutter: With all toggles on, 50+ plots/fills can overwhelm the chart, especially on mobile or small screens. Requires manual disabling.
Complexity for Beginners: Many inputs and calculations; without understanding fib ratios or range logic, it might confuse new users.
Performance Overhead: On low timeframes (e.g., 1-min), fetching higher TF data multiple times could lag, especially with many symbols or back-tests.
Assumes Volatility Persistence: Relies on previous range projecting future moves; in low-vol markets (e.g., sideways trends), levels may be irrelevant or too wide/narrow.
No Alerts or Signals: Purely visual; no built-in buy/sell alerts or crossover conditions—users must add separately.
Hardcoded Styles/Colors: Limited customization without code edits (e.g., can't change line styles via inputs).
Also, not optimized for non-stock assets (e.g., forex with 24/7 trading).
In summary, this is a versatile pivot tool for range-based trading based on Opening price, excelling in volatile markets but requiring some setup. If you're using it, start with defaults on a daily chart and toggle off unnecessary levels.

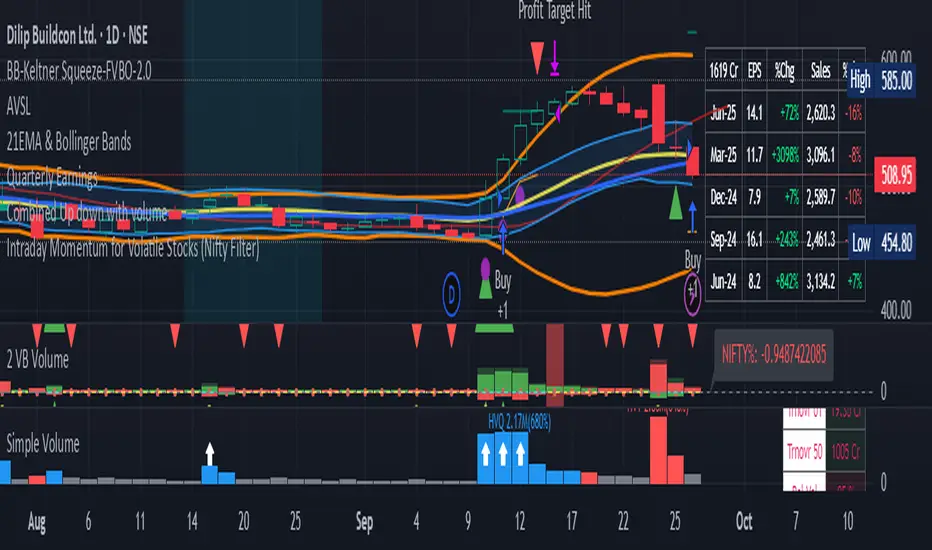
Intraday Momentum for Volatile Stocks 29.09The strategy targets intraday momentum breakouts in volatile stocks when the broader market (Nifty) is in an uptrend. It enters long positions when stocks move significantly above their daily opening price with sufficient volume confirmation, then manages the trade using dynamic ATR-based stops and profit targets.
Entry Conditions
Price Momentum Filter: The stock must move at least 2.5% above its daily opening price, indicating strong bullish momentum. This percentage threshold is customizable and targets gap-up scenarios or strong intraday breakouts.
Volume Confirmation: Daily cumulative volume must exceed the 20-day average volume, ensuring institutional participation and genuine momentum. This prevents false breakouts on low volume.
Market Regime Filter: The Nifty index must be trading above its 50-day SMA, indicating a favorable market environment for momentum trades. This macro filter helps avoid trades during bearish market conditions.
Money Flow Index: MFI must be above 50, confirming buying pressure and positive money flow into the stock. This adds another layer of momentum confirmation.
Time Restriction: Trades are only initiated before 3:00 PM to ensure sufficient time for position management and avoid end-of-day volatility.
Exit Management
ATR Trailing Stop Loss: Uses a 3x ATR multiplier for dynamic stop-loss placement that trails higher highs, protecting profits while giving trades room to breathe. The trailing mechanism locks in gains as the stock moves favorably.
Profit Target: Set at 4x ATR above the entry price, providing a favorable risk-reward ratio based on the stock's volatility characteristics. This adaptive approach adjusts targets based on individual stock behavior.
Position Reset: Both stops and targets reset when not in a position, ensuring fresh calculations for each new trade.
Key Strengths
Volatility Adaptation: The ATR-based approach automatically adjusts risk parameters to match current market volatility levels. Higher volatility stocks get wider stops, while calmer stocks get tighter management.
Multi-Timeframe Filtering: Combines intraday price action with daily volume patterns and market regime analysis for robust signal generation.
Risk Management Focus: The strategy prioritizes capital preservation through systematic stop-loss placement and position sizing considerations.
Considerations for NSE Trading
This strategy appears well-suited for NSE intraday momentum trading, particularly for mid-cap and small-cap stocks that exhibit high volatility. The Nifty filter helps align trades with broader market sentiment, which is crucial in the Indian market context where sectoral and index movements strongly influence individual stocks.
The 2.5% threshold above open price is appropriate for volatile NSE stocks, though traders might consider adjusting this parameter based on the specific stocks being traded. The strategy's emphasis on volume confirmation is particularly valuable in the NSE environment where retail participation can create misleading price movements without institutional backin
Relative Sector Index Benchmarking by QuantxQuantX Relative Strength helps traders identify whether a stock is outperforming or underperforming NIFTY. It uses a clean histogram with background highlights and a trend line to spot market leaders, laggards, and strength reversals quickly.

Smart Index Levels — GSK-VIZAG-AP-INDIA📌 Smart Index Levels — GSK-VIZAG-AP-INDIA
Smart Index Levels is a versatile support and resistance plotting tool designed for intraday, weekly, and monthly analysis.
It automatically generates key price zones based on user-defined step sizes, helping traders visualize important market levels more clearly.
🔹 Features
Daily / Weekly / Monthly Modes
Switch easily between daily, weekly, or monthly reference levels.
Customizable Level Steps
Choose step intervals of 50 or 100 points for cleaner index-based zones.
Support & Resistance Zones
Auto-draws multiple support and resistance levels around the opening base price.
Mid-Level Marking
Highlights the nearest “mid” price level for balance reference.
Weekly High/Low Tracking (Optional)
Plots dynamic weekly high & low levels with dotted lines.
Monthly High/Low Tracking (Optional)
Displays monthly high & low levels for broader market context.
Custom Market Session Timing
Define your own market open and close times.
Line Style & Colors
Fully customizable line styles (solid, dashed, dotted) and colors.
⚙️ How It Works
At the start of the selected session (daily, weekly, or monthly), the script identifies the opening reference price.
From this base, it calculates and draws support and resistance levels at fixed step intervals.
Optionally, it overlays weekly and monthly high/low levels for additional perspective.
This provides a structured price map that helps you quickly spot potential reaction zones, without cluttering the chart.
🖥️ Best Use Cases
Intraday index traders who want quick reference levels (Nifty, BankNifty, etc.)
Swing traders who prefer weekly and monthly zones for context.
Anyone looking for clean, rule-based support/resistance plotting.
⚠️ Disclaimer
This indicator is for educational and informational purposes only.
It does not provide financial advice or trading signals. Always use in combination with your own analysis and risk management.

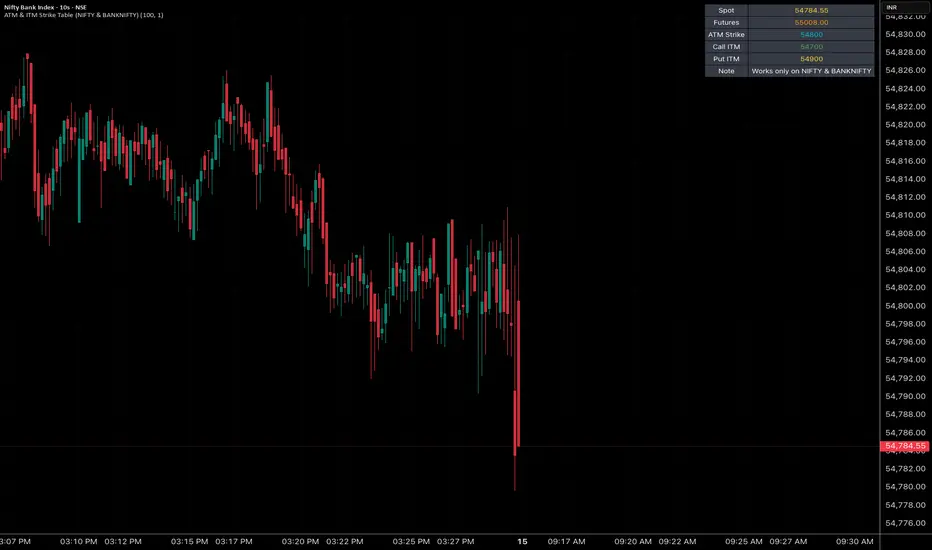
ATM & ITM Strike Table (NIFTY & BANKNIFTY)This script is like a cheat sheet for option traders.
When you put it on your chart, it shows you a small table with:
The current spot price (the real market price).
The futures price (another version of the same index that sometimes trades a bit higher or lower).
The ATM strike (the strike price closest to the market price).
Which call option and put option are “in the money” and most relevant right now.
A little note to remind you if you’re looking at the right chart.
In short:
It saves you from doing mental math every time by automatically pointing out the key option strike prices you should be aware of.