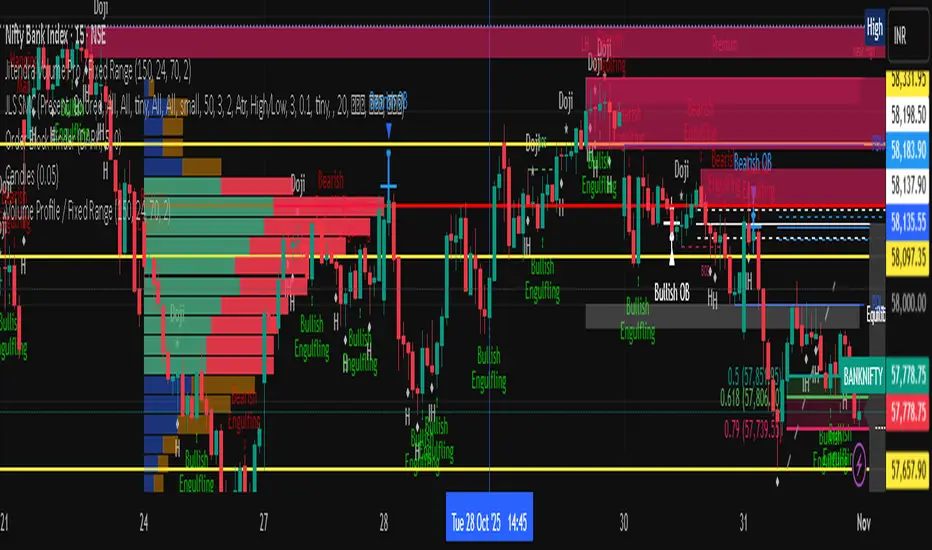
Jitendra Volume Pro / Fixed RangeHello All,
This script calculates and shows Volume Profile for the fixed range. Recently we have box.new() feature in Pine Language and it's used in this script as an example. Thanks to Pine Team and Tradingview!..
Sell/Buy volumes are calculated approximately!.
Options:
"Number of Bars" : Number of the bars that volume profile will be calculated/shown
"Row Size" : Number of the Rows
"Value Area Volume %" : the percent for Value Area
and there are other options for coloring and POC line style
Enjoy!
Jitendra Sankpal
Bull Run Galaxy
2.11.2025
"poc"に関するスクリプトを検索
3D Institutional Battlefield [SurgeGuru]Professional Presentation: 3D Institutional Flow Terrain Indicator
Overview
The 3D Institutional Flow Terrain is an advanced trading visualization tool that transforms complex market structure into an intuitive 3D landscape. This indicator synthesizes multiple institutional data points—volume profiles, order blocks, liquidity zones, and voids—into a single comprehensive view, helping you identify high-probability trading opportunities.
Key Features
🎥 Camera & Projection Controls
Yaw & Pitch: Adjust viewing angles (0-90°) for optimal perspective
Scale Controls: Fine-tune X (width), Y (depth), and Z (height) dimensions
Pro Tip: Increase Z-scale to amplify terrain features for better visibility
🌐 Grid & Surface Configuration
Resolution: Adjust X (16-64) and Y (12-48) grid density
Visual Elements: Toggle surface fill, wireframe, and node markers
Optimization: Higher resolution provides more detail but requires more processing power
📊 Data Integration
Lookback Period: 50-500 bars of historical analysis
Multi-Source Data: Combine volume profile, order blocks, liquidity zones, and voids
Weighted Analysis: Each data source contributes proportionally to the terrain height
How to Use the Frontend
💛 Price Line Tracking (Your Primary Focus)
The yellow price line is your most important guide:
Monitor Price Movement: Track how the yellow line interacts with the 3D terrain
Identify Key Levels: Watch for these critical interactions:
Order Blocks (Green/Red Zones):
When yellow price line enters green zones = Bullish order block
When yellow price line enters red zones = Bearish order block
These represent institutional accumulation/distribution areas
Liquidity Voids (Yellow Zones):
When yellow price line enters yellow void areas = Potential acceleration zones
Voids indicate price gaps where minimal trading occurred
Price often moves rapidly through voids toward next liquidity pool
Terrain Reading:
High Terrain Peaks: High volume/interest areas (support/resistance)
Low Terrain Valleys: Low volume areas (potential breakout zones)
Color Coding:
Green terrain = Bullish volume dominance
Red terrain = Bearish volume dominance
Purple = Neutral/transition areas
📈 Volume Profile Integration
POC (Point of Control): Automatically marks highest volume level
Volume Bins: Adjust granularity (10-50 bins)
Height Weight: Control how much volume affects terrain elevation
🏛️ Order Block Detection
Detection Length: 5-50 bar lookback for block identification
Strength Weighting: Recent blocks have greater impact on terrain
Candle Body Option: Use full candles or body-only for block definition
💧 Liquidity Zone Tracking
Multiple Levels: Track 3-10 key liquidity zones
Buy/Sell Side: Different colors for bid/ask liquidity
Strength Decay: Older zones have diminishing terrain impact
🌊 Liquidity Void Identification
Threshold Multiplier: Adjust sensitivity (0.5-2.0)
Height Amplification: Voids create significant terrain depressions
Acceleration Zones: Price typically moves quickly through void areas
Practical Trading Application
Bullish Scenario:
Yellow price line approaches green order block terrain
Price finds support in elevated bullish volume areas
Terrain shows consistent elevation through key levels
Bearish Scenario:
Yellow price line struggles at red order block resistance
Price falls through liquidity voids toward lower terrain
Bearish volume peaks dominate the landscape
Breakout Setup:
Yellow price line consolidates in flat terrain
Minimal resistance (low terrain) in projected direction
Clear path toward distant liquidity zones
Pro Tips
Start Simple: Begin with default settings, then gradually customize
Focus on Yellow Line: Your primary indicator of current price position
Combine Timeframes: Use the same terrain across multiple timeframes for confluence
Volume Confirmation: Ensure terrain peaks align with actual volume spikes
Void Anticipation: When price enters voids, prepare for potential rapid movement
Order Blocks & Voids Architecture
Order Blocks Calculation
Trigger: Price breaks fractal swing points
Bullish OB: When close > swing high → find lowest low in lookback period
Bearish OB: When close < swing low → find highest high in lookback period
Strength: Based on price distance from block extremes
Storage: Global array maintains last 50 blocks with FIFO management
Liquidity Voids Detection
Trigger: Price gaps exceeding ATR threshold
Bull Void: Low - high > (ATR200 × multiplier)
Bear Void: Low - high > (ATR200 × multiplier)
Validation: Close confirms gap direction
Storage: Global array maintains last 30 voids
Key Design Features
Real-time Updates: Calculated every bar, not just on last bar
Global Persistence: Arrays maintain state across executions
FIFO Management: Automatic cleanup of oldest entries
Configurable Sensitivity: Adjustable lookback periods and thresholds
Scientific Testing Framework
Hypothesis Testing
Primary Hypothesis: 3D terrain visualization improves detection of institutional order flow vs traditional 2D charts
Testable Metrics:
Prediction Accuracy: Does terrain structure predict future support/resistance?
Reaction Time: Faster identification of key levels vs conventional methods
False Positive Reduction: Lower rate of failed breakouts/breakdowns
Control Variables
Market Regime: Trending vs ranging conditions
Asset Classes: Forex, equities, cryptocurrencies
Timeframes: M5 to H4 for intraday, D1 for swing
Volume Conditions: High vs low volume environments
Data Collection Protocol
Terrain Features to Quantify:
Slope gradient changes at price inflection points
Volume peak clustering density
Order block terrain elevation vs subsequent price action
Void depth correlation with momentum acceleration
Control Group: Traditional support/resistance + volume profile
Experimental Group: 3D Institutional Flow Terrain
Statistical Measures
Signal-to-Noise Ratio: Terrain features vs random price movements
Lead Time: Terrain formation ahead of price confirmation
Effect Size: Performance difference between groups (Cohen's d)
Statistical Power: Sample size requirements for significance
Validation Methodology
Blind Testing:
Remove price labels from terrain screenshots
Have traders identify key levels from terrain alone
Measure accuracy vs actual price action
Backtesting Framework:
Automated terrain feature extraction
Correlation with future price reversals/breakouts
Monte Carlo simulation for significance testing
Expected Outcomes
If hypothesis valid:
Significant improvement in level prediction accuracy (p < 0.05)
Reduced latency in institutional level identification
Higher risk-reward ratios on terrain-confirmed trades
Research Questions:
Does terrain elevation reliably indicate institutional interest zones?
Are liquidity voids statistically significant momentum predictors?
Does multi-timeframe terrain analysis improve signal quality?
How does terrain persistence correlate with level strength?
LuxAlgo BigBeluga hapharmonic

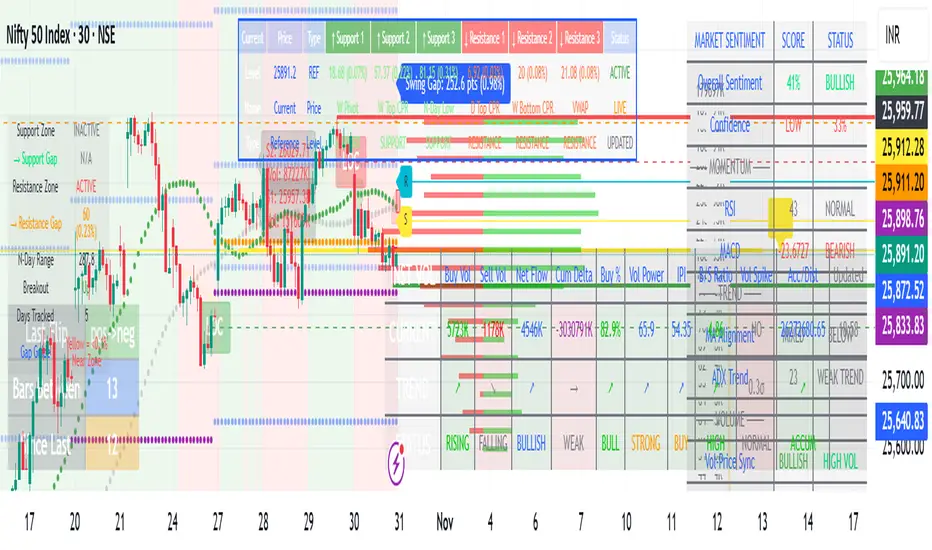
MARKET SCANNER Core Components:
1. Market Structure & Pivot Points
Multi-timeframe Pivots: Daily, Weekly, Monthly pivot points
Central Pivot Range (CPR): For all timeframes
N-Day High/Low Tracking: Dynamic support/resistance based on recent price action
2. Volume Analysis
Institutional Volume Metrics: Buy/Sell pressure, Net flow, Volume Power
Cumulative Delta: Tracks order flow imbalance
Volume Profile: Right-side profile with POC (Point of Control) and Value Area
Volume Strikes: Identifies significant volume absorption/breakout levels
3. Price Action & Patterns
Fibonacci-based Candlestick Recognition: Green/Red candles with specific Fibonacci conditions
Support/Resistance Zones: Dynamic boxes based on Fibonacci retracements
Breakout Detection: Tracks breakouts above N-day high/low with retracement levels
4. Moving Averages & VWAP
VWAP with multiple moving averages (20, 50, 250 periods)
MVWAP Sign Detection: Tracks flips in VWAP momentum
5. Market Sentiment Analysis
Composite Sentiment Score: Combines RSI, MACD, Stochastic, Moving Averages, ADX
Confidence Scoring: Measures signal reliability
Conflict Detection: Identifies when volume and price signals disagree
6. Advanced Features
Dynamic Gap Calculations: Measures distance to support/resistance zones
Swing Analysis: Identifies swing highs/lows with gap measurements
Volume-Price Confirmation: Validates moves with volume
Professional Tables: Multiple tables displaying pivot levels, differences, sentiment, and volume metrics
Key Trading Concepts Implemented:
Institutional Order Flow: Tracks smart money activity
Volume-Weighted Price Levels: Identifies significant price zones
Multi-timeframe Analysis: Correlates daily, weekly, monthly levels
Fibonacci Retracement Strategies: For entries and exits
Market Microstructure: Through volume profile and delta analysis
Visual Outputs:
Dynamic support/resistance boxes
Volume profile histogram
Multiple information tables
Real-time sentiment scoring
Retracement lines and zones
This is essentially a professional-grade trading suite that combines price action, volume analysis, market structure, and sentiment into one comprehensive tool suitable for both discretionary and systematic trading approaches.
Key Levels (PA, MAs, VWAPs, Volume Profile, rVWAPs)This indicator marks all kinds of key levels so that users can keep an overview of their specified levels in a convenient non chart cluttering way. It can highlight levels of confluence or display each level seperately.
The indicator includes markers for the following levels:
Price Action: Opens, Previous High/Low, Monday Range
Moving Averages: H4, D1 and W1 with customisable lengths
VWAPs: Developing and Previous VWAPs with their respective VAL/VAH (1 Standard Deviation)
Rolling VWAPs
Volume Profile: Developing and Previous VAL/VAH/POC
What makes this indicator different is its vast customisation options and big library of levels…
… users can choose to merge all levels that are aligned in a specified % threshold and additionally they can choose to color them the same color to highlight confluence levels.
… users have the choice between Full Label Markers or Abbreviations of those Labels.
… users have the choice of a few presets making level switching fast and convenient (Price Action, Volume Profile, VWAP, Volume or Custom).
… users can specify if they prefer to highlight Simple Moving Averages or Exponential Moving Averages. They have calculations available on three different timeframes and can change the lengths of each.
… users can color all levels the same with one click instead of having to manually change all of them.
… when users choose Volume Profile Levels they can either let the script auto calculate the row size making asset switching simple or they can manually input row size.
With the custom preset users can show and hide whichever levels they want.
(To have them the same every time you freshly load the indicator save your settings as default in the lower left corner of the settings tab).
Purpose
This indicator is designed to serve as a level visualisation tool that has the ability to highlight levels of confluence. It may assist in keeping an overview of where all levels are currently located but does not produce signals or trade recommendations.

Volume Profile - Previous Day Levels The green lines and area represent previous day Value Area. The values are not completely identical to Trading View default levels because of difference in calculation.
The white lines represent the min-max prices during the initial balance (9:30 to 10:30 EST). The diagnoal lines cannot be removed unfortunately.
You can also see same day evolving Valuea area and POC for momentum analysis.

Volume Profile, Pivot Anchored by DGT - reviewedVolume Profile, Pivot Anchored by DGT - reviewed
This indicator, “Volume Profile, Pivot Anchored”, builds a volume profile between swing highs and lows (pivot points) to show where trading activity is concentrated.
It highlights:
Value Area (VAH / VAL) and Point of Control (POC)
Volume distribution by price level
Pivot-based labels showing price, % change, and volume
Optional colored candles based on volume strength relative to the average
Essentially, it visualizes how volume is distributed between market pivots to reveal key price zones and volume imbalances.

RSI VWAP v1 [JopAlgo]RSI VWAP v1.1 made stronger by volume-aware!
We know there's nothing new and the original RSI already does an excellent job. We're just working on small, practical improvements – here's our take: The same basic idea, clearer display, and a single, specially developed rolling line: a VWAP of the RSI that incorporates volume (participation) into the calculation.
Do you prefer the pure classic?
You can still use Wilder or Cutler engines –
but the star here is the VW-RSI + rolling line.
This RSI also offers the possibility of illustrating a possible
POC (Point of Control - or the HAL or VAL) level.
However, the indicator does NOT plot any of these levels itself.
We have included an illustration in the chart for this!
We hope this version makes your decision-making easier.
What you’ll see
The RSI line with a 50 midline and optional bands: either static 70/30 or adaptive μ±k·σ of the Rolling Line.
One smoothing concept only: the Rolling Line (light blue) = VWAP of RSI.
Shadow shading between RSI and the Rolling Line (green when RSI > line, red when RSI < line).
A lighter tint only on the parts of that shadow that sit above the upper band or below the lower band (quick overbought/oversold context).
Simple divergence lines drawn from RSI pivots (green for regular bullish, red for regular bearish). No labels, no buy/sell text—kept deliberately clean.
What’s new, and why it helps
VW-RSI engine (default):
RSI can be computed from volume-weighted up/down moves, so momentum reflects how much traded when price moved—not just the direction.
Rolling Line (VWAP of RSI) with pure VWAP adaptation:
Low volume: blends toward a faster VWAP so early, thin starts aren’t missed.
Volume spikes: blends toward a slower VWAP so a single heavy bar doesn’t whip the curve.
You can reveal the Base Rolling (pre-adaptation) line to see exactly how much adaptation is happening.
Adaptive bands (optional):
Instead of fixed 70/30, use mean ± k·stdev of the Rolling Line over a lookback. Levels breathe with the market—useful in strong trends where static bounds stay pinned.
Minimal, readable panel:
One smoothing, one story. The shadow tells you who’s in control; the lighter highlight shows stretch beyond your lines.
How to read it (fast)
Bias: RSI above 50 (and a rising Rolling Line) → bullish bias; below 50 → bearish bias.
Trigger: RSI crossing the Rolling Line with the bias (e.g., above 50 and crossing up).
Stretch: Near/above the upper band, avoid chasing; near/below the lower band, avoid panic—prefer a cross back through the line.
Divergence lines: Use as context, not as standalone signals. They often help you wait for the next cross or avoid late entries into exhaustion.
Settings that actually matter
RSI Engine: VW-RSI (default), Wilder, or Cutler.
Rolling Line Length: the VWAP length on RSI (higher = calmer, lower = earlier).
Adaptive behavior (pure VWAP):
Speed-up on Low Volume → blends toward fast VWAP (factor of your length).
Dampen Spikes (volume z-score) → blends toward slow VWAP.
Fast/Slow Factors → how far those fast/slow variants sit from the base length.
Bands: choose Static 70/30 or Adaptive μ±k·σ (set the lookback and k).
Visuals: show/hide Base Rolling (ref), main shadow, and highlight beyond bands.
Signal gating: optional “ignore first bars” per day/session if you dislike open noise.
Starter presets
Scalp (1–5m): RSI 9–12, Rolling 12–18, FastFactor ~0.5, SlowFactor ~2.0, Adaptive on.
Intraday (15m–1H): RSI 10–14, Rolling 18–26, Bands k = 1.0–1.4.
Swing (4H–1D): RSI 14–20, Rolling 26–40, Bands k = 1.2–1.8, Adaptive on.
Where it shines (and limits)
Best: liquid markets where volume structure matters (majors, indices, large caps).
Works elsewhere: even with imperfect volume, the shadow + bands remain useful.
Limits: very thin/illiquid assets reduce the benefit of volume-weighting—lengthen settings if needed.
Attribution & License
Based on the concept and baseline implementation of the “Relative Strength Index” by TradingView (Pine v6 built-in).
Released as Open-source (MPL-2.0). Please keep the license header and attribution intact.
Disclaimer
For educational purposes only; not financial advice. Markets carry risk. Test first, use clear levels, and manage risk. This project is independent and not affiliated with or endorsed by TradingView.

Ram HTF Direction & Market ProfileRam HTF Direction & Markey Profile.
I am trying to identify the HTF(Daily) Direction and Market profiles POC,VAL,VAH to trade on 1HR.

EMA / WMA RibbonMomentum Flow Ribbon
Unlock a clear, visual edge in identifying short-term momentum shifts with the Momentum Flow Ribbon.
This indicator was born from a simple yet powerful concept: to visually represent the dynamic relationship between a fast-reacting Exponential Moving Average (EMA) and the smoother, more methodical Wilder's Moving Average (WMA). While both moving averages use the same length, their unique calculation methods cause them to separate and cross, creating a "ribbon" that provides an immediate and intuitive gauge of market momentum.
This tool is designed for the disciplined trader who values clean charts and actionable signals, helping you to execute your strategies with greater confidence and precision.
How It Works
The script plots an EMA and a Wilder's Moving Average (referred to as rma in Pine Script) of the same length. The space between these two lines is then filled with a colored ribbon:
Bullish Green/Teal: The ribbon turns bullish when the faster EMA crosses above the slower Wilder's MA, indicating that short-term momentum is strengthening to the upside.
Bearish Red: The ribbon turns bearish when the EMA crosses below the Wilder's MA, signaling that short-term momentum is shifting to the downside.
The inherent "lag" of the Wilder's MA, a feature designed by J. Welles Wilder Jr. himself, acts as a steady baseline against which the more sensitive EMA can be measured. The result is a simple, zero-lag visual that filters out insignificant noise and highlights meaningful changes in trend direction.
Key Features
Customizable Length and Source: Easily adjust the moving average length and price source (close, hl2, etc.) to fit your specific trading style and the instrument you are trading, from futures like MES and MNQ to cryptocurrencies and forex.
Customizable Colors: Tailor the ribbon's bullish and bearish colors to match your personal chart aesthetic.
Built-in Alerts: The script includes pre-configured alerts for both bullish (EMA crosses above WMA) and bearish (EMA crosses below WMA) signals. Never miss a potential momentum shift again.
Clean & Lightweight: No clutter. Just a simple, effective ribbon that integrates seamlessly into any trading system.
Practical Application for the Discerning Trader
For a futures trader, timing is everything. This ribbon is not just another indicator; it's a tool for confirmation.
Imagine you've identified a key level—a Volume Profile POC, the previous day's low, or a critical accumulation zone. As price approaches this level pre-London session, you're watching for a sign of institutional activity. A flip in the ribbon's color at that precise moment can provide the powerful confirmation you need to enter a trade, trusting that you are aligning with the building liquidity and momentum heading into the New York open.
This is a tool for those who aspire to greatness in their trading—who understand that the edge is found not in complexity, but in the flawless execution of a simple, well-defined plan.
Add the Momentum Flow Ribbon to your chart and start seeing momentum in a clearer light.

Simple TPODisplays price distribution over time using Time Price Opportunities (TPO). Shows Point of Control (POC), Value Area High/Low (VAH/VAL) levels to identify key support/resistance zones and fair value areas. Includes customizable timeframes and price breakout alerts.

Perp Imbalance Zones • Pro (clean)USD Premium (perp vs spot) → (Perp − Spot) / Spot.
Imbalance (z-score of that premium) → how extreme the current premium is relative to its own history over lenPrem bars.
Hysteresis state machine → flips to a SHORT bias when perp-long pressure is extreme; flips to LONG bias when perp-short pressure is extreme. It exits only after the imbalance cools (prevents whipsaw).
Price stretch filter (±σ) → optional Bollinger check so signals only fire when price is already stretched.
HTF confirmation (optional) → require higher-timeframe imbalance to agree with the current-TF bias.
Gradient visuals → line + background tint deepen as |z| grows (more extreme pressure).
What you see on the pane
A single line (z):
Above 0 = perp richer than spot (perp longs pressing).
Below 0 = perp cheaper than spot (perp shorts pressing).
Guides: dotted levels at ±enterZ (entry) and ±exitZ (cool-off/exit).
Background tint:
Red when state = SHORT bias (perp longs heavy).
Blue when state = LONG bias (perp shorts heavy).
Tint intensity scales with |z| (via hotZ).
Labels (optional): prints when bias flips.
Alerts (optional): “Enter SHORT/LONG bias” and “Exit bias”.
How to use it (playbook)
Attach & set symbols
Put the script on your chart.
Set Spot symbol and Perp symbol to the venue you trade (e.g., BINANCE:BTCUSDT + BINANCE:BTCUSDTPERP).
Read the bias
SHORT bias (red background): perp longs over-extended. Look for short entries if price is at resistance, σ-stretched, or your PA system agrees.
LONG bias (blue background): perp shorts over-extended. Look for long entries at support/σ-stretched down.
Entries
Use the bias flip as a context/confirm. Combine with your structure trigger (OB/level sweep, rejection wick, micro-break in market structure, etc.).
If useSigma=true, only trade when price is already ≥ upper band (shorts) or ≤ lower band (longs).
Exits
Bias auto-exits when |z| falls below exitZ.
You can also take profits at your levels or when the line fades back toward 0 while price mean-reverts to the middle band.
Tuning (what each knob does)
enterZ / exitZ (signal strictness + hysteresis)
Higher enterZ → fewer, cleaner signals (e.g., 1.8–2.2).
exitZ should be lower than enterZ (e.g., 0.6–1.0) to prevent flicker.
lenPrem (context window for z)
Larger (50–100) = steadier baseline, fewer signals.
Smaller (20–30) = more reactive, more signals.
smoothLen (EMA on z)
2–3 = snappier; 5–7 = smoother/laggier but cleaner.
useSigma, bbLen, bbK (price-stretch filter)
On filters chop. Try bbLen=100, bbK=1.0–1.5.
Off if you want more frequent signals or you already gate with your own σ/Keltner.
useHTF, htfTF, htfZmin (trend/confirmation)
Turn on to require higher-TF imbalance agreement (e.g., trading 1H → confirm with 4H htfTF=240, htfZmin≈0.6–1.0).
hotZ (visual intensity)
Lower (2.0–2.5) heats up faster; higher (4.0) is more subtle.
Ready-made presets
Conservative swing (fewer, higher-conviction):
enterZ=2.0, exitZ=1.0, lenPrem=60–80, smoothLen=5, useSigma=true, bbK=1.5, useHTF=true (240/0.8).
Balanced intraday (default feel):
enterZ=1.6–1.8, exitZ=0.8–1.0, lenPrem=50, smoothLen=3–4, useSigma=true, bbK=1.0–1.25, useHTF=false/true depending on trendiness.
Aggressive scalping (more signals):
enterZ=1.2–1.4, exitZ=0.6–0.8, lenPrem=20–30, smoothLen=2–3, useSigma=false, useHTF=false.
Practical tips
Don’t trade the line in isolation. Use it to time trades into your levels: VWAP bands, Monday high/low, prior POC/VAH/VAL, order blocks, etc.
Perp-led reversals often snap—be ready to scale out quickly back to mid-bands.
Venue matters. Keep spot & perp from the same exchange family to avoid cross-venue quirks.
Alerts: enable after you’ve tuned thresholds for your timeframe so you only get high-quality pings.

FlowScope [Hapharmonic]FlowScope: Uncover the Market's True Intent 🔬
Ever wished you could look inside the candles and see where the real action is happening? FlowScope is your microscope for the market's flow, designed to give you a powerful edge by revealing the volume distribution that price action alone can't show you.
Instead of just looking at the open, high, low, and close, FlowScope lets you dive deeper into the market's auction process. It groups candles together and builds a detailed Volume Profile for that period, showing you exactly where the trading happened and revealing the story behind the price action.
Let's explore how you can use it to gain a powerful new edge.
🧐 Core Concept: How It Works
At its heart, FlowScope does three key things:
It Groups Candles: You decide how many candles to group together. For example, setting " Group Candles " to 4 on a 5-minute chart effectively gives you a detailed 20-minute candle and profile. This helps you see the bigger picture and filter out market noise.
It Builds a Volume Profile: For each group, FlowScope analyzes the volume at every single price level. It then displays this as a horizontal histogram (we call this a "footprint" or profile). Longer bars mean more volume was traded at that price, indicating a "fair" price or an area of acceptance. Shorter bars mean price moved through quickly, indicating rejection.
It Creates a Custom "Grouped Candle": To summarize the group's overall price action, FlowScope draws a single, custom candle representing the entire group's:
Open: The open of the first candle in the group.
High: The absolute highest price reached within the group.
Low: The absolute lowest price reached within the group.
Close: The close of the last candle in the group.
This gives you a crystal-clear view of the group's net result, free from the back-and-forth noise of the individual candles inside it.
Below are some of the stunning preset color palettes you can choose from to customize your view:
🚀 How to Use: Practical Applications
FlowScope isn't just for looking pretty; it's a powerful analysis tool. Here are a few ways to integrate it into your trading:
Identify High-Volume Nodes (HVNs): Look for the longest bars in the profile. These are price levels where the market spent the most time and traded the most volume. HVNs often act as powerful "magnets" for price, becoming key areas of support and resistance.
Spot Low-Volume Nodes (LVNs): These are areas with very short bars or gaps in the profile. They represent price levels that the market moved through quickly and inefficiently. If price returns to an LVN, it's likely to move through it quickly again.
Analyze the Summary Box: This is where the real magic happens! ✨
Total Volume (Σ): The total volume for the entire group.
Buy (B) vs. Sell (S) Volume: FlowScope analyzes the lower timeframe action to estimate the buying and selling pressure that made up the total volume. Is a big red candle mostly aggressive selling, or was it just a lack of buyers? The B/S data gives you clues. A high-volume candle with nearly 50/50 buy/sell pressure might indicate absorption or a potential reversal.
Use the Grouped Candle for Clarity: Is the market in a clear uptrend, or is it just choppy? The grouped candle can give you a much clearer signal. A series of strong, green grouped candles shows much more conviction than a mix of small green and red candles.
⚙️ Settings & Customization
This is where you can truly make FlowScope your own. Let's walk through each setting.
Profile Settings
Group Candles: The number of standard chart candles you want to combine into a single FlowScope profile. A setting of 1 will analyze every single bar. A higher number gives you a broader market view. When Group Candles is set to 5, the data from the 5 individual candles are combined, and the volume is calculated accordingly.
Max Profile Boxes: This setting is more than just a number; it's a smart limit that ensures your profiles are always readable and relevant to the current market conditions.
Adaptive Sizing (The Ideal Goal): FlowScope first tries to create the perfect profile by making each volume box's height proportional to the current market volatility. It calculates an "ideal" box height based on the Average True Range ( ATR / 10 ). This is powerful because it automatically adapts: you get smaller, more detailed boxes in quiet, low-volatility markets, and larger, clearer boxes in volatile, fast-moving markets.
The Safety Cap (Your Setting): However, what if you group several candles during a massive price move? The price range could be huge! If we only used the small, ATR-based box height, you might end up with hundreds of tiny, unreadable boxes. This is where your Max Profile Boxes setting (defaulting to 50) comes in. It acts as a maximum detail cap . If the adaptive, volatility-based calculation determines that it would need more boxes than your setting (e.g., more than 50), the indicator will override it. It will then simply divide the entire price range of the group into exactly the number of boxes you specified (e.g., 50).
In short: You are setting the maximum allowable detail. FlowScope intelligently adapts the profile's granularity below that limit based on market volatility, ensuring you always get a clear and meaningful picture.
Style
Show Profile BG: A simple toggle to show or hide the faint background color behind the volume bars. Turning it off can create a cleaner look.
Color Mode: This dropdown controls how the volume profile text is colored.
Custom Gradient: This mode uses the three custom colors you select in the "Profile Colors" section to create a beautiful gradient across the profile.
Candle Color: This mode colors the profile based on whether the grouped candle was bullish (green) or bearish (red). The color will be a gradient, with the most intense color applied to the box with the highest volume; the colors of the other boxes will fade out from that point. It's a great way to see the profile's "mood" at a glance.
Profile Colors 🎨
Use Preset Palette: This is the master switch!
If checked: You can choose from 10 stunning, pre-designed color palettes from the Palette dropdown. The custom color pickers below will be disabled.
If unchecked (Default): The Palette dropdown will be disabled, and you can now choose your own three colors for the gradient.
Palette: (Only active when "Use Preset Palette" is checked) . Choose from 10 luxurious, eye-catching color schemes like "Solar Flare" or "Deep Space" to instantly change the look and feel of your chart.
Low Price / Mid Price / High Price: (Only active when "Use Preset Palette" is unchecked) . These three color pickers allow you to design your own unique gradient for the Custom Gradient color mode.
Candle Display
These settings control the custom "Grouped Candle" that summarizes the profile. When using the "Show Custom Candle" feature, you should change the chart's candlestick display to Bars for a cleaner view.
Show Custom Candle: This is the main toggle. When you check this box, the original chart candles will be hidden, and your custom FlowScope candle will be displayed instead. This custom candle is intentionally small to ensure it does not visually overlap with the volume profile boxes.
Show Body: (Only active when "Show Custom Candle" is checked) . Toggles the visibility of the candle's body.
Wick Width & Body Width: (Only active when "Show Custom Candle" is checked) . These sliders let you control the thickness of the wick and body lines to match your personal style.
Up Color / Down Color: (Only active when "Show Custom Candle" is checked) . Choose the colors for your bullish and bearish custom candles.
Experiment with the settings, find a style that works for you, and start seeing the market in a whole new light.
Happy trading! 📈😊

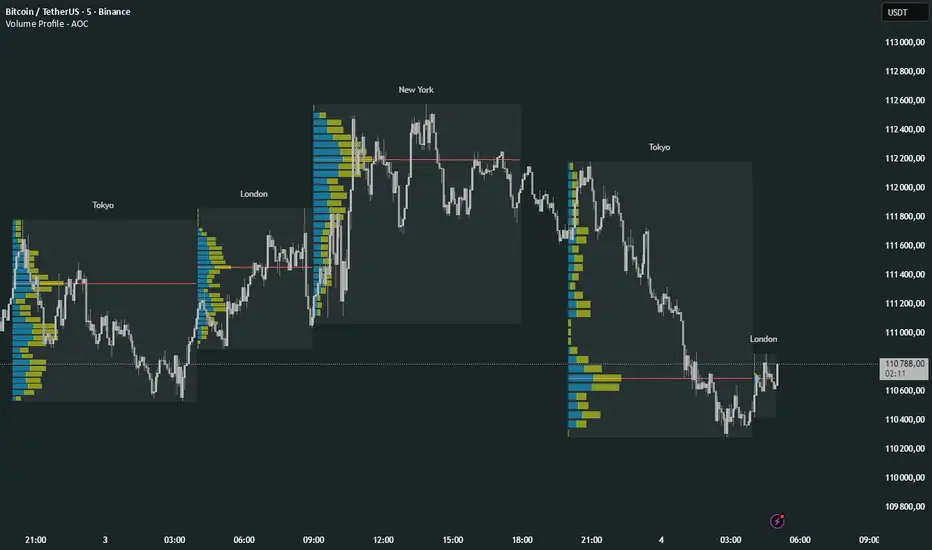
Volume Profile Multi periodVolume Profile - AOC 📈
Unlock market insights with this powerful volume profile indicator! Analyze trading activity across multiple sessions with customizable settings and clear visuals. Perfect for traders aiming to identify key price levels and market trends with precision. 🚀
Key Features:
Multi-Session Support: Visualize volume profiles for Tokyo, London, New York, Daily, Weekly, Monthly, Quarterly, and Semiannual sessions. 🌍
Customizable Display: Choose session types, resolution, and bar modes (Mode 1 or Mode 2) to match your strategy. 🎛️
Point of Control (POC): Highlights the most traded price levels for each session. 🎯
Color-Coded Profiles: Distinct up/down volume visualization for quick analysis. 📊
Session Labels: Optional labels for easy identification of session periods. 🏷️
High/Low Tracking: Tracks session-specific highs and lows for accurate profiling. 📏
Empower your trading decisions with clear, actionable volume data! 💡

BTC CME Gap – detector & single signals# BTC CME Gap — Detector & Single Signals (Pine v5)
**What it does**
This indicator finds the **weekend gap** on **CME Bitcoin futures** and turns it into a clean, tradable object:
* Draws a **gap zone** (Friday close ↔ Monday open) as a right-extending box.
* Fires **one-time signals** per gap:
* **ENTER** – first touch of the gap zone by price.
* **FILL** – gap is considered filled when price tags **Friday’s close**.
It works on any BTC chart (spot or futures). The gap itself is calculated from **CME\:BTC1!** daily data.
---
## How it works
1. Pulls **daily** `open`/`close` from `CME:BTC1!` (`request.security`, no lookahead).
2. On **Monday**, compares Monday **open** with previous **Friday close**:
* If different → a **gap** exists.
3. Defines the zone:
* `gapTop = max(MonOpen, FriClose)`
* `gapBot = min(MonOpen, FriClose)`
4. Renders a box + boundary lines, **extending right** until price action resolves it.
5. Signals:
* **ENTER**: the first bar that **enters** the gap zone.
* **FILL**: first bar that **touches Friday close** (gap completion).
6. Each new Monday gap **replaces** the previous box and signals.
---
## Inputs
* **CME symbol** (default `CME:BTC1!`)
* **Gap timeframe** (default `D`)
* **Colors** for the box and edges
---
## Plot & Signals
* **Box** = visual gap zone (transparent fill, outlined).
* **ENTER** = triangle up below bar.
* **FILL** = triangle down above bar.
* Optional label prints **Top / Bottom / Fill** levels.
---
## Notes on behavior
* Uses `barmerge.lookahead_off` and daily aggregation, so the gap definition **does not repaint** once Monday’s daily bar is confirmed.
* Signals are **single-shot** per gap (no clutter).
* Works on any chart timeframe; the gap logic always references **CME daily**.
---
## Practical use
* Track obvious **“magnets”** for mean-reversion, stop-runs, or liquidity grabs.
* Combine with your higher-timeframe bias (e.g., **1D trend filter**) and execution on **4H/1H**.
* Typical outcomes: quick Monday fill, staged fill after partial rejection, or delayed fill during later consolidation.
---
## Customization ideas
* Add `alertcondition(enterSignal, …)` / `alertcondition(fillSignal, …)` for automation.
* Gate trades with trend filters (EMA/SMA, Kernel regression, ADX) or session tools (VWAP/POC).
* Persist multiple historical gap boxes if you want to track **unfilled** gaps.
---
**Credits**: Built for BTC CME weekend gaps; minimal, publication-ready visualization with single-event signals to keep charts clean.

StdDev Supply/Demand Zone RefinerThis indicator uses standard deviation bands to identify statistically significant price extremes, then validates these levels through volume analysis and market structure. It employs a proprietary "Zone Refinement" technique that dynamically adjusts zones based on price interaction and volume concentration, creating increasingly precise support/resistance areas.
Key Features:
Statistical Extremes Detection: Identifies when price reaches 2+ standard deviations from mean
Volume-Weighted Zone Creation: Only creates zones at extremes with abnormal volume
Dynamic Zone Refinement: Automatically tightens zones based on touch points and volume nodes
Point of Control (POC) Identification: Finds the exact price with maximum volume within each zone
Volume Profile Visualization: Shows horizontal volume distribution to identify key liquidity levels
Multi-Factor Validation: Combines volume imbalance, zone strength, and touch count metrics
Unlike traditional support/resistance indicators that use arbitrary levels, this system:
Self-adjusts based on market volatility (standard deviation)
Refines zones through machine-learning-like feedback from price touches
Weights by volume to show where real money was positioned
Tracks zone decay - older, untested zones automatically fade

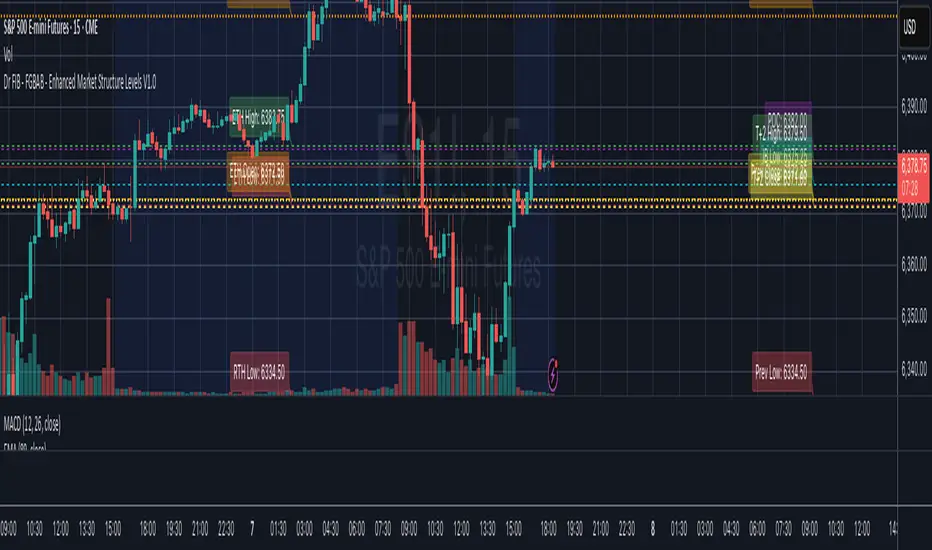
Dr FIB - FGBAB - Enhanced Market Structure Levels V1.0Based on Market Profile Auction Theory this indicator will provide you will key levels that will help you tailor your trading and structure the market movements properly.
This indicator will provide the following information on the chart in any time frame you select and for any instrument including Futures, Stocks and Crypto.
The levels will be provided as fully configurable horizontal lines including the following data:
- Regular trading hours HIGH, LOW and OPEN.
- Extended Trading Hours HIGH, LOW, OPEN.
- Previous Day HIGH, LOW, CLOSE.
- T+2 Settlement HIGH, LOW and CLOSE.
- Point of Control (POC).
- Initial Balance HIGH and LOW. (1st hour RTH Open).
As price tend to re-visit well know price areas, you will find this indicator very useful for day to day trading.
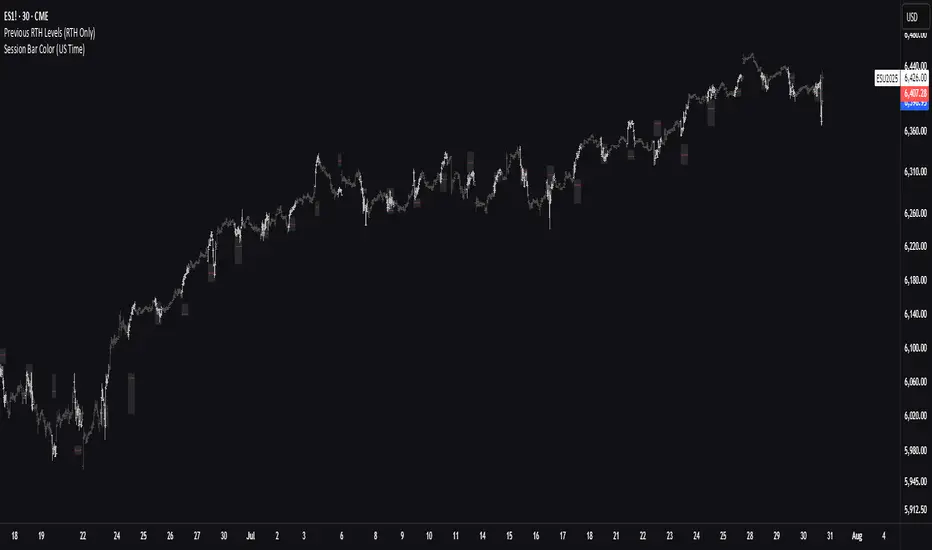
Previous RTH Levels (RTH Only)Previous RTH Levels on current session (RTH Only)
This indicator calculates key volume profile levels from the previous Regular Trading Hours (RTH) session and projects them onto the current RTH session. It is designed to provide traders with significant historical price levels—Point of Control (POC), Value Area High (VAH), and Value Area Low (VAL)—to use as potential support, resistance, and pivot points for intraday trading.
Instead of just plotting lines, this script highlights the entire Value Area (VA) between the VAH and VAL, offering a clear visual reference for the prior day's zone of price agreement.
Institutional Analyst LLM📊 Institutional Analyst Board LLM – Smart Money Confluence Scanner for XAUUSD, Forex, Crypto 🔍 Overview The Institutional Analyst Board is a complete multi-timeframe smart money toolkit designed for traders who demand clarity, confluence, and precision. It brings together institutional-grade metrics—Order Blocks (OB), Fair Value Gaps (FVG), Liquidity Sweeps, MACD/RSI...
PTS Ultimate Analysis Board (Flexible Position + Ticker)
GoldenTradeClub
GoldenTradeClub
Updated
Jul 15
PTS Ultimate Analysis Board (Flexible Position + Ticker) Version: Pine v5 Description: This indicator builds a fully customizable, multi-timeframe dashboard table that surfaces 19 key metrics for any ticker (current chart TF, 1 h, 4 h). You can position the table at the top-right or bottom-right of your chart and toggle each metric on or off. Key...
Trading Engine AI Light
GoldenTradeClub
GoldenTradeClub
Jul 14
The Trading Engine includes the best and most effective technical analysis tools. It has 27 different Buy Signal parameters and 26 different Sell Signal parameters. Furthermore, it also has 9 Stop Loss triggers for Long Positions and 8 Stop Loss triggers for Short Positions. Many of the Buy or Sell Signal parameters function as Take Profit and Stop Loss signals...
Elliott Wave Complete
GoldenTradeClub
GoldenTradeClub
Jul 4
1. Indicator Presentation Name: Elliott Wave Complete Type: Pine Script v5 overlay dashboard for TradingView Purpose: Automates Elliott Wave motive (1-5) and corrective (A-B-C) pattern detection on any timeframe, enriches it with classic ZigZag pivots, dynamic Fibonacci projection levels, optional wave-count info box, and real-time alerts—all in one...
💀⚡ PTS WIZARD 666™ ULTIMATE SUPREME V5.0 - COMPLETE FIXED ⚡💀
GoldenTradeClub
GoldenTradeClub
Jul 4
1. Indicator Presentation Name: 💀⚡ PTS WIZARD 666™ ULTIMATE SUPREME V5.0 – COMPLETE FIXED Short ID: PTS-666-SUPREME Type: Pine Script v5 overlay dashboard for TradingView Purpose: An all-in-one trading overlay that integrates advanced WaveTrend momentum, RSI/MFI analysis, POC volume profiling, multiple Fibonacci golden/ultimate zones, volume footprint & imbalance...
🔥 PTS TRADE 666™ ULTIMATE BOOKMAP + QUANTUM ENGINE
GoldenTradeClub
GoldenTradeClub
Jul 4
1. Indicator Presentation Name: 🔥 PTS TRADE 666™ ULTIMATE BOOKMAP + QUANTUM ENGINE Short ID: PTS666_QUANTUM_FINAL Type: Pine Script v5 overlay dashboard for TradingView Purpose: A cutting-edge, institutional-grade suite that unifies bookmap-style footprint volume profiling, dynamic heatmap liquidity analysis, AI-driven pattern recognition, smart-money protocols,...
🔥 PTS TRADE 666™ - ULTIMATE INSTITUTIONAL TOOL 🔥
GoldenTradeClub
GoldenTradeClub
Jul 4
1. Indicator Presentation Name: 🔥 PTS TRADE 666™ – ULTIMATE INSTITUTIONAL TOOL V2.0 Short ID: PTS666_UIT_V2 Type: Pine Script v5 overlay dashboard for TradingView Purpose: Combines institutional-grade footprint volume analysis, smart-money structure detection, statistical anomaly checks, multi-timeframe divergence, Ichimoku insights, pattern recognition, and an...
PTS Wizard
GoldenTradeClub
GoldenTradeClub
Jul 4
1. Indicator Presentation Name: PTS Wizard Short Title: PTS Wizard Type: Pine Script v5 overlay dashboard for TradingView Purpose: A unified multi-strategy toolkit that overlays key market insights—liquidity zones, smart-money structure, footprint-style volume profile, consolidation ranges, statistical deviation bands, price forecasts, and session analysis—into a...
🔥 PTS.TRADE 666™ ULTIMATE HYBRID + MTF V3
GoldenTradeClub
GoldenTradeClub
Jul 4
1. Indicator Presentation Name: 🔥 PTS.TRADE 666™ ULTIMATE HYBRID + MTF V3 Short ID: PTS666_ULTIMATE_MTF_V3 Type: Overlay dashboard for TradingView Purpose: A next-level hybrid trading suite that merges institutional-grade order-flow analysis, smart-money concepts, AI-driven insights, classic momentum oscillators (WaveTrend, divergence, “Gold” signals),...
🧙♂ PTS WIZARD V3.0 - FINAL EDITION
GoldenTradeClub
GoldenTradeClub
Jul 4
1. Indicator Presentation Name: 🧙♂ PTS WIZARD V3.0 – FINAL EDITION Short Title: PTS-WIZARD-V3-FINAL Type: Overlay trading dashboard for TradingView Purpose: A comprehensive multi-module indicator that blends classic cipher momentum signals, Elliott Wave pattern detection, advanced statistical analyses (Z-Score, Benford’s Law, Ehlers SNR), footprint-style volume...
🧙♂ PTS WIZARD V3.0 + FOOTPRINT ULTIMATE
GoldenTradeClub
GoldenTradeClub
Jul 4
Name: PTS WIZARD V3.0 + FOOTPRINT ULTIMATE Type: Overlay trading dashboard for TradingView Purpose: Combines classic cipher-style momentum signals with an advanced footprint volume profile, multi-timeframe bias, statistical filters, and a fusion-score system—displayed in a customizable on-chart dashboard. Core Modules Cipher Momentum Signals WaveTrend...
🧙♂ PTS WIZARD V3.0 - BASIC
GoldenTradeClub
GoldenTradeClub
Jul 1
PTS WIZARD V3.0 Basic – Ultimate Multi-Tool Trading Dashboard An all-in-one overlay combining classic cipher signals, Elliott Wave pattern detection, volume analytics, divergence spotting, and smart-entry timing—backed by advanced statistical filters and a live dashboard. Key Features Cipher Signals WaveTrend with overbought/oversold zones & cross signals RSI...
Trading Engine vCD AI
GoldenTradeClub
GoldenTradeClub
Jun 15
The Trading Engine includes the best and most effective technical analysis tools. It has 27 different Buy Signal parameters and 26 different Sell Signal parameters. Furthermore, it also has 9 Stop Loss triggers for Long Positions and 8 Stop Loss triggers for Short Positions. Many of the Buy or Sell Signal parameters function as Take Profit and Stop Loss signals...
Trading Engine vCD
GoldenTradeClub
GoldenTradeClub
Updated
Mar 21
The Trading Engine includes the best and most effective technical analysis tools. It has 27 different Buy Signal parameters and 26 different Sell Signal parameters. Furthermore, it also has 9 Stop Loss triggers for Long Positions and 8 Stop Loss triggers for Short Positions. Many of the Buy or Sell Signal parameters function as Take Profit and Stop Loss signals...
TE CLIENT v13
GoldenTradeClub
GoldenTradeClub
Updated
Mar 15
The Trading Engine includes the best and most effective technical analysis tools. It has 27 different Buy Signal parameters and 26 different Sell Signal parameters. Furthermore, it also has 9 Stop Loss triggers for Long Positions and 8 Stop Loss triggers for Short Positions. Many of the Buy or Sell Signal parameters function as Take Profit and Stop Loss signals...
Trading Engine v13
GoldenTradeClub
GoldenTradeClub
Updated
Mar 15
The Trading Engine includes the best and most effective technical analysis tools. It has 27 different Buy Signal parameters and 26 different Sell Signal parameters. Furthermore, it also has 9 Stop Loss triggers for Long Positions and 8 Stop Loss triggers for Short Positions. Many of the Buy or Sell Signal parameters function as Take Profit and Stop Loss signals...
Trading Engine B2B
GoldenTradeClub
GoldenTradeClub
Updated
Jan 14
The Trading Engine includes the best and most effective technical analysis tools. It has 25 different Buy Signal parameters and 24 different Sell Signal parameters. Furthermore, it also has 9 Stop Loss triggers for Long Positions and 8 Stop Loss triggers for Short Positions. Many of the Buy or Sell Signal parameters function as Take Profit and Stop Loss signals...
Trading Engine B2B FX V9
GoldenTradeClub
GoldenTradeClub
Updated
Jan 14
The VFLOW Trading Engine includes the best and most effective technical analysis tools. It has 20 different Buy Signal parameters and 18 different Sell Signal parameters. Furthermore, it also has 7 Stop Loss triggers for Long Positions and 5 Stop Loss triggers for Short Positions. Many of the Buy or Sell Signal parameters function as Take Profit and Stop Loss...
English
Select market data provided by ICE Data services.
Select reference data provided by FactSet. Copyright © 2025 FactSet Research Systems Inc.
© 2025 TradingView, Inc.
More than a product
Supercharts
Screeners
Stocks
ETFs
Bonds
Crypto coins
CEX pairs
DEX pairs
Pine
Heatmaps
Stocks
ETFs
Crypto
Calendars
Economic
Earnings
Dividends
More products
Yield Curves
Options
News Flow
Pine Script®
Apps
Mobile
Desktop
Tools & subscriptions
Features
Pricing
Market data
Trading
Overview
Brokers
Special offers
CME Group futures
Eurex futures
US stocks bundle
About company
Who we are
Athletes
Blog
Careers
Media kit
Merch
TradingView store
Tarot cards for traders
The C63 TradeTime
Policies & security
Terms of Use
Disclaimer
Privacy Policy
Cookies Policy
Accessibility Statement
Security tips
Bug Bounty program
Status page
Community
Social network
Wall of Love
Refer a friend
House Rules
Moderators
Ideas
Trading
Education
Editors' picks
Pine Script
Indicators & strategies
Wizards
Freelancers
Business solutions
Widgets
Charting libraries
Lightweight Charts™
Advanced Charts
Trading Platform
Growth opportunities
Advertising
Brokerage integration
Partner program
Education program
Look First
Close
Updated 3 hours ago
Institutional Analyst Board
Manage access
Remove from favorites
Use on chart
0
11
Jul 19
📊 Institutional Analyst Board – Smart Money Confluence Scanner for XAUUSD, Forex, Crypto
🔍 Overview
The Institutional Analyst Board is a complete multi-timeframe smart money toolkit designed for traders who demand clarity, confluence, and precision. It brings together institutional-grade metrics—Order Blocks (OB), Fair Value Gaps (FVG), Liquidity Sweeps, MACD/RSI bias, VWAP positioning, and Break of Structure (BoS)—into a single powerful visual dashboard.
This indicator is especially optimized for Gold (XAUUSD) but is also compatible with Crypto and Forex assets.
🧠 Key Features
✅ Multi-Timeframe Dashboard (5M / 15M / 1H)
✅ Order Block Detection with dynamic zones that extend until broken
✅ Fair Value Gap Detection with clear zone shading and border distinction
✅ MACD + RSI Confluence for momentum and bias alignment
✅ VWAP Positioning to identify premium/discount zones
✅ Liquidity Sweeps (internal/external range breaks)
✅ Killzone Highlighting (Asia / London / New York)
✅ Break of Structure (BoS) with advanced confluence filters
✅ Gold Bias Flags across timeframes (BUY / SELL / NEUTRAL)
✅ Dynamic Price Watermark with real-time data
✅ Fully customizable colors, transparencies, and text labels
🧠 How It Works
The Board uses institutional logic to analyze the chart in real time:
Metric Purpose
OB Zones Highlight potential smart money footprints where price is likely to react.
FVG Zones Identify imbalance areas between buyers and sellers—ideal for mean reversion entries.
MACD/RSI Confirm momentum direction and relative strength confluence.
VWAP Determine whether price is trading at a premium or discount.
Liquidity Sweeps Detect manipulative moves before major reversals.
BoS Mark potential trend reversals, filtered by institutional confluence.
Each signal is computed across 3 timeframes and visualized in a clean board that updates live. You’ll also see labels, alerts, and session overlays for maximum clarity.
📌 Ideal Use Case
This tool is perfect for:
Funded Challenge Traders (FTMO, MyForexFunds, etc.)
Gold scalpers and intraday traders
Crypto price action traders using BTC, ETH, SOL, etc.
Smart Money Concept (SMC) and ICT followers
⚙️ Customization Options
Toggle each module (OB, FVG, VWAP, MACD/RSI, etc.)
Set transparency and color for each zone type
Adjust Killzone timing (Asia, London, NY)
Control board position (Top/Bottom) and metric visibility
📈 Compatible Assets
✅ XAUUSD (optimized)
✅ Forex majors/minors
✅ Crypto pairs (BTC, ETH, SOL, etc.)
✅ Indices (GER40, NASDAQ, SPX with minor adaptation)
🛠️ Requirements
Use on TradingView v5
Set chart time to UTC+0 or UTC+3 for optimal Killzone accuracy
For crypto, redefine Killzone hours if needed (24/7 market)
🧠 Pro Tip
Pair this indicator with volume profile tools, CVD/Delta Flow, or Footprint overlays to build high-confidence trade setups with clear institutional confluence.

AMV Highs and LowsAMV Highs and Lows
A contextual range-coloring tool designed to simplify where you are in the current session’s structure.
What it does:
AMV Highs and Lows is a compact, real-time market structure indicator that analyzes price positioning within a rolling 4-hour range to highlight high/low zones, balanced regions, and choppy conditions.
Rolling Session Range: Automatically calculates the high, low, and volume over the last 4 hours.
Contextual Candle Coloring: Colors candles based on where price sits within that range —
Red for low zone, green for high zone, yellow for mid-range chop.
Multiple Viewing Modes: Choose from: Candle Coloring, Line Mode, Table Overlay
Volume Context (POC/VAH/VAL): Internally calculates volume percentile areas — though hidden by default — to later extend into profile-like applications.
Use case:
This tool is for intraday traders, scalpers, and orderflow/momentum traders who want a quick-glance assessment of:
Where price is sitting relative to recent structure
High Zone → Price is pressing extremes → good for breakout or reversal setups
Low Zone → Possible accumulation/distribution → trap or bounce potential
Chop Zone → Mid-range indecision → avoid or scalp with caution
Market Mood at a Glance
The color logic gives immediate visual feedback — especially helpful in fast-moving markets or when managing multiple charts.
Use this tool as a bias filter, a visual timing helper, or a session mood gauge. Combine it with your setups (liquidity zones, imbalances, VWAP, etc.) to know when to act and when to not take any entries in the market.

BK AK-SILENCER (P8N)🚨Introducing BK AK-SILENCER (P8N) — Institutional Order Flow Tracking for Silent Precision🚨
After months of meticulous tuning and refinement, I'm proud to unleash the next weapon in my trading arsenal—BK AK-SILENCER (P8N).
🔥 Why "AK-SILENCER"? The True Meaning
Institutions don’t announce their moves—they move silently, hidden beneath the noise. The SILENCER is built specifically to detect and track these stealth institutional maneuvers, giving you the power to hunt quietly, execute decisively, and strike precisely before the market catches on.
🔹 "AK" continues the legacy, honoring my mentor, A.K., whose teachings on discipline, precision, and clarity form the cornerstone of my trading.
🔹 "SILENCER" symbolizes the stealth aspect of institutional trading—quiet but deadly moves. This indicator equips you to silently track, expose, and capitalize on their hidden footprints.
🧠 What Exactly is BK AK-SILENCER (P8N)?
It's a next-generation Cumulative Volume Delta (CVD) tool crafted specifically for traders who hunt institutional order flow, combining adaptive volatility bands, enhanced momentum gradients, and precise divergence detection into a single deadly-accurate weapon.
Built for silent execution—tracking moves quietly and trading with lethal precision.
⚙️ Core Weapon Systems
✅ Institutional CVD Engine
→ Dynamically measures hidden volume shifts (buying/selling pressure) to reveal institutional footprints that price alone won't show.
✅ Adaptive AK-9 Bollinger Bands
→ Bollinger Bands placed around a custom CVD signal line, pinpointing exactly when institutional accumulation or distribution reaches critical extremes.
✅ Gradient Momentum Intelligence
→ Color-coded momentum gradients reveal the strength, speed, and silent intent behind institutional order flow:
🟢 Strong Bullish (aggressive buying)
🟡 Moderate Bullish (steady accumulation)
🔵 Neutral (balance)
🟠 Moderate Bearish (quiet distribution)
🔴 Strong Bearish (aggressive selling)
✅ Silent Divergence Detection
→ Instantly spots divergence between price and hidden volume—your earliest indication that institutions are stealthily reversing direction.
✅ Background Flash Alerts
→ Visually highlights institutional extremes through subtle background flashes, alerting you quietly yet powerfully when market-moving players make their silent moves.
✅ Structural & Institutional Clarity
→ Optional structural pivots, standard deviation bands, volume profile anchors, and session lines clearly identify the exact levels institutions defend or attack silently.
🛡️ Why BK AK-SILENCER (P8N) is Your Edge
🔹 Tracks Institutional Footprints—Silently identifies hidden volume signals of institutional intentions before they’re obvious.
🔹 Precision Execution—Cuts through noise, allowing you to execute silently, confidently, and precisely.
🔹 Perfect for Traders Using:
Elliott Wave
Gann Methods (Angles, Squares)
Fibonacci Time & Price
Harmonic Patterns
Market Profile & Order Flow Analysis
🎯 How to Use BK AK-SILENCER (P8N)
🔸 Institutional Reversal Hunting (Stealth Mode)
Bearish divergence + CVD breaking below lower BB → stealth short signal.
Bullish divergence + CVD breaking above upper BB → quiet, early long entry.
🔸 Momentum Confirmation (Silent Strength)
Strong bullish gradient + CVD above upper BB → follow institutional buying quietly.
Strong bearish gradient + CVD below lower BB → confidently short institutional selling.
🔸 Noise Filtering (Patience & Precision)
Neutral gradient (blue) → remain quiet, wait patiently to strike precisely when institutional activity resumes.
🔸 Structural Precision (Institutional Levels)
Optional StdDev, POC, Value Areas, Session Anchors clearly identify exact institutional defense/offense zones.
🙏 Final Thoughts
Institutions move in silence, leaving subtle footprints. BK AK-SILENCER (P8N) is your specialized weapon for tracking and hunting their quiet, decisive actions before the market reacts.
🔹 Dedicated in deep gratitude to my mentor, A.K.—whose silent wisdom shapes every line of code.
🔹 Engineered for the disciplined, quiet hunter who knows when to wait patiently and when to strike decisively.
Above all, honor and gratitude to Gd—the ultimate source of wisdom, clarity, and disciplined execution. Without Him, markets are chaos. With Him, we move silently, purposefully, and precisely.
⚡ Stay Quiet. Stay Precise. Hunt Silently.
🔥 BK AK-SILENCER (P8N) — Track the Silent Moves. Strike with Precision. 🔥
May Gd bless every silent step you take. 🙏

HSI Market sessions and Volume profileHSI Market Sessions and Volume Profile
Unlock deeper market insight with this advanced volume profile indicator tailored for Hang Seng Index (HSI) and other futures instruments. This tool combines session-based volume analysis, customizable profiles, and intraday tracking for superior market structure awareness.
🔍 Key Features:
Dynamic Volume Profile: View aggregated buy/sell volume or open interest delta across customizable price zones.
POC, VAH, VAL Lines: Instantly spot the Point of Control, Value Area High, and Value Area Low for each session.
Flexible Session Options: Analyze market behavior by Tokyo, London, New York, or standard timeframes like Daily, Weekly, Monthly, Quarterly, or Yearly.
Live Zone Tracking: Stay ahead with real-time profiling of the current session.
Forex Box Option: Visualize forex trading zones even without volume profiles.
Highly Configurable: Choose from three display modes, resolution settings, and color schemes to fit your style and precision needs.
🧠 Smart Mechanics:
Adaptive to both Volume and Open Interest data.
Built-in smoothing algorithm for cleaner profiles in high-volatility assets.
Auto-reset and draw logic based on session type and bar resolution.
Intrabar data handling for more granular profiling (requires lower timeframe input).
✅ Ideal For:
HSI Futures Traders looking for market session clarity and volume zones.
Volume Profile Analysts needing flexible, session-specific profile rendering.
Day Traders and Swing Traders who value precision in trade planning.

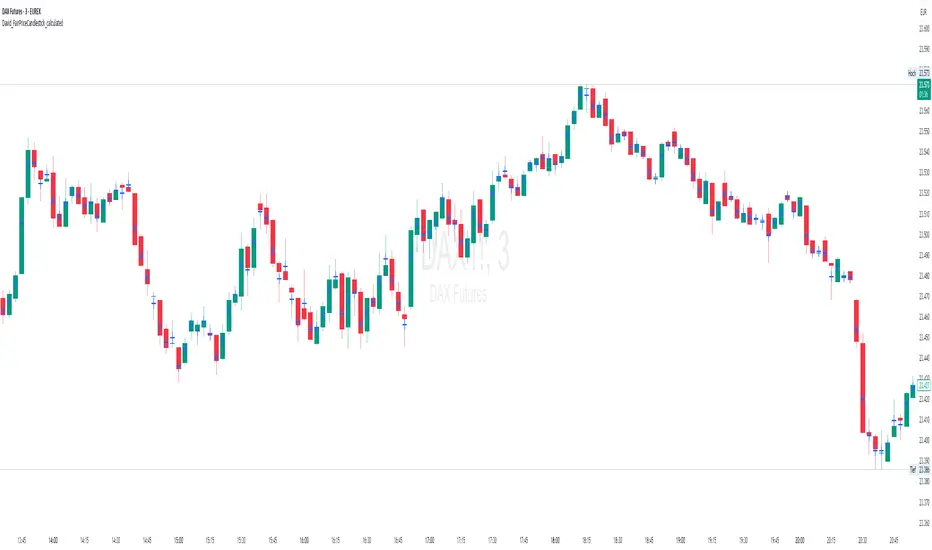
David_FairPriceCandlestick_calculatedDescription:
This indicator displays the "Typical Price" for each candle as a visual marker (cross) directly on the chart. The Typical Price is calculated as the average of the High, Low, and Close values of each bar:
(High + Low + Close) / 3
The marker provides a quick visual reference to the fair or average price level within every single candle.
Unlike a Point of Control (POC) or volume-based indicators, this script works purely with price data and is independent of volume or order flow.
Use cases:
Identify where most trading activity may have been concentrated within the candle (for price-based strategies)
Support as a reference line for mean-reversion or fair value concepts
Works on all timeframes and instruments
Customization:
You can easily change the marker style (cross, dot, triangle, etc.) and color within the script.