Helicopter!Review
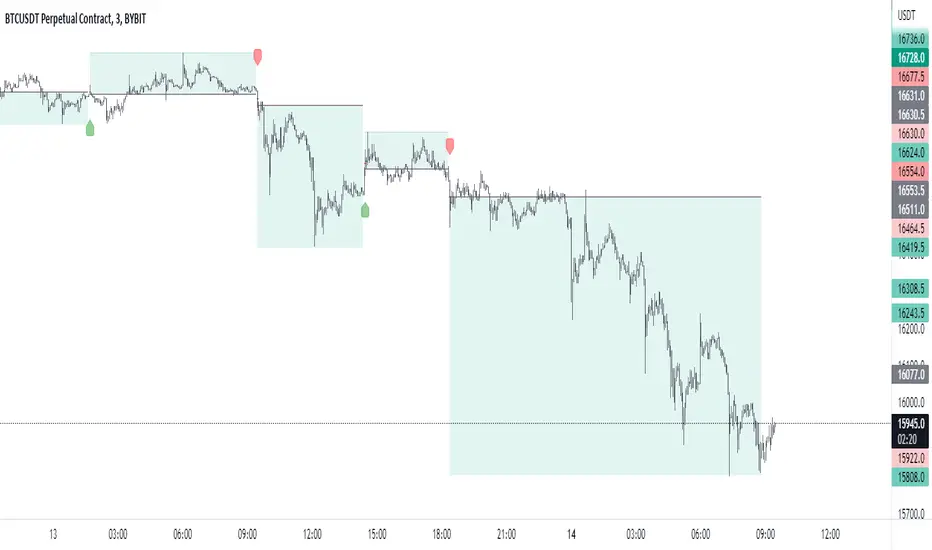
This indicator automatically calculates the best trade entry based on volume and real-time volatility. After the algorithm analyzes the current characteristics of the market, an entry signal is placed on the chart. As a result, the trader can be sure that the signal is based on data analysis. One of the key elements is reverse transactions. A long or short position can be stopped either at a profit or at a small loss without compromising the potential profit.
!Risks
The market is unstable, and it is impossible to know what the future holds for it. The only way to manage risk. You can limit the loss by setting a stop loss of 1% from the entry point. Take profit is recommended to set with a ratio of 1:1, 1:2,1:3, with partial fixation of 40%, 30%, 30%!
!Trading recommendations
Trades are opened when a green arrow appears, selling when a yellow arrow appears. Be sure to wait for the candle to close and the signal to appear (the signal may flash when the candle is formed). Recommended timeframes: 1min, 3min, 15min. The indicator is designed for scalp trades and intradays!
!Technical part
The indicator is based on the EMA 20 and EMA 200 moving averages. It is also based on the open and close of past days, weeks, months.
RSI are used.
RSI is a classic oscillator built on the basis of calculating the relative rate of change in asset prices over a given period.
Additional tools: volume and volatility.
NO REPAINT!
-------------------------------------------------------
Denial of responsibility
The information contained in my Scripts/Indicators/Ideas/Algorithms/Systems does not constitute financial advice or an offer to buy or sell any securities of any kind. I do not accept liability for any loss or damage, including but not limited to any loss of profits that may arise directly or indirectly from the use of or reliance on such information.
"scalp"に関するスクリプトを検索
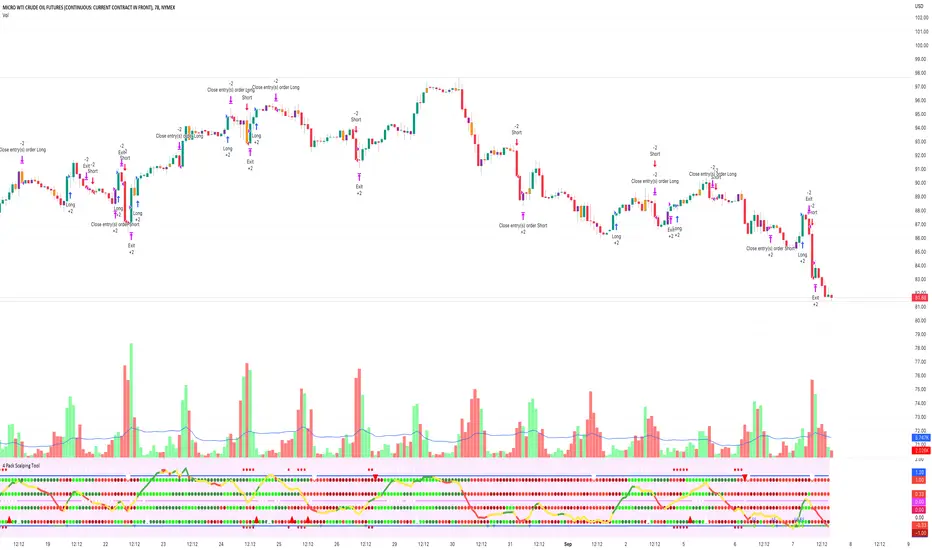
4 Pack Scalping ToolThe 4 Squeeze Scalp tool is a tool that I have developed over the past few years. I was always fascinated by the fact that most people don’t know where price is heading. While Fibonacci and other linear type methods work it never gelled with me. I started by going deep into the fundamentals of momentum with an understanding that an object in motion heading in a particular direction tends to stay heading in that direction (until something derails it). Price, in my opinion, is no different.
Price can move up, down and sideways. And it moves in a wave, getting stronger over time until eventually pulling back and starting over again. In my mind, the compression of price and the relationship of that pressure to various lengths of time as well as RSI, ADX and DMI across these same time frames gives you a view on how the underlying price momentum is building up and releasing. For trading you want to be building a trade when pressure starts to build and you want to take profits when the wave starts to pull back and build for the next cycle.
Each dot represents a length of the momentum indicator and the line inside the oscillator is a weighted composite of the underlying momentum structure for each of the lengths selected. A trade follows the directional alignment of the line (red = down, yellow = neutral / chop, green = up) and the dots should be aligned from the bottom to the top (bright green = very bullish, dark green = neutral / bullish, dark red = neutral / bearish, bright red = very bearish). When the line and the dots are aligned you will have a high probability trade.
The backtest results below are based on 2 years of backtesting, using a 2 contract trade on a 100K account. While the absolute return is not meaningful the win rate and PF are great for a trade on CL on this timeframe. The tool can be used on any asset over any timeframe in a multitude of combinations.
To get access to the tool, please contact the author.
kali algo trade Hodl/swing/scalpThis algo proposes several elements:
- Trend indicator (bottom)
- Divergence label
- Supertrend label
- EMA
- Danger zone WMC overbought/overbuy
- Background color red/green for buy zone sell zone
It can be used for scalping, swing trading or finding buy zones/ sell zones for long term positions.
In the case of short term positions, remember to look for trend confirmation on higher periods. The trend indicator can help you.
The red and green background color areas are found by the following indicator:
- MFI
- RSI
- StochRSI
- ema
- W%R_21e13
This indicator offers different and automated parameters depending on the time interval displayed.
Buy zones are more optimized than the sell zones.
In my opinion, this is the most important tool in the whole algo
With this algo you can quickly switch from one currency to another and adapt the timeframe to find the best configuration.

5 min scalp macd5 min scalp macd, 5 min scalp macd, 5 min scalp macd, 5 min scalp macd, 5 min scalp macd, 5 min scalp macd, 5 min scalp macd, 5 min scalp macd

Maddrix_club I - Scalper (3commas)Maddrix club I Scalper (3commas version). The code is very different from the ALERTATRON version.
It really is not the same!
Maddrix Club I is a simple, straightforward trading algorithm that goes long or short, based on user’s choice. It is considered to be a scalper, because it aims to capture small profits that accumulates and compound over time.
The theory behind it is based on trend following and DCA .
Strategy type one uses momentum to generate signals.
Strategy type two uses price action only
Very good results have been observed on the 1 min time frame though it technically works on all timeframe (5 min for example, 1 hour also). The most important part of this algorithm is risk management and capital preservation.
You can run this with very little capital, and always make sure that in the worst case scenario, meaning when the market goes against you and all your SO (Safety Orders) are filled, you are using less than your account balance.
If you are in a trending up phase on the weekly time frame, you can go long. If this is a definite trend down, of course go short. During a bear market, stay long, during a bull market, evidently long as well.
For totally new traders, I would recommend to LONG only, and set super low risk settings (cover a 50% drop for example), and see how it runs. Then, as you become a more experienced trader, you can identify trends and short as well, and/or increase your risk.
It works on all markets as long as there is volatility .
The best way to go about changing the settings, is to start off the default values. I’d run it and see how it fits your risk preferences.
There are absolutely no guarantees about this algorithm and past results are not indicative of future performance.
Fees, slippage and API delay: for any algorithm you will use (from me or others), please keep in mind that fees add up, slippage and delay creates differences between algo theory and reality. We can put in place systems to circumvent that, but we will always have them.
*** This one is SPECIAL 3COMMAS**

TSLA Low Scalp PredictorThis is a re-post, as apparently I violated house rules with posting this the last time (yikes, sorry!).
I will re-post this, if this gets taken down again, then I give up on posting scripts :-).
Anyway, this is a tool I developed for scalping TSLA short. It is coded very simply, however, the variables that dictate the coding come from advanced, statistical calculations I have done with statistical software to permit PineScript to draw conclusions based on candlestick open and close prices.
This uses the candlestick open and close prices, compares with the statistical constants that correlate to TSLA low ranges using stock trading data since TSLA's nascence in 2010. I am not really sure how else to explain this (this was TV's issue, that they couldn't understand what the coding calculations, so I really hope that this all makes sense to the powers that be!), there is a lot of stats data behind these numbers and without explaining my whole PhD thesis, I really hope that this sufficiently articulates the basis to my indicator.
In a nutshell, it uses historic data to predict low levels of of TSLA, and this historic data is magically encoded in those statistical constants that are included in my indicator programming code. The power of numerical based data is a great deal can be said by very little :).
How to use?
The indicator will give you a red line that provides a projected low value.
To use the indicator, look for major gap ups in TSLA stock. As an example, I will provide a photo below of what to look for.
Once you have identified this gap up, then you will look to the highest point and from there, go down to the indicator line, draw a trend line from that highest point. This trendline would then become your price target (see the image below):
This is not foolproof and will not work all the time, as with any indicator! But it is fairly effective. In my opinion, it would be best applied with a support/resistance based price action strategy.
Anyway, I really hope that this sufficiently explains the indicator and its clear.
Please leave any questions you have in the comments below!
Please note, I have now protected my source code seeing that I have had to disclose a little more detail than liked about my process. There is a lot of interest on TV from others in my methods. I am not interested in taking peoples money or selling my strategy but I am also not interested in being taken advantage of or having my intellectual property stolen.
I am not interested in charging people for stuff. I truly want to just help and share in this interesting world of stock trading! But, there are people that will take advantage of people like me, so please understand the situation here. I am trying to balance what TV expects in terms of disclosure, disclose enough to help someone succeed all while trying to protect the integrity of my intellectual property. This is not an easy balancing act!
Thank you all and thank you Trading View for making a platform that is easily understood by someone with absolutely no coding experience :).

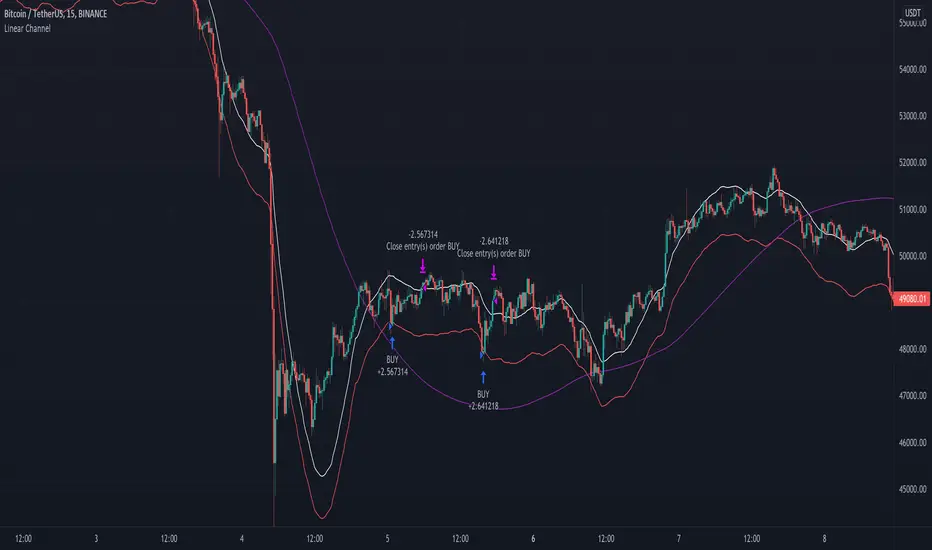
Linear Channel - Scalp Strategy 15MSimple way how to use Linear Regression for trading.
What we use:
• Linear Regression
• HMA as a trend filter
Logic:
Firstly we make simple linear regression moving. It is the white line which appears on the chart.
Then we make second line (named: band2) on the chart by multiplying linreg and value difference.
The third step is to ad HMA as a trend filter.
The trade open when price is below band2, but still upper than Hullma. The trade close when price again upper than linreg.
William %R Scalper for Gold with tortle WPRWilliam %R Scalper with Tortle WPR is small update from WPR Scalper tool. It is used with small time frame : 5 , 3 or 1 minute.
it uses tree different William %R indicators : one for fast move with 9 period WPR9 and one slow with 54 period WPR54 pLus tortle WPR 255.
You can find buy zone when WPR255< -90 WPR9 < -90 and WPR54 < -80 and sell zone when WPR 255 > -20, WPR9 > -10 AND WPR54 > -20. Tortle WPR (255) provide price trend

LTC 3-5 min scalperThis scalpler bot design for LTC and similar alts for 3-5 min chart
the scalper take profit at 1,2,3,4% exit at exit % which is our short
the buy system is modify low scaner (open script in indicator page)
plus HMA non repaint
I show in detail how to use this in my open script of low scanner strategy
there is filter that based on ema so our scalper only will buy on uptrend and less on down trend
there is leverage system if you want to use it
but you need to calculate risk reward and do your math on money magment if you use this system
So the logic here is to try to get lows and get out by the take profit and if we buy in uptrend then our chances for win will increase
you can try to change the take profit system to see if it improve this model or not
for different alts you may need to change setting
let me know if you have questions about this strategy

{INDYAN} RSI + MACDModded RSI and MACD for intraday use. If rsi above 60 and macd is above zero line then go for buy and if rsi is below 40 and macd below zero line then go for sell side. use it in small timeframe i.e. 3 minute or less.
better for scalp trading
Happy Trading
Love INDYAN
#It can be used best with INDYAN Go With Trend

BTC 5 min + ATRThis STUDY is optimized for bitcoin ( BTCPERP on deribit)
It catch fast trades going with the trend, so it should work in trends like in consolidation.
This strategy is based on S/R mixed with parabolic SAR , the point is to catch a movement when it's starting and confirmed.
It's optimized for 5 min timeframe, you might try it on other other tf but change the SL/TP too.
You should used it for few minutes scalp, fast enter and exit, on 5 min TF.
UPDATE ! This time it usenormal candle
The new idea is to filter trades by ATR, and by this way to NOT trade consolidation.
Have fun :)
Rules:
- Use small position, max leverage x5
- Place TP between 70$
- Place SL at 50$
- Entre in position by limit, you get paid for it
Enjoy, test it and make some money :)
No repaint.

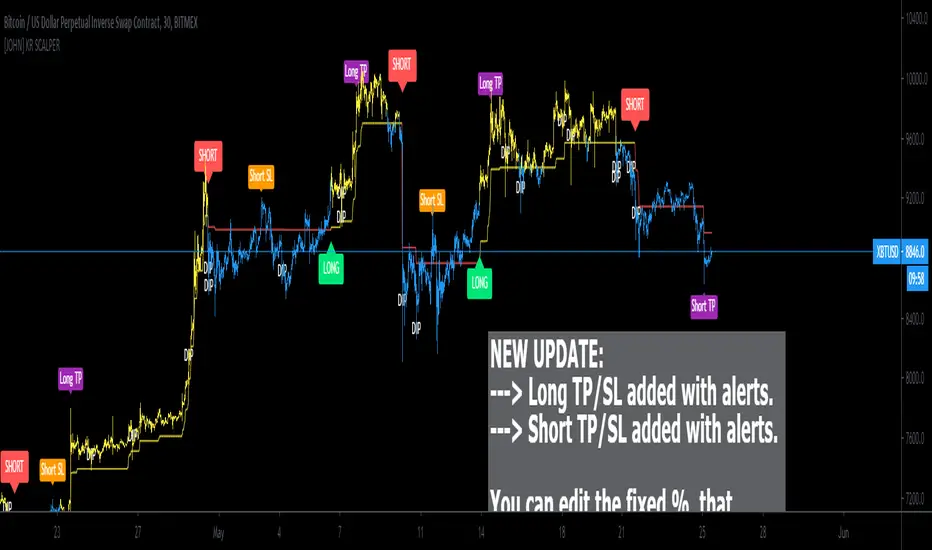
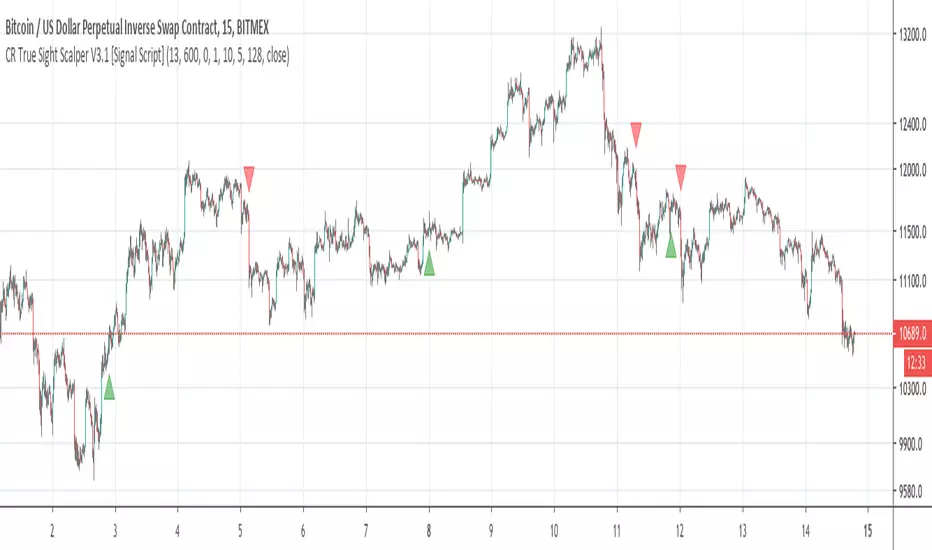
[JOHN] KR SCALPERHello this is KR SCALPER indicator. (work on crypto market)
---------------------------------
How this indicator work?
KR SCALPER script work with bollinger bands, price volatility and ATR (average true range).
This system provide
- HIGH QUALITY BUY/SELL Signals with a reasonable ROI.
- DIPS noted on chart with "DIP" TEXT, thanks to the use of bbands parameters.
- Work in cryptocurrency market, tested with top 10 coins, with good results.
- Tested on LTF (from 5m to 1h), work even on 4h, 1d.
How use it?
Indicator is setup for cryptocurrency. You can long and short by following the indications below:
GREEN LABEL = LONG
RED LABEL = SHORT
DIP noted on chart
This system write on chart with "DIP" text whenever a decrease of price/selloff occour, usually a good place to make attention if you are looking for a trade.
This is possible with the use of Bbands that helped me on this add.
Below some timeframes examples.
5 minute chart
15 minute chart
1H timeframe chart
4H timeframe chart
Below ETH USD 4H timeframe chart for reference.
----------------------------------
I hope you like and enjoy.
Good trading traders!
BTC 1 min scalping studyThis study is optimized for bitcoin ( XBTUSD on bitmex) -- version study for tests
It catch fast trades going with the trend, so it should work in trends like in consolidation.
This strategy is based on S/R mixed with parabolic SAR , the point is to catch a movement when it's starting and confirmed.
It's optimized for 1 min timeframe, you might try it on other other tf but change the SL/TP too.
You should used it for few minutes scalp, fast enter and exit, on 1 min TF.
Rules:
- Use small position, max leverage x5
- Place TP between 55 and 60 $
- Place SL at 150$
- Entre in position by limit, you get paid for it
Enjoy, test it and make some money :)

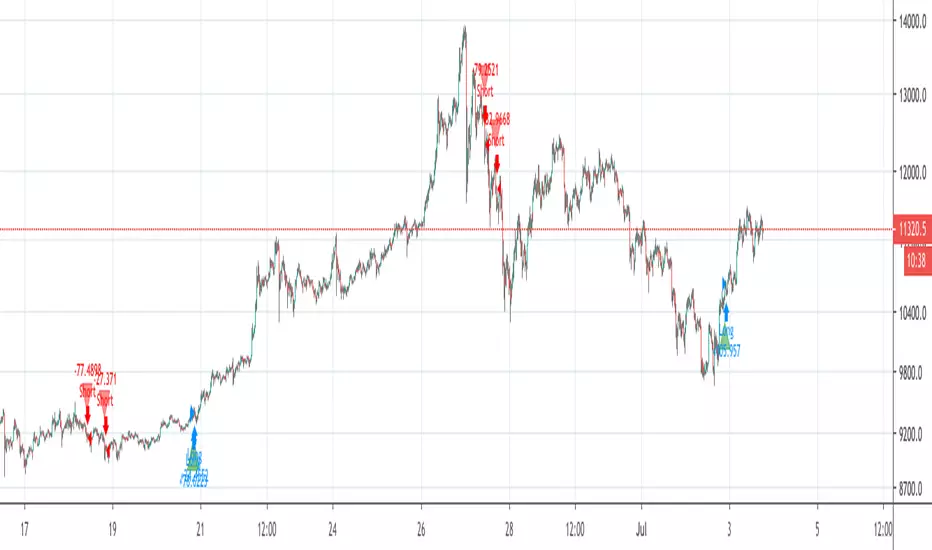
Genesis Scalper V1Genesis Scalper V 2
Genesis Scalper is an Indicator that is designed to give off Entries and Exit based on Technical Information.
Each Bar is color coded to either be green or red and uses tools such as the Macd , Vol Flow, RSI and Ma's to colour each bar.
These bar changes directly effect the color of the candles on the chart in order to show you whether or not a retrace is a shift in trend or a pull back before another leg down.
This will require manual trading and confirmation is done on change of the colour or 2 out of the 3 bars changing color in a particular way.
The lowest and largest bar is the Main decider of the Direction.
If it is green then you want to be long.
If it is Red then you want to be out of a trade or short.

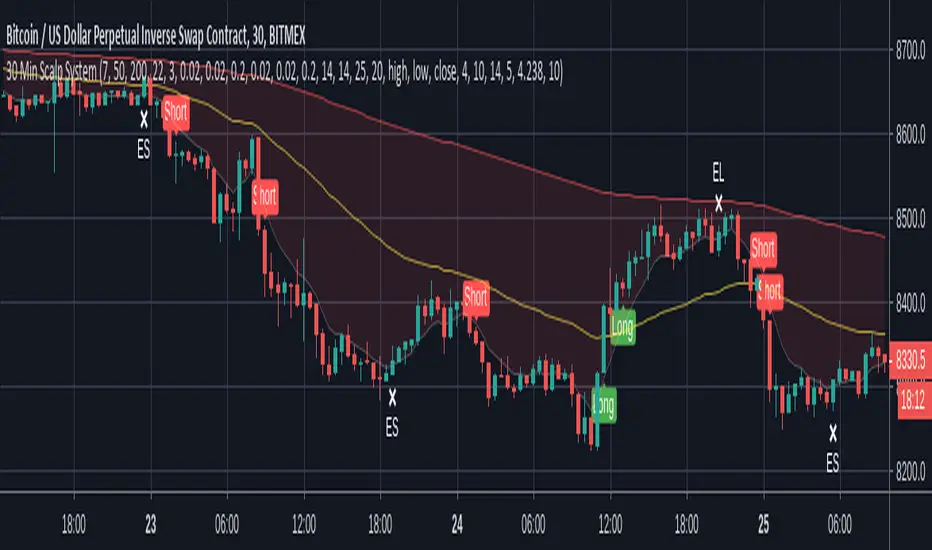
30 Min Scalp SystemA scalping script for the 30 min chart that is designed and tuned to be used with trading bots such as ProfitView or Autoview. I personally trade with this on Bitmex.
This trading system is built upon 4 established trading indicators that compliment each other. All signals are filtered in a number of ways to avoid chop and only trigger when a strong trend or crossover is identified.
Alerts are included for longs, shorts and exits in both directions.
Recommended setup:
- Trade with leverage and take 75%-80% out at 0.5% profit, leaving the rest to run
- Initial stop-loss of 1%, initiating a trailing stop of 0.75% when TP is hit
- Ensure bots are set to ignore open orders in the same direction
I use this in conjunction with ProfitView where I run three custom scripts to manage my position entries, monitor profit levels, dynamically move my stop and then exit positions where appropriate.
Note: Exit signals are show here even when trades aren't open because it's only possible to hide these when using a strategy script. This is coded as an indicator so that alerts can be sent to your chosen bot.
Disclaimer: The signals aren't perfect but no script is. The above cannot be considered financial advice and I take no responsibility from any losses incurred. A test account is recommended to verify the win rate before trading on a live platform.
Chidams Indicator Beta 1Normal mode is good for trend reversals
While scalp mode is oriented for intraday traders
Please note that it is safer to wait for candle closure

EMA cross scalp strategy 1m 5m nas100meant for scalping on NAS100 on the 5m and 1m time frames (testing version

Triangular Moving Average (TMA) bandsWhat in the world is up folks ??!??
Here's the indicator of the day. Sharing a simple one today because I'm busy coding for a few clients (fun life of a top script author on TradingView)
The TMA bands is an indicator that I discovered on FXCM a few years ago FXCM TMA bands
From the screenshot above, we see that when the price hits the lower band, it's a possible reverse BUY signal. When it hits the upper band, it's a possible SELL signal
Methodology
1) The Take Profit 1 is the middle line, Take Profit 2 is the opposite band.
2) Once the TP1 is hit, set your Stop Loss to breakeven
3) Once the TP2 is hit, if you still want to stay in the trade, set your Stop Loss to the TP1
That's what we call a trailing stop loss which I offered in the Trade Manager : Trade-Manager-Open-Source-Version/
It will be a powerful tool in your arsenal for some scalp/intraday trades
After years of coding for traders, I worked with many brokers/API/languages so I'm very used to convert a script from a broker to another one (shameless self-advertising)
PS
Tomorrow I'll share the Signal version of my Algorithm Builder:
You'll be able to connect it in a single click to a very cool Backtest System made by the Pinescripters community
In other words, I'm selling the scripts to allow you to build your own signals in a few clicks AND to connect it easily to a kick-ass backtesting tool. More to come tomorrow
Hope you'll like it, like me, love it, love me, tip me :)
____________________________________________________________
Feel free to hit the thumbs up as it shows me that I'm not doing this for nothing and will motivate to deliver more quality content in the future. (Meaning... a few likes only = no indicators = Dave enjoying the beach)
- I'm an officially approved PineEditor/LUA/MT4 approved mentor on codementor. You can request a coaching with me if you want and I'll teach you how to build kick-ass indicators and strategies
Jump on a 1 to 1 coaching with me
- You can also hire for a custom dev of your indicator/strategy/bot/chrome extension/python

APEX - Swing Aura StrategyA backtester of my new strat, it's a hybrid swing/scalp strat that really looks for quick low profits. Will keep it hidden as it's a bit of a work in progress right now. Working on it to perform well enough with the Apex Trading bot, ran it for a day now and it ended the day on a 1.78% portfolio profit, so I'm really pleased with that.
As for details it's based on Keltner Channels, Bolingers Bands and a Ichimoku cloud. To spice it up there's even a Wave trend in there as well!
All the settings for the bits and parts are changeable so feel free to mess around with them, but will keep my sell triggers fixed for now, so no editing of those from within the script unfortunately.
Enjoy!

PerPro Crypto ScalperPerPro Crypto Scalper es un algoritmo que funciona con 4 robot internos que trabajan sincronisadamente para enviar una senal de trading.
Según el crypto que se desee tradear es la configuración que le debemos colocar en trailing stop y take profit.
PerPro Crypto Scalper (CS) is an algorithm system with
with 4 internal robots that work synchronously to send you a trading signal.
Depending on the type of crypto you want to trade, it is the setting that must be configured. that I sent it by private message

ezy scalp Mr.HokageJadi di indikator ini memiliki 3 garis Yang memiliki beberapa fungsi
Garis merah Menjadi support mid term atau trend mid term Jadi Jika garis Merah tetap di warna merah berarti Harga akan koreksi atau masih koreksi dan Jika berubah menjadi Hijau maka Harga Bullish untuk mid term tergantung timeframe yg kalian pakai dan Jika garis ini di tembus harga itu bisa menjadi pertanda reversal atau perubahan arah
Lalu ada garis Kuning dan Putih itu bisa menjadi resistance atau support sementara
bagaimana Trading menggunakan indikator ini?
untuk scalping kalian bisa menggunakan Garis Kuning dan putih eksekusinya mengikuti garis tersebut misalkan Garis Putih berubah menjadi Hijau maka lakukan Buy dan targetnya adalah garis Kuning Begitu juga jika garis kuning berubah Menjadi hijau maka lakukan Buy targetnya adalah garis merah dan misalkan 3 garis tersebut sama sama Hijau berarti Bullish yang kuat dan Jika garis tiba tiba dari hijau berubah menjadi warna lain ntah itu kuning merah atau putih berarti harga akan turun/koreksi
Kuncinya ada di garis merah Jika harga menembus garis ini ntah itu dari bawah ke atas itu berarti bullish dan jika dari atas ke bawah itu artinya bearish dan cukup berdampak Besar
