CharisGold FX Dashboard v2.8 (Signals + Alerts)this strategy is a trend line follower using EMA LOW (2 3 6 9) for scalping EMA LOW(25 34 89 110 355 and 480 )for trend direction
"scalping"に関するスクリプトを検索

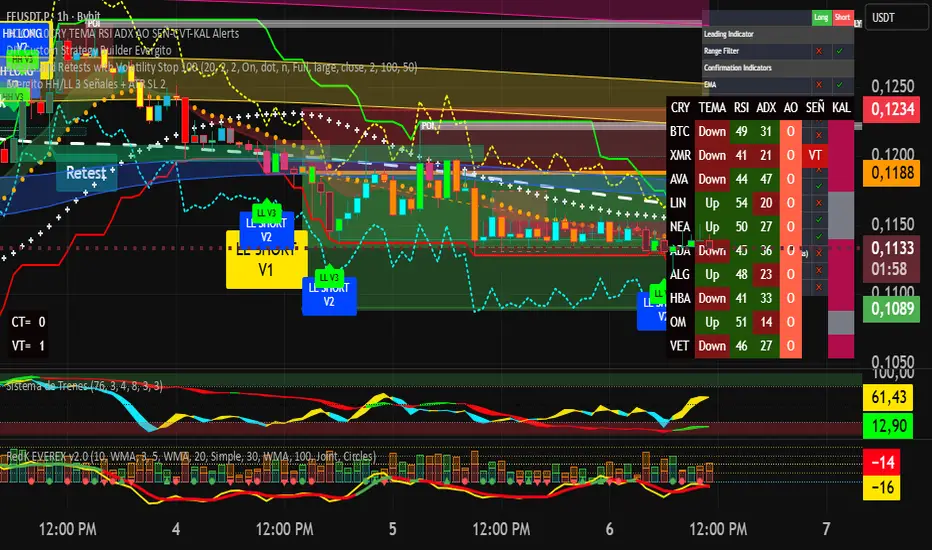
Evergito HH/LL 3 Señales + ATR SL 2How to trade with the Evergito HH/LL 3 Signals + ATR SL indicator? Brief and direct explanation: General system logic: The indicator looks for actual breakouts of the high/low of the last 20 bars (HH/LL) and combines them with the position relative to the 200 SMA to filter the underlying trend. You have 3 types of signals that you can activate/deactivate separately: Signal
When it appears
What it means in practice
Entry type
V1
HH breakout + the close crosses above the 200 SMA (or the opposite in a short position)
Very safe entry confirmed. The price has just validated the long/flat trend → safer and with a better ratio
The most reliable (the original)
V2
HH breakout but the price was already above the 200 SMA (or already below in a short position)
Entry in an already established trend. Fewer “surprises”, more continuity
Ideal for strong trends
V3
Only the breakout of the HH or LL, without looking at the 200 SMA
Aggressive entry/scalping on explosive breakouts. More signals, more noise.
For times of high volatility.
How to enter the market (simple rule): Wait for any of the 3 labels (V1, V2, or V3) to appear, depending on which ones you have activated.
Enter at the close of that candle (or at the open of the next one if you are conservative).
Automatic Stop Loss → the blue (long) or yellow (short) line that represents the ATR x2.
Take Profit → you decide, but the indicator already gives you the visual reference for the risk (ATR x2), so 1:2 or 1:3 is usually very convenient.
Practical example: You see a large green label “HH LONG V1” → you go long at the close of that candle. Stop right at the blue line (ATR x2 below the price).
Typical target: 2x or 3x the risk (very common to reach it in a trend).
Recommended use: Most traders leave only V1 activated → fewer signals but very high quality.
Those who trade intraday or crypto usually combine V1 + V2.
V3 only for news events or very volatile openings.
In summary:
Label = immediate entry
Blue/yellow line = automatic stop
And enjoy the move.
Evergito HH/LL 3 Señales + ATR SLHow to trade with the Evergito HH/LL 3 Signals + ATR SL indicator? Brief and direct explanation: General system logic: The indicator looks for actual breakouts of the high/low of the last 20 bars (HH/LL) and combines them with the position relative to the 200 SMA to filter the underlying trend. You have 3 types of signals that you can activate/deactivate separately: Signal
When it appears
What it means in practice
Entry type
V1
HH breakout + the close crosses above the 200 SMA (or the opposite in a short position)
Very safe entry confirmed. The price has just validated the long/flat trend → safer and with a better ratio
The most reliable (the original)
V2
HH breakout but the price was already above the 200 SMA (or already below in a short position)
Entry in an already established trend. Fewer “surprises”, more continuity
Ideal for strong trends
V3
Only the breakout of the HH or LL, without looking at the 200 SMA
Aggressive entry/scalping on explosive breakouts. More signals, more noise.
For times of high volatility.
How to enter the market (simple rule): Wait for any of the 3 labels (V1, V2, or V3) to appear, depending on which ones you have activated.
Enter at the close of that candle (or at the open of the next one if you are conservative).
Automatic Stop Loss → the blue (long) or yellow (short) line that represents the ATR x2.
Take Profit → you decide, but the indicator already gives you the visual reference for the risk (ATR x2), so 1:2 or 1:3 is usually very convenient.
Practical example: You see a large green label “HH LONG V1” → you go long at the close of that candle. Stop right at the blue line (ATR x2 below the price).
Typical target: 2x or 3x the risk (very common to reach it in a trend).
Recommended use: Most traders leave only V1 activated → fewer signals but very high quality.
Those who trade intraday or crypto usually combine V1 + V2.
V3 only for news events or very volatile openings.
In summary:
Label = immediate entry
Blue/yellow line = automatic stop
And enjoy the move.

RSI + MACD Day Trading Toolkit//@version=6
indicator("RSI + MACD Day Trading Toolkit", overlay = true)
//──────────────────────────────────────────────────────────────────────────────
// 1. INPUTS
//──────────────────────────────────────────────────────────────────────────────
// RSI settings
rsiLength = input.int(14, "RSI Length")
rsiOverbought = input.float(70, "RSI Overbought Level", minval = 50, maxval = 100)
rsiOversold = input.float(30, "RSI Oversold Level", minval = 0, maxval = 50)
// MACD settings (classic 12 / 26 / 9)
macdFastLength = input.int(12, "MACD Fast Length")
macdSlowLength = input.int(26, "MACD Slow Length")
macdSignalLength = input.int(9, "MACD Signal Length")
// Risk model selection
riskModel = input.string("ATR", "Risk Model", options = )
// ATR-based SL/TP
atrLength = input.int(14, "ATR Length")
atrSLMult = input.float(1.5, "SL ATR Multiplier", minval = 0.1, step = 0.1)
atrTPMult = input.float(2.5, "TP ATR Multiplier", minval = 0.1, step = 0.1)
// Percent-based SL/TP (for scalping on very tight spreads)
slPercent = input.float(0.5, "SL % (when Risk Model = Percent)", minval = 0.05, step = 0.05)
tpPercent = input.float(1.0, "TP % (when Risk Model = Percent)", minval = 0.05, step = 0.05)
// Visual / styling
showSLTPLines = input.bool(true, "Plot Stop Loss / Take Profit Lines")
//──────────────────────────────────────────────────────────────────────────────
// 2. CORE INDICATORS: RSI & MACD
//──────────────────────────────────────────────────────────────────────────────
rsiValue = ta.rsi(close, rsiLength)
// Manual MACD calculation (avoids tuple unpacking issues)
macdFastEMA = ta.ema(close, macdFastLength)
macdSlowEMA = ta.ema(close, macdSlowLength)
macdValue = macdFastEMA - macdSlowEMA
macdSignal = ta.ema(macdValue, macdSignalLength)
macdHist = macdValue - macdSignal
atrValue = ta.atr(atrLength)
// Hide internal plots from price scale (still accessible if you change display)
plot(rsiValue, "RSI", display = display.none)
plot(macdValue, "MACD", display = display.none)
plot(macdSignal, "MACD Sig", display = display.none)
plot(macdHist, "MACD Hist", display = display.none)
//──────────────────────────────────────────────────────────────────────────────
// 3. SIGNAL LOGIC (ENTRY CONDITIONS)
//──────────────────────────────────────────────────────────────────────────────
//
// Idea:
// - LONG bias: RSI emerges from oversold AND MACD crosses above signal below zero
// - SHORT bias: RSI falls from overbought AND MACD crosses below signal above zero
//
// Combines momentum (RSI) with trend confirmation (MACD).
//──────────────────────────────────────────────────────────────────────────────
// RSI events
rsiBullCross = ta.crossover(rsiValue, rsiOversold) // RSI crosses UP out of oversold
rsiBearCross = ta.crossunder(rsiValue, rsiOverbought) // RSI crosses DOWN from overbought
// MACD crossover with trend filter
macdBullCross = ta.crossover(macdValue, macdSignal) and macdValue < 0 // Bullish cross below zero-line
macdBearCross = ta.crossunder(macdValue, macdSignal) and macdValue > 0 // Bearish cross above zero-line
// Raw (ungated) entry signals
rawLongSignal = rsiBullCross and macdBullCross
rawShortSignal = rsiBearCross and macdBearCross
//──────────────────────────────────────────────────────────────────────────────
// 4. STATE MANAGEMENT (SIMULATED POSITION TRACKING)
//──────────────────────────────────────────────────────────────────────────────
//
// position: 1 = long
// -1 = short
// 0 = flat
//
// We track entry price and SL/TP levels as if this were a strategy.
// This is still an indicator – it just computes and plots the logic.
//──────────────────────────────────────────────────────────────────────────────
var int position = 0
var float longEntryPrice = na
var float shortEntryPrice = na
var float longSL = na
var float longTP = na
var float shortSL = na
var float shortTP = na
// Per-bar flags (for plotting / alerts)
var bool longEntrySignal = false
var bool shortEntrySignal = false
var bool longExitSignal = false
var bool shortExitSignal = false
// Reset per-bar flags each bar
longEntrySignal := false
shortEntrySignal := false
longExitSignal := false
shortExitSignal := false
//──────────────────────────────────────────────────────────────────────────────
// 5. EXIT LOGIC (STOP LOSS / TAKE PROFIT / OPPOSITE SIGNAL)
//──────────────────────────────────────────────────────────────────────────────
//
// Exits are evaluated BEFORE new entries on each bar.
//──────────────────────────────────────────────────────────────────────────────
// Stop-loss / take-profit hits for existing positions
longStopHit = position == 1 and not na(longSL) and low <= longSL
longTakeHit = position == 1 and not na(longTP) and high >= longTP
shortStopHit = position == -1 and not na(shortSL) and high >= shortSL
shortTakeHit = position == -1 and not na(shortTP) and low <= shortTP
// Opposite signals can also close positions
reverseToShort = position == 1 and rawShortSignal
reverseToLong = position == -1 and rawLongSignal
// Combine exit conditions
longExitNow = longStopHit or longTakeHit or reverseToShort
shortExitNow = shortStopHit or shortTakeHit or reverseToLong
// Register exits and flatten position
if longExitNow and position == 1
longExitSignal := true
position := 0
longEntryPrice := na
longSL := na
longTP := na
if shortExitNow and position == -1
shortExitSignal := true
position := 0
shortEntryPrice := na
shortSL := na
shortTP := na
//──────────────────────────────────────────────────────────────────────────────
// 6. ENTRY LOGIC WITH RISK MODEL (SL/TP CALCULATION)
//──────────────────────────────────────────────────────────────────────────────
//
// Only take a new trade when flat.
// SL/TP are calculated relative to entry price using either ATR or Percent.
//──────────────────────────────────────────────────────────────────────────────
if position == 0
// Long entry
if rawLongSignal
position := 1
longEntryPrice := close
if riskModel == "ATR"
longSL := longEntryPrice - atrValue * atrSLMult
longTP := longEntryPrice + atrValue * atrTPMult
else // Percent model
longSL := longEntryPrice * (1.0 - slPercent / 100.0)
longTP := longEntryPrice * (1.0 + tpPercent / 100.0)
longEntrySignal := true
// Short entry
else if rawShortSignal
position := -1
shortEntryPrice := close
if riskModel == "ATR"
shortSL := shortEntryPrice + atrValue * atrSLMult
shortTP := shortEntryPrice - atrValue * atrTPMult
else // Percent model
shortSL := shortEntryPrice * (1.0 + slPercent / 100.0)
shortTP := shortEntryPrice * (1.0 - tpPercent / 100.0)
shortEntrySignal := true
//──────────────────────────────────────────────────────────────────────────────
// 7. PLOTTING: ENTRIES, EXITS, STOPS & TARGETS
//──────────────────────────────────────────────────────────────────────────────
// Entry markers
plotshape(longEntrySignal, title = "Long Entry", style = shape.triangleup, location = location.belowbar, color = color.new(color.lime, 0), size = size.small, text = "LONG")
plotshape(shortEntrySignal, title = "Short Entry", style = shape.triangledown, location = location.abovebar, color = color.new(color.red, 0), size = size.small, text = "SHORT")
// Exit markers (generic exits: SL, TP or reversal)
plotshape(longExitSignal, title = "Long Exit", style = shape.xcross, location = location.abovebar, color = color.new(color.orange, 0), size = size.tiny, text = "LX")
plotshape(shortExitSignal, title = "Short Exit", style = shape.xcross, location = location.belowbar, color = color.new(color.orange, 0), size = size.tiny, text = "SX")
// Optional: show SL/TP levels on chart while in position
plot(showSLTPLines and position == 1 ? longSL : na, title = "Long Stop Loss", style = plot.style_linebr, color = color.new(color.red, 0), linewidth = 1)
plot(showSLTPLines and position == 1 ? longTP : na, title = "Long Take Profit", style = plot.style_linebr, color = color.new(color.lime, 0), linewidth = 1)
plot(showSLTPLines and position == -1 ? shortSL : na, title = "Short Stop Loss", style = plot.style_linebr, color = color.new(color.red, 0), linewidth = 1)
plot(showSLTPLines and position == -1 ? shortTP : na, title = "Short Take Profit", style = plot.style_linebr, color = color.new(color.lime, 0), linewidth = 1)
//──────────────────────────────────────────────────────────────────────────────
// 8. ALERT CONDITIONS
//──────────────────────────────────────────────────────────────────────────────
//
// Configure TradingView alerts using these conditions.
//──────────────────────────────────────────────────────────────────────────────
// Entry alerts
alertcondition(longEntrySignal, title = "Long Entry (RSI+MACD)", message = "RSI+MACD: Long entry signal")
alertcondition(shortEntrySignal, title = "Short Entry (RSI+MACD)", message = "RSI+MACD: Short entry signal")
// Exit alerts (by type: SL vs TP vs reversal)
alertcondition(longStopHit, title = "Long Stop Loss Hit", message = "RSI+MACD: Long STOP LOSS hit")
alertcondition(longTakeHit, title = "Long Take Profit Hit", message = "RSI+MACD: Long TAKE PROFIT hit")
alertcondition(shortStopHit, title = "Short Stop Loss Hit", message = "RSI+MACD: Short STOP LOSS hit")
alertcondition(shortTakeHit, title = "Short Take Profit Hit", message = "RSI+MACD: Short TAKE PROFIT hit")
alertcondition(reverseToShort, title = "Long Exit by Reverse Signal", message = "RSI+MACD: Long exit by SHORT reverse signal")
alertcondition(reverseToLong, title = "Short Exit by Reverse Signal", message = "RSI+MACD: Short exit by LONG reverse signal")
//──────────────────────────────────────────────────────────────────────────────
// 9. QUICK USAGE NOTES
//──────────────────────────────────────────────────────────────────────────────
//
// - Indicador, não estratégia: ele simula posição, SL/TP e sinais de saída.
// - Para backtest/auto, basta portar a mesma lógica para um script `strategy()`
// usando `strategy.entry` e `strategy.exit`.
// - Em day trade, teste ATR vs Percent e ajuste os multiplicadores ao ativo.
//──────────────────────────────────────────────────────────────────────────────

DarkPool FlowDarkPool Flow is a professional-grade technical analysis tool designed to align retail traders with the dominant "smart money" flow. Unlike standard moving average crossovers that often generate false signals during consolidation, this script employs a multi-layered filtering engine to isolate high-probability trends.
The core philosophy of this indicator is that Trends are fractal. A sustainable move on a lower timeframe must be supported by momentum on a higher timeframe. By comparing a "Fast Signal Trend" against a "Slow Anchor Trend" (e.g., Daily vs. Weekly), the script identifies the market bias used by institutional algorithms.
This edition features a Smart Recovery Engine, ensuring that valid trends are not missed simply because momentum started slowly, and a Dynamic Cloud that visually represents the strength of the trend spread.
Key Features
1. Auto-Adaptive Timeframe Logic
The script eliminates the guesswork of Multi-Timeframe (MTF) selection. By enabling "Auto-Adapt," the indicator detects your current chart timeframe and automatically maps it to the mathematically correct institutional pairings:
Scalping (<15m): Uses 15-Minute Trend vs. 1-Hour Anchor.
Day Trading (15m - 1H): Uses 4-Hour Trend vs. Daily Anchor.
Swing Trading (4H - Daily): Uses Daily Trend vs. Weekly Anchor (The classic "Golden" setup).
Investing (Weekly): Uses 21-Week EMA vs. 50-Week SMA (Bull Market Support Band logic).
2. Smart Recovery Signal Engine
Standard crossover scripts often miss major moves if the specific breakout candle has low volume or weak ADX. This script utilizes a state-machine logic that "remembers" the trend direction. If a trend begins during low volatility (gray candles), the script waits. The moment volatility and momentum confirm the move, a Smart Recovery Signal is triggered, allowing you to enter an existing trend safely.
3. Chop Protection (Gray Candles)
Preservation of capital is the priority. The script analyzes the Average Directional Index (ADX) and Volatility (ATR).
Colored Candles (Green/Red): The market is trending with sufficient strength. Trading is permitted.
Gray Candles: The market is in a low-energy chop or consolidation (ADX < 20). Trading is discouraged.
4. Dynamic Trend Cloud
The space between the Fast and Slow trends is filled with a dynamic cloud.
Darker/Opaque Cloud: Indicates a widening spread, suggesting accelerating momentum.
Lighter/Transparent Cloud: Indicates a narrowing spread, suggesting the trend may be weakening or consolidating.
5. Pullback & Retest Signals (+)
While triangles mark the start of a trend, the Plus (+) signs mark low-risk opportunities to add to a position. These appear when price dips into the cloud, finds support at the "Fair Value" zone, and closes back in the direction of the trend with confirmed momentum.
User Guide & Strategy
Setup
Add the indicator to your chart.
For Beginners: Enable "Auto-Adaptive Timeframes" in the settings.
For Advanced Users: Disable Auto-Adapt and manually configure your Fast/Slow pairings (Default is Daily 50 EMA / Weekly 50 EMA).
Signal Mode: Choose "First Breakout Only" for a cleaner chart, or "All Signals" if you wish to see re-entry points during choppy starts.
Long Entry Criteria (Buy)
Trend: The Cloud must be Green (Fast Trend > Slow Trend).
Signal: A Green Triangle appears below the bar.
Confirmation: The signal candle must not be Gray.
Re-Entry: A small Green (+) sign appears, indicating a successful test of the cloud support.
Short Entry Criteria (Sell)
Trend: The Cloud must be Red (Fast Trend < Slow Trend).
Signal: A Red Triangle appears above the bar.
Confirmation: The signal candle must not be Gray.
Re-Entry: A small Red (+) sign appears, indicating a successful test of the cloud resistance.
Stop Loss & Risk Management
Stop Loss: A standard institutional stop loss is placed just beyond the Slow Trend Line (the outer edge of the cloud). If price closes beyond the Slow Trend, the macro thesis is invalid.
Take Profit: Target liquidity pools or use a trailing stop based on the Fast Trend line.
Settings Overview
Mode Selection: Toggle between Auto-Adaptive logic or Manual control.
Manual Configuration: Define the specific Timeframe, Length, and Type (EMA, SMA, WMA) for both Fast and Slow trends.
Signal Logic: Toggle "Show Pullback Signals" on/off. Switch between "First Breakout" or "All Signals."
Quality Filters: Toggle individual filters (ATR, RSI, ADX) to adjust sensitivity. Turning these off makes the script more responsive but increases false signals.
Visual Style: Customize colors for Bullish, Bearish, and Neutral (Gray) states. Adjust cloud transparency.
Disclaimer
Risk Warning: Trading financial markets involves a high degree of risk and is not suitable for all investors. You could lose some or all of your initial investment.
Educational Use Only: This script and the information provided herein are for educational and informational purposes only. They do not constitute financial advice, investment advice, trading advice, or any other recommendation.
No Guarantee: Past performance of any trading system or methodology is not necessarily indicative of future results. The "Institutional Trend" indicator is a tool to assist in technical analysis, not a crystal ball. The creators of this script assume no responsibility or liability for any trading losses or damages incurred as a result of using this tool. Always perform your own due diligence and consult with a qualified financial advisor before making investment decisions.

White Crow**White Crow — cluster reversal signals + market structure**
> Indicator that helps you read market structure (pivots, trend, last extremes) and spot potential reversals through CCI/RSI signal clusters. This is *not* a standalone trading system and does not guarantee any result — it is a tool for filtering and confirming your own market ideas.
---
## 1. Concept
White Crow combines three core blocks:
1. **Pivots & market structure**
Automatically detects **local tops/bottoms** and derives a *Bullish / Bearish / Sideways* bias from them.
In the top-right corner you see a compact panel with current trend and **Last Bottom / Last Top** prices.
2. **Momentum & overbought/oversold zones**
Inside, the indicator uses:
* **CCI** with fixed levels `+100 / -100`;
* an optional **RSI filter** with overbought/oversold levels (`80 / 20`).
These generate basic *Buy / Close* signals.
3. **Cluster signals Buy X / CloseV**
The script tracks **clusters of signals inside a 4-bar window** and highlights rarer, “amplified” events:
* **Buy X** — cluster buy signal (multiple buy conditions in a row);
* **CloseV** — cluster signal for exit/reversal.
**Buy X and CloseV are the strongest and most reliable signals in this indicator** because they are based on repeated conditions rather than a single bar. They work **best on higher timeframes (1H–4H)**, where they reflect meaningful shifts in order flow instead of noise.
> ⚠️ Important: Buy X and CloseV are *only signals*. They must be used as **one of several confirmation factors** for your own view of market structure (support/resistance, trend, price action, volume, etc.), not as standalone reasons to enter or exit trades.
---
## 2. How it works
### 2.1. Pivots and trend detection
* The indicator builds a **zigzag-like structure**:
after a local high, once price retraces down by a given percentage (`pivotSigma`), a **Top** is marked;
after a local low, once price retraces up by the same percentage, a **Bottom** is marked.
* Using the sequence of recent tops and bottoms, the script determines the trend:
* *Bullish* — the last low is higher than the previous one (HL);
* *Bearish* — the last high is lower than the previous one (LH);
* otherwise — *Sideways*.
* The info table shows:
* **Market Trend** — Bullish / Bearish / Sideways;
* **Last Bottom / Last Top** with adaptive decimal precision (works for crypto, FX, stocks, etc.).
### 2.2. Base Buy / Close signals
* **Long condition (Buy):**
* `CCI < -100` (oversold),
* if RSI filter is enabled — `RSI < 20`.
* **Short/Exit condition (Close):**
* `CCI > +100` (overbought),
* if RSI filter is enabled — `RSI > 80`.
These conditions generate the regular **Buy** and **Close** labels on the chart.
### 2.3. Clusters: Buy X and CloseV
To reduce noise, the indicator evaluates not only the current bar, but also the **last 4 bars**:
* `buy_count` — how many times the long condition was true within the last 4 bars;
* `sell_count` — how many times the short condition was true within the last 4 bars.
Then:
* **Buy X** appears when:
* `buy_count ≥ 2` (conditions for Buy were met on at least 2 of the last 4 bars),
* the time filter between two Buy X signals is satisfied (`Min Bars Between Signals`).
* **CloseV** appears when:
* `sell_count ≥ 2`,
* the required number of bars has passed since the previous CloseV.
> ✅ This is why **Buy X / CloseV are stronger and more trustworthy than single Buy/Close signals**, especially on **1H–4H** timeframes: the market confirms the same overbought/oversold condition several times in a row.
### 2.4. Order Blocks
* When `Show Order Blocks` is enabled, the indicator highlights **impulsive candles** whose body exceeds a threshold based on ATR.
* Colored rectangles mark **potential order blocks** (areas where strong buying or selling previously occurred).
## 3. Inputs and customization
Inputs are grouped in TradingView-friendly categories.
### 3.1. Pivot Settings
* `Show Pivots` — enable/disable **Top / Bottom** markers.
* `Sigma (% retracement)` — pivot sensitivity (minimum retracement in % required to confirm a pivot).
* Colors for Top/Bottom — for visual tuning.
**Tip:**
On H1–H4 you can keep near-default values.
On lower timeframes, reduce `Sigma` if you want more detailed local structure.
### 3.2. CCI / RSI Settings
* `CCI Period` — CCI length (short by default for faster reaction).
* `Enable RSI Filter` / `RSI Period` — toggle and length for RSI filter.
* RSI levels are fixed at **20 / 80** to mark strong oversold/overbought zones.
**Usage:**
* For more conservative entries — keep the RSI filter enabled.
* For more frequent signals (e.g. scalping) — you can disable the RSI filter.
### 3.3. Order Blocks
* `Show Order Blocks` — display order block zones.
* `Block Threshold (ATR multiplier)` — how large a candle must be (vs ATR) to be considered significant.
### 3.4. Signals & Filters
* `Show Buy / Show Buy X / Show Close / Show CloseV` — choose which labels you want to see.
* `Enable Time Filter` — enable minimum spacing between amplified signals.
* `Min Bars Between Signals` — how many bars must pass between two Buy X or two CloseV signals.
**Tip:**
If you see too many amplified signals, increase `Min Bars Between Signals`.
If you want more activity, decrease it.
### 3.5. Alerts
* `Buy Alerts / Buy X Alerts / Close Alerts / CloseV Alerts` — choose which signal types should trigger alerts.
* `One Alert Per Bar` — when enabled, alerts are triggered only once per bar (recommended for H1–H4).
Alerts are generated via `alert()`, with messages that include signal type, ticker, timeframe and current price.
---
## 4. How to trade with White Crow
### 4.1. Recommended timeframes
* 📌 **Main focus: 1H–4H.**
On these timeframes:
* pivots and trend are more stable;
* CCI/RSI reflect meaningful swings;
* **Buy X / CloseV clusters** filter out a lot of intrabar noise.
You can still experiment on M1–M15, but expect more signals and more sensitivity to noise.
### 4.2. Reading the signals step by step
1. **Start with context**
* Look at **Market Trend / Last Bottom / Last Top** in the info panel.
* See where price is relative to these points: near resistance, near support, inside a range, etc.
2. **Identify zones of interest**
* Use pivots and order blocks as potential support/resistance areas.
* Wait for price to approach these zones.
3. **Watch the signals**
* **Buy** — early sign of local oversold conditions.
* **Buy X** — amplified cluster signal; more weight than a single Buy.
* **Close** — early warning of potential exhaustion in the current move.
* **CloseV** — amplified cluster exit/reversal signal.
4. **Practical approach**
* In a *Bullish* trend:
* focus on **Buy / Buy X** near bottoms and demand blocks;
* use **Close / CloseV** for partial profit-taking or tightening stops.
* In a *Bearish* trend:
* focus on **Close / CloseV** near tops and supply blocks;
* use **Buy / Buy X** mainly for countertrend scalps with strict risk control.
---
## 5. Important notes and disclaimer
1. **Buy X / CloseV are stronger — but not “magic” signals.**
They are statistically more meaningful than single Buy/Close signals because:
* they require multiple confirmations within a cluster;
* they are time-filtered.
However, **false signals are still possible**, especially in news spikes and low-liquidity conditions.
2. **Best performance on higher timeframes (1H–4H).**
Here, Buy X and CloseV usually reflect genuine shifts in supply/demand rather than micro noise.
3. **This is a confirmation tool, not a complete system.**
Pro Trading White Crow:
* does not manage risk;
* does not define position size or stop-loss;
* does not replace your own analysis.
Always use its signals as **one of several confluence factors** together with structure, trend, price action, volume, and your trading plan.
4. **Educational purpose only.**
This script and description are for educational and analytical purposes only.
They **do not constitute investment advice or a guarantee of profit**.
You are fully responsible for all trading decisions and risk management.
---
---
## White Crow — кластерные сигналы разворота + структура рынка
> Индикатор помогает читать рыночную структуру (пивоты, тренд, последние экстремумы) и находить потенциальные развороты через кластеры сигналов CCI/RSI. Это *не* готовая торговая система и *не* гарантия результата — а инструмент для фильтрации и подтверждения ваших собственных идей по рынку.
---
## 1. Концепция
White Crow объединяет три ключевых блока:
1. **Пивоты и структура рынка**
Автоматически находит **локальные вершины и впадины** и на их основе формирует трендовое смещение: *Bullish / Bearish / Sideways*.
В правом верхнем углу — компактная панель с текущим трендом и ценами **Last Bottom / Last Top**.
2. **Моментум и зоны перегрева**
Внутри используются:
* **CCI** с фиксированными уровнями `+100 / -100`;
* опциональный **фильтр RSI** с уровнями перепроданности/перекупленности (`20 / 80`).
По ним строятся базовые сигналы *Buy / Close*.
3. **Кластерные сигналы Buy X / CloseV**
Скрипт отслеживает **кластеры сигналов внутри окна в 4 бара** и выделяет более редкие, «усиленные» события:
* **Buy X** — кластерный сигнал покупки (несколько buy-условий подряд);
* **CloseV** — кластерный сигнал выхода/разворота.
Именно **Buy X и CloseV являются наиболее сильными и достоверными сигналами индикатора**, так как возникают при повторяющемся выполнении условий, а не на одном баре. Лучше всего они работают **на старших таймфреймах (1–4 часа)**, где отражают реальное смещение баланса спроса/предложения, а не рыночный шум.
> ⚠️ Важно: Buy X и CloseV — *это всего лишь сигналы*. Они должны использоваться **как один из факторов подтверждения** вашего видения структуры рынка (уровни, тренд, price action, объём и т.д.), а не как единственная причина для входа или выхода.
---
## 2. Как это работает
### 2.1. Пивоты и определение тренда
* Индикатор строит **структуру в стиле зигзага**:
после локального максимума, когда цена откатывает вниз на заданный процент (`pivotSigma`), отмечается **Top**;
после локального минимума, когда цена откатывает вверх на тот же процент, отмечается **Bottom**.
* По последовательности последних вершин и впадин определяется тренд:
* *Bullish* — последний минимум выше предыдущего (HL);
* *Bearish* — последний максимум ниже предыдущего (LH);
* иначе — *Sideways*.
* В информационной таблице отображаются:
* **Market Trend** — Bullish / Bearish / Sideways;
* **Last Bottom / Last Top** с адаптивным количеством знаков (подходит под крипту, форекс, акции и т.д.).
### 2.2. Базовые сигналы Buy / Close
* **Условие для Buy (лонг):**
* `CCI < -100` (зона перепроданности),
* при включённом фильтре — `RSI < 20`.
* **Условие для Close (шорт/выход):**
* `CCI > +100` (зона перекупленности),
* при включённом фильтре — `RSI > 80`.
По этим условиям индикатор рисует обычные метки **Buy** и **Close**.
### 2.3. Кластеры: Buy X и CloseV
Чтобы отсеять лишний шум, индикатор оценивает не только текущий бар, но и **4 последних бара**:
* `buy_count` — сколько раз условие на покупку выполнялось за последние 4 бара;
* `sell_count` — сколько раз условие на продажу/выход выполнялось за последние 4 бара.
Далее:
* **Buy X** появляется, когда:
* `buy_count ≥ 2` (минимум на 2 из 4 баров были условия для покупки),
* соблюдён фильтр по времени между усиленными сигналами (`Min Bars Between Signals`).
* **CloseV** появляется, когда:
* `sell_count ≥ 2`,
* прошло достаточно баров с момента предыдущего CloseV.
> ✅ Поэтому **Buy X и CloseV заметно сильнее и надёжнее одиночных Buy/Close**, особенно на **таймфреймах 1–4 часа**: рынок несколько раз подряд подтверждает один и тот же перегрев/разрядку момента.
### 2.4. Order Blocks
* При включённом `Show Order Blocks` индикатор выделяет **импульсные свечи**, чьё тело больше заданного множителя ATR.
* По таким свечам строятся цветные прямоугольники — **потенциальные блоки ордеров** (области поддержек/сопротивлений, где ранее проходил крупный объём).
---
## 3. Настройки и кастомизация
Настройки сгруппированы в привычные разделы TradingView.
### 3.1. Pivot Settings
* `Show Pivots` — включить/выключить метки **Top / Bottom**.
* `Sigma (% retracement)` — чувствительность к пивотам (минимальная глубина отката в процентах).
* Цвета Top/Bottom — визуальная настройка.
**Совет:**
На H1–H4 можно оставить значения близкие к стандартным.
На младших ТФ уменьшайте `Sigma`, если нужна более детальная структура.
### 3.2. CCI / RSI Settings
* `CCI Period` — период CCI (по умолчанию короткий, для более быстрой реакции).
* `Enable RSI Filter` / `RSI Period` — включение и длина RSI-фильтра.
* Уровни RSI фиксированы: **20 / 80**, выделяя сильную перепроданность/перекупленность.
**Использование:**
* Для более консервативной торговли — держите фильтр RSI включённым.
* Для более частых сигналов (скальпинг и т.п.) — можно фильтр отключить.
### 3.3. Order Blocks
* `Show Order Blocks` — отображение блоков ордеров.
* `Block Threshold (ATR multiplier)` — насколько большой должна быть свеча относительно ATR, чтобы считаться значимой.
### 3.4. Signals & Filters
* `Show Buy / Show Buy X / Show Close / Show CloseV` — выбор типов отображаемых меток.
* `Enable Time Filter` — включение минимального интервала между усиленными сигналами.
* `Min Bars Between Signals` — сколько баров должно пройти между двумя Buy X или двумя CloseV.
**Совет:**
Если усиленных сигналов слишком много — увеличьте `Min Bars Between Signals`.
Если хотите больше активности — уменьшите это значение.
### 3.5. Alerts
* `Buy Alerts / Buy X Alerts / Close Alerts / CloseV Alerts` — выбор типов сигналов для алертов.
* `One Alert Per Bar` — при включении алерты отправляются один раз на бар (рекомендуется для H1–H4).
Алерты формируются через `alert()` с сообщением, включающим тип сигнала, тикер, таймфрейм и текущую цену.
---
## 4. Как использовать White Crow в торговле
### 4.1. Рекомендуемые таймфреймы
* 📌 **Основной фокус: 1–4 часа.**
На этих ТФ:
* структура по пивотам и тренд более стабильны;
* CCI/RSI отражают существенные ценовые колебания;
* кластеры **Buy X / CloseV** лучше отсеивают шум.
На M1–M15 индикатор тоже можно применять, но нужно быть готовым к большему количеству сигналов и чувствительности к микродвижениям.
### 4.2. Пошаговое чтение сигналов
1. **Начните с контекста**
* Посмотрите на **Market Trend / Last Bottom / Last Top** в панели.
* Определите, где находитесь относительно этих уровней: у сопротивления, у поддержки, внутри диапазона и т.п.
2. **Найдите зоны интереса**
* Используйте пивоты и order blocks как потенциальные области спроса/предложения.
* Ждите подхода цены к этим зонам.
3. **Отслеживайте сигналы**
* **Buy** — ранний признак локальной перепроданности.
* **Buy X** — усиленный кластерный сигнал, более значимый, чем одиночный Buy.
* **Close** — ранний сигнал возможного ослабления текущего движения.
* **CloseV** — усиленный кластерный сигнал выхода/разворота.
4. **Практическое применение**
* В *бычьем* тренде:
* фокус на **Buy / Buy X** возле впадин и зон спроса;
* **Close / CloseV** использовать для частичной фиксации и подтягивания стопа.
* В *медвежьем* тренде:
* фокус на **Close / CloseV** возле вершин и зон предложения;
* **Buy / Buy X** — для аккуратных контртрендовых входов с жестким риском.
---
## 5. Важные замечания и дисклеймер
1. **Buy X / CloseV сильнее, но не «волшебные» сигналы.**
Они статистически более значимы, чем одиночные Buy/Close, потому что:
* требуют нескольких подтверждений в кластере;
* фильтруются по времени.
Однако **ложные срабатывания всё равно возможны**, особенно на новостях и в условиях низкой ликвидности.
2. **Оптимальная область применения — старшие ТФ (1–4 часа).**
Здесь Buy X и CloseV обычно отражают реальное изменение баланса спроса/предложения, а не шум.
3. **Это инструмент подтверждения, а не полноценная система.**
Pro Trading White Crow:
* не управляет рисками;
* не считает размер позиции и уровень стоп-лосса;
* не заменяет ваше собственное видение рынка.
Всегда используйте его сигналы **как один из факторов согласованности** вместе со структурой, трендом, price action, объёмом и персональным торговым планом.
4. **Образовательный характер.**
Скрипт и описание предназначены для обучения и анализа графиков.
Они **не являются инвестиционной рекомендацией и не гарантируют прибыль**.
Вы самостоятельно принимаете все торговые решения и несёте полную ответственность за риск.
---

SMC Fib Range Signals [@gyanapravah]SMC Fib Range Signals
This indicator blends Smart Money Concepts (SMC) with a Range Filter Trend System and Fibonacci Retracement & Extensions to generate high-probability automated Buy/Sell signals.
Designed to avoid noise and focus on market structure + trend + price confluence, this tool is ideal for:
1. Intraday traders
2. Swing traders
3. Index & stock traders
4. Crypto & Forex traders
CORE FEATURES
Range Filter Trend Detection
Smooth adaptive filter identifies true trend direction
Visual confirmation:
🟢 Green filter = bullish pressure
🔴 Red filter = bearish pressure
🟡 Yellow filter = neutral
Upper & Lower Bands act as dynamic support/resistance zones
Smart Money Order Blocks (SMC)
Automatically detects important pivot highs & lows
Marks:
OB High → supply / resistance zone
OB Low → demand / support zone
Continuously tracks latest OB levels for live price interaction
Fibonacci Engine
Detects the current swing zone and plots:
Retracement levels
0.236 – 0.382 – 0.500 – 0.618 – 0.786 (editable)
Extension targets
1.272 – 1.618
All levels update dynamically on new market structure and pivots.
SIGNAL ENGINE
This indicator generates signals from three independent confirmation systems:
BUY SIGNALS trigger when:
1. Trend flips bullish (price crosses above the Filter)
2.Bullish trend + price reacts near:
Order Block support
Fibonacci 0.382 / 0.618 levels
Bounce from the Lower Band with trend support
All setups require volume confirmation to filter fake breakouts.
SELL SIGNALS trigger when:
1. Trend flips bearish (price crosses below the Filter)
2. Bearish trend + price reacts near:
Order Block resistance
Fibonacci 0.382 / 0.618 levels
Rejection from the Upper Band with trend support
ALERTS READY
Two built-in alerts:
BUY Alert — fires on bullish signal
SELL Alert — fires on bearish signal
INPUT SETTINGS
Trend Engine
1.Source
2.Sampling Period
3.Range Multiplier
Smart Money
Pivot detection sensitivity (Left / Right bars)
Fibonacci
1.Swing lookback length
2.Editable Fib retracement and extension values
3.Toggle show/hide Fib levels
BEST USE CASE
Works extremely well on:
⏱️ 3M – 15M Intraday scalping
⏱️ 30M – 1H positional entries
⏱️ 4H – D1 swing trading
Tested on:
NIFTY / BANKNIFTY / FINNIFTY
Stocks
Crypto
Forex
DISCLAIMER
This indicator is for educational purposes only.
It does NOT guarantee profits.
Always use:
Proper risk management
Stop-loss rules
Your own confirmation before entering trades.
AUTHOR
Built & shared by @gyanapravah (Odisha, India)
Open-source for learning and community improvement.

MTF Trend Dashboard (PSAR, SuperTrend, 200EMA, 9/30 EMA)This script is a multi–timeframe trend dashboard designed to quickly show the market bias across several timeframes in one place.
It does not generate buy/sell signals – it is a visual decision tool to support your own strategy.
What it shows
For up to 5 selectable timeframes, the table displays:
Parabolic SAR – whether PSAR is below (bullish) or above (bearish) the candle.
Supertrend – whether the Supertrend line is below or above the price.
200 EMA status – whether price is trading above (bullish trend) or below (bearish trend) the 200 EMA.
9 / 30 EMA crossover – whether 9 EMA is above (bullish) or below (bearish) the 30 EMA.
Green cells represent bullish conditions, red cells represent bearish conditions.
How to use
Quickly check higher–timeframe trend alignment before entering trades.
Use it as a trend filter for scalping or intraday entries on lower timeframes.
Combine with your own price action / SMC / support–resistance rules for actual entries and exits.

QFT MTF Range DetectorQFT MTF Range Detector — QuantumFlowTrader
Description:
The QFT MTF Range Detector is a multi-timeframe (MTF) tool designed to identify consolidation zones or ranging conditions across multiple intraday timeframes — from 1 minute up to 4 hours. This indicator is optimized for high-frequency trading environments such as scalping and day trading.
How it works:
For each selected timeframe, the indicator evaluates five key technical conditions:
- Low ADX (less than 17) – suggesting weak trend strength.
- Range width within a specific normalized threshold.
- Normalized ATR (volatility filter) in a defined range.
- RSI near the neutral zone (40–60) with low volatility.
- Price proximity to the mid-range (consolidation center).
Each condition contributes a score. If at least 3 out of 5 conditions are met, that timeframe is considered to be in a range (consolidation).
Visual output:
A compact table is displayed on the chart showing all selected timeframes:
Black box = Timeframe is in a range (consolidation).
Purple box = Not in a range (likely trending or volatile).
Timeframes are labeled (e.g., "4H", "15M") for clarity.
Customization:
Choose display corner (top/bottom, left/right).
Enable or disable table borders.
Set custom colors for range and non-range signals.
Use case:
Traders can quickly assess which timeframes are in a range, helping them:
Avoid choppy markets,
Time entries and exits better,
Confirm multi-timeframe alignment.
Note: This is not a buy/sell signal indicator. It is a market condition filter to enhance decision-making.

Smart Money Concepts by Rakesh Sharma🎯 SMART MONEY CONCEPTS - TRADE WITH INSTITUTIONS
Reveal where banks, hedge funds, and institutional traders enter the market. Trade alongside smart money, not against them!
✨ FEATURES:
- Order Blocks (OB) - Institutional buying/selling zones
- Fair Value Gaps (FVG) - Market inefficiencies to exploit
- Break of Structure (BOS) - Trend continuation signals
- Change of Character (ChoCh) - Early reversal detection
- Liquidity Sweeps - Stop hunt identification
- Premium/Discount Zones - Buy cheap, sell expensive
- Live Dashboard - Real-time market structure
🎯 HOW TO USE:
✓ BUY in Discount Zone at Bullish Order Blocks
✓ SELL in Premium Zone at Bearish Order Blocks
✓ Wait for ChoCh or BOS confirmation
✓ Follow institutional footprints for high-probability setups
📊 PERFECT FOR:
All markets - Nifty, Bank Nifty, Stocks, Forex, Crypto
All timeframes - 5m (scalping), 15m (intraday), Daily (swing)
⚡ TRADING EDGE:
Stop trading like retail. Start trading like institutions. See where smart money accumulates and distributes. Catch reversals early with ChoCh signals.
Created by: Rakesh Sharma | Version 1.0

Force Pulse█ OVERVIEW
Force Pulse is a fast-reacting oscillator that measures the internal strength of market sides by analyzing the aggregated dominance of bulls and bears based on candle size.
The indicator normalizes this difference into a 0–100 range, generates signals (OB/OS, midline cross, MA midline cross), and detects divergences between price and the oscillator.
It also offers advanced visualization, signal markers, and alerts, making it a versatile tool suitable for many trading styles.
█ CONCEPTS
Force Pulse was designed as a universal tool that can be applied to various trading strategies depending on its settings:
- increasing the period lengths and smoothing transforms it into a momentum/trend indicator, revealing a stable dominance of one market side.
- Lowering these parameters turns it into a peak/low detector, ideal for contrarian and mean-reversion strategies.
The oscillator analyzes the relationship between the sum of bullish and bearish candles over a selected period, based on:
- candle body size, or
- average candle body size (AVG Body).
Depending on the selected mode, OB/OS levels should be adjusted, as value dynamics differ between modes.
The output is normalized to 0–100, where:
> 50 – bullish dominance,
< 50 – bearish dominance.
The additional MA line is derived from smoothed oscillator values and serves as a signal line for midline crosses and as a trend filter.
The indicator also detects divergences (HL/LL) between price and the oscillator.
█ FEATURES
Bull & Bear Strength:
- Calculations are based on Body or AVG Body – mode selection requires adjusting OB/OS levels.
- Bullish and bearish candle values are summed separately.
- All results are normalized to the 0–100 scale.
Force Pulse Oscillator:
- The main line reflects the current dominance of either market side.
Dynamic colors:
- Green – above 50,
- Red – below 50.
Signal MA:
- SMA based on oscillator values functions as a signal line.
- Helps detect momentum shifts and generates signals via midline crosses.
- Can serve as a trend confirmation filter.
Overbought / Oversold:
- Configurable OB/OS levels, also for the MA line.
- Dynamic OB/OS line colors: when the MA line exceeds the defined threshold (e.g., MA > maOverbought or MA < maOversold), OB/OS lines change color (red/green).
- This often signals a potential reversal or correction and may act as additional confirmation for oscillator-generated signals.
Divergences:
- Detection based on swing pivots:
- Bullish: price LL, oscillator HL
- Bearish: price HH, oscillator LH
- Displayed as “Bull” / “Bear” labels.
Signals:
Supports multiple signal types:
- Overbought/Oversold Cross
- Midline Cross
- MA Midline Cross (based on the signal MA line)
- Signals appear as triangles above/below the oscillator.
Visualization:
- Gradient options for lines and levels.
- Full customization of colors, transparency, and line thickness.
Alerts available for:
- Divergences
- OB/OS crossings
- Midline crossings
- MA midline crossings
█ HOW TO USE
Add the indicator to your TradingView chart → Indicators → search “Force Pulse”
Parameter Configuration
Calculation Settings:
- Calculation Period (lookback) – defines the strength calculation window.
Force Mode (Body / AVG Body):
- Body – faster response, higher sensitivity.
- AVG Body – more stable output; adjust band levels and periods to your strategy.
- EMA Smoothing (smoothLen) – reduces oscillator noise.
- MA Length – length of the signal line (SMA).
Threshold Levels:
- Set Overbought/Oversold levels for both the oscillator and the MA line.
- Adjust levels depending on Body / AVG Body mode.
Divergence Detection:
- Enable/disable divergence detection.
- PivotLength affects both delay and signal quality.
- Signal Settings: Choose one or multiple signal types.
- Style & Colors: Full control over color schemes, gradients, and transparency.
Signal Interpretation
BUY:
- Oscillator leaves oversold (OS crossover).
- Midline cross upward.
- MA crosses the midline from below.
- Bullish divergence.
SELL:
- Oscillator leaves overbought (drops below OB).
- Midline cross downward.
- MA crosses the midline from above.
- Bearish divergence.
Trend / Momentum:
-Longer periods and stronger smoothing → stable directional signals.
-MA as a trend filter: e.g., signal line above the midline (50) and MA pointing upward indicates continuation of a bullish impulse.
Contrarian / Mean Reversion:
- Short periods → rapid detection of peaks and troughs; ideal for contrarian signals and pullback entries.
█ APPLICATIONS
- Trend Trading: Using midline and MA midline crosses to determine direction.
- Reversal Trading: OB/OS levels and divergences help identify reversals.
- Scalping & Intraday: Short settings + signal line above the midline with bullish MA → shows short-term impulse and continuation.
- Swing Trading: Longer MA and higher lookback provide a stable view of market-side dominance.
- Momentum Analysis: Force Pulse highlights the strength of the wave before price movement occurs.
█ NOTES
- In strong trends, the oscillator may stay in extreme zones for a long time — this reflects dominance, not necessarily a reversal signal.
- Divergences are more reliable on higher timeframes.
- OB/OS levels should be tailored to Body/AVG Body mode and the instrument.
- Best results come from combining the indicator with other tools (S/R, market structure, volume).

SuperTrend Oscillator MTF█ OVERVIEW
SuperTrend Oscillator MTF is a multi-timeframe version of the classic SuperTrend converted into an oscillator. Instead of drawing the SuperTrend line on the price chart, it displays the distance of the close from the SuperTrend line simultaneously for the current timeframe and two additional timeframes. This allows you to instantly see the trend direction and strength across three selected timeframes in a single window.
█ CONCEPT
The classic SuperTrend value is subtracted from price and normalized so that trend direction can be directly compared across different timeframes without switching charts.
- Value above zero = price below SuperTrend line → bearish trend
- Value below zero = price above SuperTrend line → bullish trend
- The further away from zero, the stronger the trend.
█ FEATURES
- Three SuperTrend Oscillator lines: current TF, TF1 and TF2
- Automatic detection of 3-timeframe agreement
- BUY and SELL labels that appear only when all three timeframes turn in the same direction at the same moment
- Circle signals on every zero-line cross of the current timeframe
- Configurable soft gradient fill (can be disabled)
- Zero line changes color (green/red/gray) depending on 3-TF agreement
- Fully customizable colors for each timeframe
- Built-in alerts for all signal types
█ HOW TO USE
Add the indicator to the chart → set two additional timeframes and adjust ATR Period and Factor to suit your trading style.
Main settings:
- ATR Period → default 10
- Factor → default 3.0 (higher = fewer signals)
- TF 1 and TF 2 → any timeframes (e.g. 1H+4H, 4H+D, D+W, etc.)
- Enable gradient → turn fill on/off
- Show BUY/SELL labels (3 TF agreement) → enable/disable the strongest signals
Interpretation:
Two types of signals:
- Green/red circles → current timeframe changes trend direction (faster signal)
- BUY/SELL labels → all three timeframes simultaneously switch to the same direction (strongest confluence)
- Additionally, the zero line turns green or red when all three trends are aligned.
█ APPLICATIONS
Perfect for:
- Trend-following with multi-timeframe confirmation
- Filtering false breakouts on lower timeframes
- Scalping & day trading (use fast circle signals)
- Swing & position trading (wait for full 3-TF agreement)
Best combined with:
- Support/resistance levels and supply/demand zones – enter long after a confirmed breakout and retest of a key level (e.g. Change of Character, Break of Structure, Order Block, 0.618–0.786 Fibonacci) only when the oscillator shows 3-TF agreement or at least a bullish circle. Hold the trade to the next significant resistance/supply zone.
- Volume and Volume Profile – confirm move strength with rising volume and high-volume nodes at the breakout level. Declining volume while moving away from zero may signal trend exhaustion.
- Classic oscillators (RSI, Stochastic, MACD) – use primarily for spotting divergences and overbought/oversold conditions. One of the safest exits is when a regular or hidden divergence appears on RSI/Stochastic in an extreme zone, even if SuperTrend Oscillator MTF still shows alignment.
█ NOTES
- Works on all markets and all timeframes
- BUY/SELL labels (3-TF agreement) are the cleanest and strongest signals
- Circle signals are faster but more prone to noise
- Higher ATR Period = fewer signals, higher quality

Hash Pivot DetectorHash Pivot Detector
Professional Support & Resistance Detection with Multi-Timeframe Zone Analysis
Developed by Hash Capital Research, the Hash Pivot Detector is a sophisticated indicator designed for identifying key support and resistance levels using pivot-based detection with institutional-grade zone analysis.
Key Features
Zone-Based Detection
Unlike traditional single-line S/R indicators, Hash Pivot Detector uses configurable zones around pivot levels to represent realistic institutional order areas. Adjustable zone width accommodates different asset volatilities.
Multi-Timeframe Analysis
Displays higher timeframe support/resistance levels alongside current timeframe pivots, providing crucial context for institutional positioning and stronger price barriers.
Clean Visual Design
Features Hash Capital's signature fluorescent color scheme (pink resistance, cyan support) optimized for dark charts with high contrast and instant visual recognition. Semi-transparent zones keep your chart clean and readable.
How It Works
The indicator uses pivot high/low detection with configurable left and right bar parameters. When a pivot is confirmed, it plots:
Primary support/resistance lines at pivot levels
Semi-transparent zones representing realistic order areas
Higher timeframe S/R levels as crosses for additional context
Recommended Settings
For Swing Trading:
Pivot Bars: 10-20 left/right
Zone Width: 0.5-1.0%
HTF: Daily (on 1H-4H charts)
For Intraday Trading:
Pivot Bars: 5-10 left/right
Zone Width: 0.3-0.5%
HTF: 1H or 4H (on 5min-15min charts)
Asset-Specific Zone Width:
Forex/Crypto: 0.3-0.5%
Stocks: 0.5-1.0%
Volatile Assets: 1.0-2.0%
What Makes It Different
✓ Zone-based approach (more realistic than lines)
✓ Multi-timeframe confluence detection
✓ Minimal visual clutter with maximum information
✓ Professional institutional aesthetic
✓ Comprehensive tooltips for easy optimization
✓ No repainting - all pivots are confirmed
Best Used For
Identifying high-probability entry/exit zones
Setting stop-loss and take-profit levels
Recognizing breakout/breakdown areas
Multi-timeframe confluence analysis
Swing trading and position trading
Intraday scalping with adjusted parameters
Notes
Works on all timeframes and markets
Fully customizable colors and parameters
All settings include detailed optimization guidance
Clean code, efficient performance
No alerts or notifications (visual analysis only)

Linear Trajectory & Volume StructureThe Linear Trajectory & Volume Structure indicator is a comprehensive trend-following system designed to identify market direction, volatility-adjusted channels, and high-probability entry points. Unlike standard Moving Averages, this tool utilizes Linear Regression logic to calculate the "best fit" trajectory of price, encased within volatility bands (ATR) to filter out market noise.
It integrates three core analytical components into a single interface:
Trend Engine: A Linear Regression Curve to determine the mean trajectory.
Volume Verification: Filters signals to ensure price movement is backed by market participation.
Market Structure: Identifies previous high-volume supply and demand zones for support and resistance analysis.
2. Core Components and Logic
The Trajectory Engine
The backbone of the system is a Linear Regression calculation. This statistical method fits a straight line through recent price data points to determine the current slope and direction.
The Baseline: Represents the "fair value" or mean trajectory of the asset.
The Cloud: Calculated using Average True Range (ATR). It expands during high volatility and contracts during consolidation.
Trend Definition:
Bullish: Price breaks above the Upper Deviation Band.
Bearish: Price breaks below the Lower Deviation Band.
Neutral/Chop: Price remains inside the cloud.
Smart Volume Filter
The indicator includes a toggleable volume filter. When enabled, the script calculates a Simple Moving Average (SMA) of the volume.
High Volume: Current volume is greater than the Volume SMA.
Signal Validation: Reversal signals and structure zones are only generated if High Volume is present, reducing the likelihood of trading false breakouts on low liquidity.
Volume Structure (Smart Liquidity)
The script automatically plots Support (Demand) and Resistance (Supply) boxes based on pivot points.
Creation: A box is drawn only if a pivot high or low is formed with High Volume (if the volume filter is active).
Mitigation: The boxes extend to the right. If price breaks through a zone, the box turns gray to indicate the level has been breached.
3. Signal Guide
Trend Reversals (Buy/Sell Labels)
These are the primary signals indicating a potential change in the macro trend.
BUY Signal: Appears when price closes above the upper volatility band after previously being in a downtrend.
SELL Signal: Appears when price closes below the lower volatility band after previously being in an uptrend.
Pullbacks (Small Circles)
These are continuation signals, useful for adding to positions or entering an existing trend.
Long Pullback: The trend is Bullish, but price dips momentarily below the baseline (into the "discount" area) and closes back above it.
Short Pullback: The trend is Bearish, but price rallies momentarily above the baseline (into the "premium" area) and closes back below it.
4. Configuration and Settings
Trend Engine Settings
Trajectory Length: The lookback period for the Linear Regression. This is the most critical setting for tuning sensitivity.
Channel Multiplier: Controls the width of the cloud.
1.0: Aggressive. Results in narrower bands and earlier signals, but more false positives.
1.5: Balanced (Default).
2.0+: Conservative. Creates a wide channel, filtering out significant noise but delaying entry signals.
Signal Logic
Show Trend Reversals: Toggles the main Buy/Sell labels.
Show Pullbacks: Toggles the re-entry circle signals.
Smart Volume Filter: If checked, signals require above-average volume. Unchecking this yields more signals but removes the volume confirmation requirement.
Volume Structure
Show Smart Liquidity: Toggles the Support/Resistance boxes.
Structure Lookback: Defines how many bars constitute a pivot. Higher numbers identify only major market structures.
Max Active Zones: Limits the number of boxes on the chart to prevent clutter.
5. Timeframe Optimization Guide
To maximize the effectiveness of the Linear Trajectory, you must adjust the Trajectory Length input based on your trading style and timeframe.
Scalping (1-Minute to 5-Minute Charts)
Recommended Length: 20 to 30
Multiplier: 1.2 to 1.5
Logic: Fast-moving markets require a shorter lookback to react quickly to micro-trend changes.
Day Trading (15-Minute to 1-Hour Charts)
Recommended Length: 55 (Default)
Multiplier: 1.5
Logic: A balance between responsiveness and noise filtering. The default setting of 55 is standard for identifying intraday sessions.
Swing Trading (4-Hour to Daily Charts)
Recommended Length: 89 to 100
Multiplier: 1.8 to 2.0
Logic: Swing trading requires filtering out intraday noise. A longer length ensures you stay in the trade during minor retracements.
6. Dashboard (HUD) Interpretation
The Head-Up Display (HUD) provides a summary of the current market state without needing to analyze the chart visually.
Bias: Displays the current trend direction (BULLISH or BEARISH).
Momentum:
ACCELERATING: Price is moving away from the baseline (strong trend).
WEAKENING: Price is compressing toward the baseline (potential consolidation or reversal).
Volume: Indicates if the current candle's volume is HIGH or LOW relative to the average.
Disclaimer
*Trading cryptocurrencies, stocks, forex, and other financial instruments involves a high level of risk and may not be suitable for all investors. This indicator is a technical analysis tool provided for educational and informational purposes only. It does not constitute financial advice, investment recommendations, or a guarantee of profit. Past performance of any trading system or methodology is not necessarily indicative of future results.

Matt's Multi-Timeframe MACD Direction AlertThe indicator monitors the direction of the Moving Average Convergence Divergence (MACD) lines on four specific timeframes: 1-hour, 15-minute, 5-minute, and 1-minute.
It only generates a signal when the MACD in all four timeframes is trending in the same direction (either all are bullish, or all are bearish). This alignment suggests a strong, synchronized market momentum from short-term scalping views up to immediate-term swing views.
Key Features:
Multi-Timeframe Confirmation: Uses TradingView's request.security() function to fetch data from different timeframes (1h, 15m, 5m, 1m), preventing the need to manually switch charts.
Visual Dashboard: A dashboard table is displayed on your chart, providing an immediate visual status (Bullish/Bearish/Neutral) for each of the four timeframes.
On-Chart Signals: The indicator plots visual shapes (green triangles for bullish alignment, red triangles for bearish alignment) directly on the sub-chart when the condition is met.
Custom Alert Integration: It includes a built-in alertcondition() function, allowing traders to set up real-time, hands-free notifications whenever a synchronized trading opportunity arises.
This tool helps filter out noise and potential false signals that might appear on a single timeframe, focusing instead on robust signals confirmed by a consensus of time perspectives.

IDWM Master StructureExecutive Summary
The IDWM Master Structure is a Multi-Timeframe (MTF) trading tool designed to force discipline by aligning traders with the "Parent" trend. It functions by locking onto the "Completed Auction" of a higher timeframe candle (like a Daily or Weekly bar) and projecting that structure onto your lower timeframe chart. Its primary goal is to define the "Dealing Range"—the hard boundaries where value was previously established—so you don't get lost in the noise of smaller price movements.
1. The Principle of Completed Auctions (Hierarchy)
Most technical indicators curve dynamically with every price tick. This script acts differently because it relies on "Settled Arguments." A closed Daily candle represents a finished battle between buyers and sellers; the High and Low are the historical results of that battle.
To enforce this, the script automatically selects a "Parent" timeframe based on your view:
Scalping (charts below 15 minutes) uses the 4-Hour Auction.
Intraday trading (15 minutes to 4 Hours) uses the Daily Auction.
Swing trading (Daily chart) uses the Weekly Auction.
2. Liquidity Pools & The Sticky Range
The High and Low lines drawn by the indicator are not just support and resistance; they represent Liquidity Pools. In market theory, stop-losses (Sell Stops below Lows, Buy Stops above Highs) accumulate at these edges.
Smart money often pushes price just past these lines to grab this liquidity (a "Stop Hunt") before reversing direction. To account for this, the script uses a "Sticky Range" mechanism. It refuses to redraw the box simply because price touched the line. Instead, it uses an Average True Range (ATR) Buffer. A new structure is only formed if the candle closes decisively outside the range plus this volatility buffer. This ensures you are trading real breakouts, not liquidity sweeps.
3. Internal Range Mechanics (Premium vs. Discount)
Inside the Master Box, the script applies Equilibrium Theory to help with trade location.
The most important internal line is the Equilibrium (EQ), which marks the exact 50% point of the range.
Premium Zone (Above EQ): Price is mathematically "expensive" relative to the recent range. Algorithms generally look to establish Short positions here.
Discount Zone (Below EQ): Price is considered "cheap." Algorithms generally look to establish Long positions here.
It also plots the Master Open, which acts as a "Line in the Sand." If price is currently trading above the Master Open, the higher timeframe candle is Green (Bullish), suggesting longs have a higher probability. If below, the candle is Red (Bearish).
4. Wick Theory (Failed Auctions)
The script places special emphasis on the wicks of the Master Candle because a wick represents a "Failed Auction"—a price level the market tried to explore but ultimately rejected.
The indicator highlights the background of the wick area (from the High to the Body). On a retest, these zones often act as supply or demand blocks because the market remembers the previous failure.
It also calculates the "Consequent Encroachment," which is the 50% midpoint of the wick. The rule of thumb here is that if a candle body can close past 50% of a wick, the rejection is nullified, and price will likely travel to fill the entire wick.
5. Energy Expansion (Breakout Targets)
Market energy transfers from Consolidation (inside the box) to Expansion (the breakout). When the price finally breaks the "Sticky Range" (confirming via the ATR buffer), the script projects where that energy will go.
It uses the height of the previous range to calculate Fibonacci extensions. Specifically, it targets the 1.618 Extension, often called the "Golden Ratio." This is a statistically significant level where expansion moves tend to exhaust themselves and reverse.
6. Safety Protocol: Live Detection
A dashboard monitors the state of the parent candle. If the text turns Magenta with a warning symbol, it means the Higher Timeframe candle is "Live" (still forming).
Trading off a live structure is considered higher risk because the "Auction" isn't finished—the High or Low can still shift. The safest approach is to trade when the dashboard indicates a standard, locked, historical structure.

Wick Size Percentage (%) IndicatorA lightweight utility script that measures the wick size of every bar in percentages. It helps identify significant rejection blocks and volatility spikes by displaying the exact % value above and below each candle. Perfect for ICT concepts and precise risk management.
This indicator is designed for price action traders who need precise measurements of market volatility and rejection. It automatically calculates and displays the size of both the upper and lower wicks of a candle as a percentage relative to the open price.
Key Features:
Dual Measurement: Separately calculates the upper wick (high to body) and lower wick (body to low).
Percentage Based: Values are shown in percentages (%) rather than price points, making it easier to compare volatility across different assets (Crypto, Forex, Stocks).
Dynamic Labels: Visual labels appear above and below the candles for quick reading.
Fully Customizable: Users can adjust the decimal precision (e.g., for low timeframe scalping), change text size, and toggle visibility to keep the chart clean.
Data Window Support: Values are also visible in the side Data Window for detailed analysis without clutter.

Advanced ICC Multi-Timeframe 1.0Advanced ICC Multi-Timeframe Trading System
A comprehensive implementation and interpretation of the Indication, Correction, Continuation (ICC) trading methodology made popular by Trades by Sci, enhanced with advanced multi-timeframe analysis and automation features.
⚠️ CRITICAL TRADING WARNINGS:
DO NOT blindly follow BUY/SELL signals from this indicator
This indicator shows potential entry points but YOU must validate each trade
PAPER TRADE EXTENSIVELY before risking real capital
BACKTEST THOROUGHLY on your chosen instruments and timeframes
The ICC methodology requires understanding and discretion - automated signals are guidance only
This tool aids analysis but does not replace proper trade planning, risk management, or trader judgment
⚠️ Important Disclaimers:
This indicator is not endorsed by or affiliated with Trades by Sci
This is an early implementation and interpretation of the ICC methodology
May not work exactly as Trades by Sci executes his trades and entries
Requires further debugging, backtesting, and real-world validation
Completely free to use - no purchase required
I'm just one person obsessed with this method and wanted some better visualization of the chart/entries
About ICC:
The ICC method identifies complete market cycles through three phases: Indication (breakout), Correction (pullback), and Continuation (entry). This indicator automates the identification of these phases and adds powerful features for modern traders.
Key Features:
Multi-Timeframe Capabilities:
Automatic timeframe detection with optimized settings for 5m, 15m, 30m, 1H, 4H, and Daily charts
Higher timeframe overlay to view HTF ICC levels on lower timeframe charts for precise entry timing
Smart defaults that adjust swing length and consolidation detection based on your timeframe
Advanced Phase Tracking:
Complete ICC cycle tracking: Indication, Correction, Consolidation, Continuation, and No Setup phases
Live structure detection shows potential peaks/troughs before full confirmation
Intelligent invalidation logic detects failed setups when market structure reverses
Dynamic phase backgrounds for instant visual confirmation
Three Types of Entry Signals:
Traditional Entries - Price crosses back through the original indication level (strongest signals)
"BUY" (green) / "SELL" (red)
Breakout Entries - Price breaks out of consolidation range in the same direction
"BUY" (green) / "SELL" (red)
Reversal Entries (Optional, can be toggled off) - Price breaks consolidation in opposite direction, indicating failed setup
"⚠ BUY" (yellow) / "⚠ SELL" (orange)
More aggressive, counter-trend signals
Can be disabled for more conservative trading
Professional Features:
Volatility-based support/resistance zones (ATR-adjusted) that adapt to market conditions
Historical zone tracking (0-3 configurable) with visual hierarchy
Comprehensive real-time info table displaying all key metrics
Full alert system for entries, indications, and consolidation detection
Visual distinction between high-confidence trend entries and cautionary reversal entries
📖 USAGE GUIDE
Entry Signal Types:
The indicator provides three types of entry signals with visual distinction:
Strong Entries (High Confidence):
"BUY" (bright green) / "SELL" (bright red)
Includes traditional entries (crossing back through indication level) and breakout entries (breaking consolidation in trend direction)
These are trend continuation or breakout signals with higher probability
Recommended for all traders
Reversal Entries (Caution - Counter-Trend):
"⚠ BUY" (yellow) / "⚠ SELL" (orange)
Triggered when price breaks out of correction/consolidation in the OPPOSITE direction
Indicates a failed setup and potential trend reversal
More aggressive, counter-trend plays
Can be toggled off in settings for more conservative trading
Recommended only for experienced traders or after thorough backtesting
Swing Length Settings:
The swing length determines how many bars on each side are needed to confirm a swing high/low. This is the most important setting for tuning the indicator to your style.
Auto Mode (Recommended for beginners): Toggle "Use Auto Timeframe Settings" ON
5-minute: 30 bars
15-minute: 20 bars
30-minute: 12 bars
1-hour: 7 bars
4-hour: 5 bars
Daily: 3 bars
Manual Mode: Toggle "Use Auto Timeframe Settings" OFF
Lower values (3-7): More aggressive, detects smaller swings
Pros: More signals, faster entries, catches smaller moves
Cons: More noise, more false signals, requires tighter stops
Best for: Scalping, active day trading, volatile markets
Higher values (12-20): More conservative, only major swings
Pros: More reliable signals, fewer false breakouts, clearer structure
Cons: Fewer signals, delayed entries, might miss smaller opportunities
Best for: Swing trading, position trading, trending markets
Default Manual Setting: 7 bars (balanced for 1H charts)
Minimum: 3 bars
Consolidation Bars Setting:
Determines how many bars without new structure are needed before flagging consolidation.
Lower values (3-10): Faster detection, catches brief pauses, more sensitive
Best for: Lower timeframes, volatile markets, avoiding any chop
Higher values (20-40): More reliable, only flags true extended consolidation
Best for: Higher timeframes, trending markets, patient traders
Current defaults scale with timeframe (more bars needed on shorter timeframes)
Historical S/R Zones:
Shows previous support and resistance levels to provide context.
Default: 2 historical zones (shows current + 2 previous)
Range: 0-3 zones
Visual Hierarchy: Older zones are more transparent with dashed borders
Usage: Higher numbers (2-3) show more historical context but can clutter the chart. Start with 2 and adjust based on your preference.
Live Structure Feature (Yellow Warning ⚠):
Provides early warning of potential structure changes before full confirmation.
What it does: Detects potential swing highs/lows after just 2 bars instead of waiting for full swing_length confirmation
Live Peak: Shows when a high is followed by 2 lower closes (potential top forming)
Live Trough: Shows when a low is followed by 2 higher closes (potential bottom forming)
Important: These are UNCONFIRMED - they may be invalidated if price reverses
Use case: Get early awareness of potential reversals while waiting for confirmation
Displayed in: Info table only (no visual markers on chart to reduce clutter)
Only shows: Peaks higher than last swing high, or troughs lower than last swing low (filters out noise)
Higher Timeframe (HTF) Analysis:
View higher timeframe ICC structure while trading on lower timeframes.
How to enable: Toggle "Show Higher Timeframe ICC" ON
Setup: Set "Higher Timeframe" to your reference timeframe
Example: Trading on 15-minute? Set HTF to 240 (4-hour) or 60 (1-hour)
Example: Trading on 5-minute? Set HTF to 60 (1-hour) or 15 (15-minute)
What it shows:
HTF indication levels displayed as dashed lines
Blue = HTF Bullish Indication
Purple = HTF Bearish Indication
HTF phase and levels shown in info table
Trading workflow:
Check HTF phase for overall market direction
Wait for HTF correction phase
Drop to lower timeframe to find precise entries
Enter when lower TF shows continuation in alignment with HTF
Best practice: HTF should be 3-4x your trading timeframe for best results
Reversal Entries Toggle:
Default: ON (shows all signal types)
Toggle OFF for more conservative trading (only trend continuation signals)
Recommended: Backtest with both settings to see which works better for your style
New traders should consider disabling reversal entries initially
Volatility-Based Zones:
When enabled, support/resistance zones automatically adjust their height based on ATR (Average True Range).
More volatile = wider zones
Less volatile = tighter zones
Toggle OFF for fixed-width zones
Community Feedback Welcome:
This is an evolving project and your input is valuable! Please share:
Bug reports and issues you encounter
Feature requests and suggestions for improvement
Results from your backtesting and live trading experience
Feedback on the reversal entry feature (too aggressive? working well?)
Ideas for better aligning with the ICC methodology
Perfect for traders learning or implementing the ICC methodology with the benefit of modern automation, multi-timeframe analysis, and flexible entry signal options.

Market Regime & Bias Assistant [Prototype v1.1]
Market Regime & Bias Assistant
### **Overview**
The **Market Regime & Bias Assistant** is an all-in-one trend filtration and trading system designed to keep traders on the right side of the market. Instead of relying on a single moving average, this indicator combines **ADX (Trend Strength)**, **Multi-Timeframe EMAs**, **RSI**, and **Volume Spread Analysis (VSA)** concepts to generate a quantitative "Confidence Score" for the current market bias.
It automatically adapts its settings based on your timeframe (Intraday vs. Swing) and provides clear visual cues via background shading, candle coloring, and a data panel.
---
### **Key Features**
* **Auto-Adaptive Modes:** Automatically switches between "Intraday" and "Swing" settings based on your timeframe.
* *Intraday:* Uses faster EMAs (Aggressive 9/30 or Conservative 20/50) and VWAP.
* *Swing:* Uses standard 20/50 EMAs with 200/800 long-term context moving averages.
* **Market Regime Detection:** Identifies if the market is in a **Trend (Bull/Bear)** or a **Range (Neutral)** using a combination of ADX thresholds and EMA alignment.
* **Confidence Scoring (0-100):** A proprietary algorithm that scores the quality of the trend based on RSI alignment, Volume confirmation, and Long-term EMA context.
* **Vector Volume Candles:** Color-coded candles to highlight institutional activity (High Volume) vs. Climactic Volume (Exhaustion).
* **Pullback Signals:** "L" and "S" markers indicating high-probability entries after a pullback into the EMA value zone.
* **Data Dashboard:** A bottom-right panel displaying the current Mode, Regime, Bias, and quantitative Confidence Score.
---
### **How to Read the Visuals**
#### **1. Background Colors (The Regime)**
* **Green Background:** Confirmed **Bullish Trend**. Only look for Longs.
* **Red Background:** Confirmed **Bearish Trend**. Only look for Shorts.
* **Gray Background:** **Neutral / Range**. The market is chopping or consolidating. Stand aside or trade strictly mean-reversion.
#### **2. Candle Colors (Vector Volume)**
* **Green/Red Borders:** Normal volume.
* **Blue / Fuchsia:** **High Volume (1.2x Average)**. Indicates institutional interest or a breakout.
* **Lime / Bright Red:** **Climactic Volume (1.8x Average)**. Indicates potential exhaustion or a stopping volume event.
#### **3. The EMAs**
* **Fast/Slow Lines:** Show the immediate trend direction.
* **Gray/White Lines:** The 200 and 800 EMAs. These act as major support/resistance levels and define the "Big Picture" bias.
* **Lime Line (Intraday Only):** The VWAP (Volume Weighted Average Price).
---
### **How to Use This Indicator**
**Step 1: Check the Regime**
Look at the background color and the Dashboard panel. Is the Trend Strength "Strong" or "Very Strong"?
* *Rule:* Do not take trend-following trades if the Regime is "Range/Neutral."
**Step 2: Check the Confidence**
The dashboard calculates a score from 0 to 100.
* **High Confidence (>67):** All systems go. Alignment of RSI, Volume, and Trend.
* **Medium Confidence (34-66):** Caution warranted. Usually implies divergence in RSI or low volume.
* **Low Confidence (<34):** The trend is weak or failing.
**Step 3: Wait for the Setup (The Arrows)**
The indicator looks for pullbacks into the "Value Zone" (the space between the Fast and Slow EMA).
* **Triangle Up (L):** Appears when price pulls back into the zone during a Bull trend, then bounces out with volume confirmation.
* **Triangle Down (S):** Appears when price rallies into the zone during a Bear trend, then rejects lower.
---
### **Settings & Customization**
* **Mode:** Default is "Auto," but you can force "Intraday" or "Swing" manually.
* **Intraday Style:** Choose between "Aggressive" (9 EMA / 30 EMA) for scalping or "Conservative" (20 EMA / 50 EMA) for day trading.
* **ADX Threshold:** Adjusts how strict the trend filter is (Default: 20).
* **Visual Toggles:** Turn off/on the Panel, Background shading, or Vector candles to clean up your chart.
### **Alerts**
This script comes with built-in alert conditions for:
1. **Bullish Regime Start**
2. **Bearish Regime Start**
3. **High-Confidence Setup Detected**

OBV + WaveTrend Volume Scalper [GratefulFutures]This script is a combination script of three different strategies that provides buy and sell signals based on the change of volume with momentum confirmations.
Sources used:
This script relies on the outstanding scripts of the great script writer LazyBear: LazyBear
The following scripts were used in this publication:
1. A modified "On-Balance Volume Oscillator" modified from LazyBear's original script:
2. Wavetrend Oscillator with crosses, Author: LazyBear
3. Squeeze Momentum Oscillator, Author: LazyBear
This script functions based on the following criteria being true:
1. On balance volume oscillator turning from negative to positive (buy) or positive to negative (sell)
2. Squeeze Momentum value is increasing (buy) or decreasing (sell)
3. Wavetrend 1 (wt1) is greater than wavetrend 2 (wt2) (buy)/ Wavetrend 1 (wt1) is less than wavetrend 2 (wt2) (sell)
By combining these factors the indicator is able to signal exactly when net buying turns to net selling (OBV) and when this change is most advantageous to continue based on the momentum and price action of the underlying asset (SQMOMO and Wavetrend).
This allows you to pair volume and price action for a powerful tool to identify where price will reverse or continue providing exceptional entries for short term trades, especially when combined with other aspects such as support and resistance, or volume profile.
How to use:
Simply adjust the settings to your preference and read the given signals as generated.
Settings
There are multiple ways to tune the signals generated. It is set standard for my preferred use on a 1 minute chart.
OBV Oscillator Settings
The first 4 dropdowns in the Inputs section tune the On Balance Volume Oscillator (OBVO) portion of the indicator. You can choose if you want it to calculate based on close, open, high, low, or other value.
The most impactful in the entire settings is going to be the length and smoothing of the OBVO EMA. Making this number lower increasing the sensitivity to changes in volume, making the signals come quicker but is more susceptible to quick fluctuations. A value of between (5-20) is reasonable for the OBVO EMA length. There is a separate smoothing factor titled OBV Smoothing Length and below that, OBV Smoothing Type , a value of (2) is standard with "SMA" for smoothing type with a value of between 2-10 being reasonable. You may also play with these values to see what you like for your trading style.
Wavetrend Settings
The next 3 options are to modify the wavetrend portion of the indicator. I do not modify these from standard, and feel that they work appropriately on all time frames at the following values: n1 length (10), n2 length (20), Wavetrend Signal SMA length (4)
Squeeze Momentum Settings
The following 5 options through the end modify the Squeeze momentum portion of the indicator. The only one that modifies the signals generated is the KC Length , Making this number lower increasing the sensitivity to changes in price action, making the signals come quicker but is more susceptible to quick fluctuations. A value of between (18-25) is reasonable for KC Length .
Style Setting
You may select if you want to see the buy and sell signals. The following 5 options Raw OBV Osc through Squeeze Momentum allow you to see where each specific requirement was met, posted as a vertical line, but for live use it is recommended to turn all of these vertical lines off and only use the buy and sell signals.
Time Frames:
While this script is most effective on shorter time frames (1 minute for scalping and daytrading) it is also viable to use it on longer timeframes, due to the nature of its components being independent of time frame.
Examples of use - (Green and red vertical lines are for visualization purpose and are not part of the script)
SPY 1 Minute (Factory Settings):
SPX 15 minutes (Factory Settings):
Considerations
This script is meant primarily for short term trading, trades on the basis of seconds to minutes primarily. While they can be a good indication of volume lining up with momentum, it is always wise to use them in combination with other factors such as support, resistance, market structure, volume levels, or the many other techniques out there...
As Always... Happy Trading.
-Not_A_Mad_Scientist (GreatfulFutures Trade University)

Hash SupertrendHash Supertrend is a visually enhanced Supertrend-based indicator designed by Hash Capital Research, tuned specifically for crypto trend trading on Solana (SOL) and Bitcoin (BTC). It combines institutional-style color coding, an optional session time filter, and production-ready alerts for systematic and discretionary traders alike.
What This Indicator Is
Hash Supertrend is a trend-following volatility band indicator built on TradingView’s native ta.supertrend() function.
It’s optimized and visually styled for:
High-volatility crypto pairs (especially SOL/USDT, SOL/USD, BTC/USDT, BTC/USD)
Timeframes typically used by crypto traders (from 5m scalping to 4H swing and 1D trend following)
The script is an indicator, not a strategy:
It does not place trades or show backtest results.
It provides clear trend states, flips, and alerts that you can plug into your own execution stack or manual trading.
Key Features
✅ Tuned for Crypto (Solana & Bitcoin)
Parameters are chosen to respond well to the volatility profile of SOL and BTC, reducing noise while still catching strong moves.
✅ Non-repainting Supertrend Core
Uses TradingView’s built-in ta.supertrend — values may move intrabar as the bar forms, but once a bar closes, the historical line and signals do not repaint.
✅ Fluorescent Trend Visualization
Bright green for bullish phases
Bright red for bearish phases
Adaptive color intensity based on user setting
✅ Glow Layer & Trend Zones
Glow effect around the Supertrend line for instant visual recognition
Optional filled zones between price and line for “trend cloud” style visualization
✅ Time Filter (Session Control)
Option to only mark signals during specific hours for those wanting to integrate with webhooks
Designed for traders who avoid certain sessions (e.g., low-liquidity hours)
✅ Signal Dots & Alerts
Tiny green dots for bullish flips
Tiny red dots for bearish flips
Professional, preconfigured alerts for:
Long Entry
Short Entry
Any Trend Change
Filtered signals outside trading hours (for monitoring only)
The core logic is built on:
ATR Length (ATR Length) Default: 16
Lower values (7–10): more sensitive, more signals, more noise
Higher values (12–20): smoother, fewer but stronger trend signals
Factor (Factor) Default: 3.11
Lower values (1.5–2.5): tighter bands, earlier entries, higher whipsaws
Higher values (3.0–4.0+): wider bands, later entries, stronger trend confirmation
The indicator reads direction from ta.supertrend and classifies:
Bullish Trend: direction < 0
Bearish Trend: direction > 0
A trend flip happens when direction changes sign:
longSignal: Supertrend flips from above price to below price (bearish → bullish)
shortSignal: Supertrend flips from below price to above price (bullish → bearish)

Gold AI RSI Monitor [Stacked + KNN]Here is a comprehensive description and user guide for the Gold AI RSI Monitor. You can copy and paste this into the "Description" field if you publish the script on TradingView, or save it for your own reference.
Gold AI RSI Monitor
🚀 Overview
The Gold AI RSI Monitor is a next-generation dashboard designed specifically for trading volatile assets like Gold (XAUUSD). It completely reimagines the traditional RSI by "stacking" 10 different timeframes (from 1-minute to Monthly) into a single, vertical view.
Integrated into this dashboard is a K-Nearest Neighbors (KNN) Machine Learning algorithm. This AI analyzes historical price action to find patterns similar to the current market and predicts the next likely move with a confidence score.
📊 Visual Guide: How to Read the Chart
1. The "Stacked" Lanes Instead of switching timeframes constantly, this indicator displays them all at once using vertical offsets.
Bottom Lane (0-100): 1-Minute RSI
Middle Lanes: 5m, 15m, 30m, 1H, 2H, 4H, Daily
Top Lane (900-1000): Monthly RSI
2. Gradient Color System The RSI lines change color based on momentum strength:
🔴 Red: Oversold / Bearish (Approaching 30 or lower)
🟡 Yellow: Neutral (Around 50)
🟢 Green: Overbought / Bullish (Approaching 70 or higher)
3. Tracker Lines Each timeframe has a dotted horizontal line extending to the right. This allows you to instantly see the exact RSI value for every timeframe without squinting.
🤖 The AI Engine (KNN)
The "AI" component uses a K-Nearest Neighbors algorithm.
Learning: It scans the last 1,000 bars of history.
Matching: It finds the 5 historical moments that look mathematically identical to the current market conditions (based on RSI and Volatility).
Predicting: It checks if price went UP or DOWN after those historical matches.
The Signals:
Buying Signal: If the majority of historical matches resulted in a price increase, the AI triggers a BUY.
Selling Signal: If the majority resulted in a drop, the AI triggers a SELL.
🎯 How to Trade with This Indicator
1. The "Crosshair" Signal
When the AI detects a high-probability setup, a massive Crosshair appears on your chart:
Green Crosshair: Strong BUY signal.
Red Crosshair: Strong SELL signal.
Note: The crosshair consists of a thick vertical line and a dashed horizontal line intersecting at the signal candle.
2. Timeframe Alignment (Confluence)
Do not rely on the AI alone. Look at the stacked RSIs:
Strong Long: The AI shows a Green Crosshair AND the lower timeframes (1m, 5m, 15m) are all turning Green/upward.
Strong Short: The AI shows a Red Crosshair AND the lower timeframes are turning Red/downward.
3. Support & Resistance Zones
Bottom Dotted Line (30): Support. If RSI hits this and turns up, it's a buying opportunity.
Top Dotted Line (70): Resistance. If RSI hits this and turns down, it's a selling opportunity.
⚙️ Settings Guide
RSI Length: Default is 14. Lower (e.g., 7) makes it faster/choppier; higher (e.g., 21) makes it smoother.
Enable AI Signals: Toggles the KNN calculation on/off.
Neighbors (K): How many historical matches to check. Default is 5.
Increase to 9-10 for fewer, more conservative signals.
Decrease to 3 for faster, more aggressive signals.
AI Timeframe: CRITICAL SETTING.
If left empty, the AI calculates based on your current chart.
Recommendation: For Gold scalping, set this to 15m or 1h. This ensures the AI looks at the bigger trend even if you are zooming in on the 1-minute chart.
⚠️ Disclaimer
This tool is for educational and analytical purposes. The "AI" is a statistical probability algorithm based on past performance, which is not indicative of future results. Always manage your risk.
