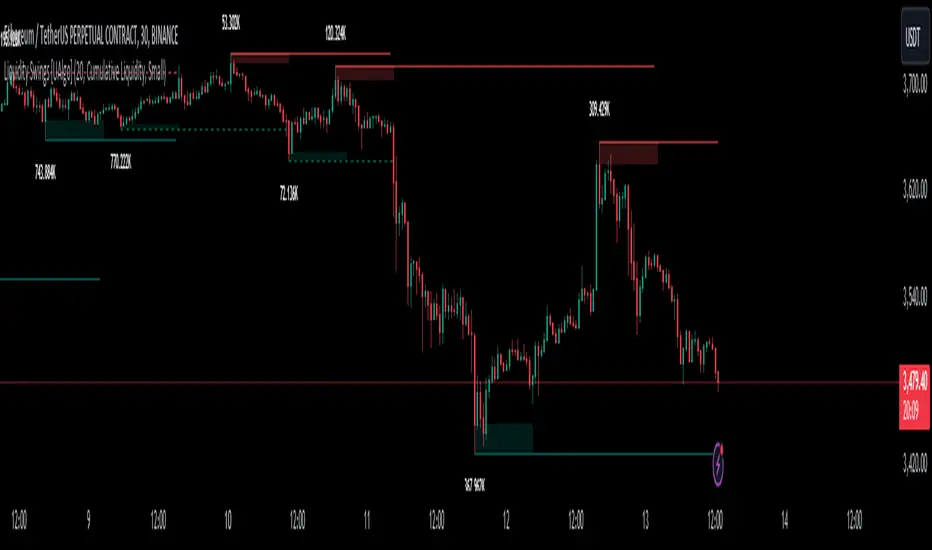
Liquidity Swings [UAlgo]The "Liquidity Swings " indicator is designed to help traders identify liquidity swings within the market. This tool is particularly useful for visualizing areas where liquidity is accumulating and where it is being swept, providing valuable insights for making informed trading decisions. By tracking the pivots in price and associating them with volume, the indicator highlights zones of potential support and resistance, helping traders understand market dynamics more clearly.
🔶 Key Features
Liquidity Swing Sensitivity: Adjustable sensitivity settings to fine-tune the detection of liquidity swings according to market conditions and trader preferences.
Two modes of liquidity calculation:
Cumulative Liquidity: Aggregates unswept liquidity over multiple swings until it is swept, providing a broader view of liquidity accumulation.
Individual Liquidity: Displays the accumulated liquidity for each swing independently, offering a more granular perspective.
Visual Customization: Options to customize the colors and sizes of liquidity lines, areas, and informational text for better visual clarity.
Dynamic Updates: The indicator dynamically updates liquidity zones and labels, adjusting to new market data to keep traders informed in real-time.
🔶 Disclaimer
The "Liquidity Swings " indicator is provided for educational and informational purposes only.
It should not be considered as financial advice or a recommendation to buy or sell any financial instrument.
The use of this indicator involves inherent risks, and users should employ their own judgment and conduct their own research before making any trading decisions. Past performance is not indicative of future results.
🔷 Related Scripts
Liquidity Sweeps
Williams %R Liquidity Sweeps
"smart"に関するスクリプトを検索
ICT Immediate Rebalance Toolkit [LuxAlgo]The ICT Immediate Rebalance Toolkit is a comprehensive suite of tools crafted to aid traders in pinpointing crucial trading zones and patterns within the market.
The ICT Immediate Rebalance, although frequently overlooked, emerges as one of ICT's most influential concepts, particularly when considered within a specific context. The toolkit integrates commonly used price action tools to be utilized in conjunction with the Immediate Rebalance patterns, enriching the capacity to discern context for improved trading decisions.
The ICT Immediate Rebalance Toolkit encompasses the following Price Action components:
ICT Immediate Rebalance
Buyside/Sellside Liquidity
Order Blocks & Breaker Blocks
Liquidity Voids
ICT Macros
🔶 USAGE
🔹 ICT Immediate Rebalance
What is an Immediate Rebalance?
Immediate rebalances, a concept taught by ICT, hold significant importance in decision-making. To comprehend the concept of immediate rebalance, it's essential to grasp the notion of the fair value gap. A fair value gap arises from market inefficiencies or imbalances, whereas an immediate rebalance leaves no gap, no inefficiencies, or no imbalances that the price would need to return to.
Rule of Thumb
After an immediate rebalance, the expectation is for two extension candles to follow; otherwise, the immediate rebalance is considered failed. It's important to highlight that both failed and successful immediate rebalances, when considered within a context, are significant signatures in trading.
Immediate rebalances can occur anywhere and in any timeframe.
🔹 Buyside/Sellside Liquidity
In the context of Inner Circle Trader's teachings, liquidity primarily refers to the presence of stop losses or pending orders, that indicate concentrations of buy or sell orders at specific price levels. Institutional traders, like banks and large financial entities, frequently aim for these liquidity levels or pools to accumulate or distribute their positions.
Buyside liquidity denotes a chart level where short sellers typically position their stops, while Sellside liquidity indicates a level where long-biased traders usually place their stops. These zones often serve as support or resistance levels, presenting potential trading opportunities.
The presentation applied here is the multi-timeframe version of our previously published Buyside-Sellside-Liquidity script.
🔹 Order Blocks & Breaker Blocks
Order Blocks and Breaker Blocks hold significant importance in technical analysis and play a crucial role in shaping market behavior.
Order blocks are fundamental elements of price action analysis used by traders to identify key levels in the market where significant buying or selling activity has occurred. These blocks represent areas on a price chart where institutional traders, banks, or large market participants have placed substantial buy or sell orders, leading to a temporary imbalance in supply and demand.
Breaker blocks, also known as liquidity clusters or pools, complement order blocks by identifying zones where liquidity is concentrated on the price chart. These areas, formed from mitigated order blocks, often act as significant barriers to price movement, potentially leading to price stalls or reversals in the future.
🔹 Liquidity Voids
Liquidity voids are sudden price changes when the price jumps from one level to another. Liquidity voids will appear as a single or a group of candles that are all positioned in the same direction. These candles typically have large real bodies and very short wicks, suggesting very little disagreement between buyers and sellers.
Here is our previously released Liquidity-Voids script.
🔹 ICT Macros
In the context of ICT's teachings, a macro is a small program or set of instructions that unfolds within an algorithm, which influences price movements in the market. These macros operate at specific times and can be related to price runs from one level to another or certain market behaviors during specific time intervals. They help traders anticipate market movements and potential setups during specific time intervals.
Here is our previously released ICT-Macros script.
🔶 SETTINGS
🔹 Immediate Rebalances
Immediate Rebalances: toggles the visibility of the detected immediate rebalance patterns.
Bullish, and Bearish Immediate Rebalances: color customization options.
Wicks 75%, %50, and %25: color customization options of the wick price levels for the detected immediate rebalance.
Ignore Price Gaps: ignores price gaps during calculation.
Confirmation (Bars): specifies the number of bars required to confirm the validation of the detected immediate rebalance.
Immediate Rebalance Icon: allows customization of the size of the icon used to represent the immediate rebalance.
🔹 Buyside/Sellside Liquidity
Buyside/Sellside Liquidity: toggles the visibility of the buy-side/sell-side liquidity levels.
Timeframe: this option is to identify liquidity levels from higher timeframes. If a timeframe lower than the chart's timeframe is selected, calculations will be based on the chart's timeframe.
Detection Length: lookback period used for the detection.
Margin: sets margin/sensitivity for the liquidity levels.
Buyside/Sellside Liquidity Color: color customization option for buy-side/sell-side liquidity levels.
Visible Liquidity Levels: allows customization of the visible buy-side/sell-side liquidity levels.
🔹 Order Blocks & Breaker Blocks
Order Blocks: toggles the visibility of the order blocks.
Breaker Blocks: toggles the visibility of the breaker blocks.
Swing Detection Length: lookback period used for the detection of the swing points used to create order blocks & breaker blocks.
Mitigation Price: allows users to select between the closing price or the wick of the candle.
Use Candle Body in Detection: allows users to use candle bodies as order block areas instead of the full candle range.
Remove Mitigated Order Blocks & Breaker Blocks: toggles the visibility of the mitigated order blocks & breaker blocks.
Order Blocks: Bullish, Bearish Color: color customization option for order blocks.
Breaker Blocks: Bullish, Bearish Color: color customization option for breaker blocks.
Visible Order & Breaker Blocks: allows customization of the visible order & breaker blocks.
Show Order Blocks & Breaker Blocks Labels: toggles the visibility of the order blocks & breaker blocks labels.
🔹 Liquidity Voids
Liquidity Voids: toggles the visibility of the liquidity voids.
Liquidity Voids Width Filter: filtering threshold while detecting liquidity voids.
Ignore Price Gaps: ignores price gaps during calculation.
Remove Mitigated Liquidity Voids: remove mitigated liquidity voids.
Bullish, Bearish, and Mitigated Liquidity Voids: color customization option..
Liquidity Void Labels: toggles the visibility of the liquidity voids labels.
🔹 ICT Macros
London and New York (AM, Launch, and PM): toggles the visibility of specific macros, allowing users to customize macro colors.
Macro Top/Bottom Lines, Extend: toggles the visibility of the macro's pivot high/low lines and allows users to extend the pivot lines.
Macro Mean Line: toggles the visibility of the macro's mean (average) line.
Macro Labels: toggles the visibility of the macro labels, allowing customization of the label size.
🔶 RELATED SCRIPTS
ICT-Killzones-Toolkit
Smart-Money-Concepts
Thanks to our community for recommending this script. For more conceptual scripts and related content, we welcome you to explore by visiting >>> LuxAlgo-Scripts .

Liquidity Grab Zones | Flux Charts💎 GENERAL OVERVIEW
Introducing our new Liquidity Grab Zones Indicator! This indicator finds liquidity grabs in the current ticker and renders buyside & sellside liquidity grab zones. The retests and breakout of the zones are labeled, and you can set up alerts to get notified. For more information, please check the "HOW DOES IT WORK" section.
Features of the new Liquidity Grab Zones Indicator :
Renders Buyside & Sellside Liquidity Grab Zones
Retests & Breaks
Inverse Zones After Broken Feature
Alerts For All Features
Customizable Algorithm
Customizable Styles
🚩UNIQUENESS
Liquidity grabs can be useful when determining candles that have executed a lot of market orders, so you can plann your trades accordingly. This indicator lets you customize the pivot length and the wick-body ratio for liquidity grabs, provide retest & breakout labels, with customized styling and alerts.
📌 HOW DOES IT WORK ?
Liquidity grabs occur when one of the latest pivots has a false breakout. Then, if the wick to body ratio of the bar is higher than 0.5 (can be changed from the settings) a zone is plotted.
These zones usually indicate areas of high market interest where price action may reverse or accelerate. Identifying these zones can provide traders with critical levels for entering or exiting trades. A breakout of these zones generally mean strong movements are inbound, while failing breakouts make these zones act like support / resistance zones.
The indicator also reverses the type of the zone after an invalidation (can be turned off from the settings). This feature helps traders identify potential reversals more accurately.
The zone width is set to the area from the wick to the body of the candlestick, which can be seen here :
⚙️SETTINGS
1. General Configuration
Pivot Length -> This setting determines the range of the pivots. This means a candle has to have the highest / lowest wick of the previous X bars and the next X bars to become a high / low pivot.
Wick-Body Ratio -> After a pivot has a false breakout, the wick-body ratio of the latest candle is tested. The resulting ratio must be higher than this setting for it to be considered as a liquidity grab.
Zone Invalidation -> Select between Wick & Close price for Liquidity Grab Zone Invalidation.
Use these customizable settings to fine-tune the indicator according to your trading strategy and preferences.

COT Index Commercials vs large and small SpeculatorsThe COT reports for futures-only Commitments of Traders and for Futures and Options Combined Commitments of Traders are collected on Tuesdays and published every Friday at 3:30 p.m. Eastern time. The raw data is available free of charge on the Commodity Futures Trading Commission (CFTC) website.
Use it to get a better understanding on which side the smart money (producers, commercials) are trading on.
The COT index ranges from 0 to 100%. Extreme values are areas below 25% and above 75%. When the index reaches 0% or 100%, it means that the market participant has the most extreme net short or net long position in the last 26 weeks. Readings below 25% are considered as a short sentiment and readings above 75% are considered long sentiment. However the COT index is not a timing tool. It only shows the overall market sentiment of the smart money in relation over the past 26 weeks.
You can change the period to calculate the index, as well as the style, which lines to show and if you want to highlight the extreme arias.

Dynamic Order Blocks [LuxAlgo]The Dynamic Order Blocks indicator displays the most recent unmitigated bullish and bearish order blocks on the chart, providing dynamic support/resistance areas.
When price sweeps an order block, this is highlighted by the script indicating a potential reversal.
The average between the displayed order blocks is also displayed.
🔶 USAGE
Order blocks are a popular method of price action analysis, representing price areas where more significant market participants accumulate their orders.
Displaying order blocks dynamically allows obtaining relevant areas of support/resistance. Users can obtain longer-term order blocks using a higher "Swing Lookback" setting.
Users can also use mitigation events to assess the current trend direction, with price mitigating a bearish order block (breaking above the upper extremity) indicating an uptrend, and price mitigating a bullish order block (breaking below the lower extremity) indicating a downtrend.
🔹 Average Level
An average level obtained from the displayed bullish and bearish order blocks is included in the indicator and offers an additional polyvalent dynamic support/resistance level.
The change of direction of the average line can also be indicative of the current trend direction.
🔹 Dynamic Sweeps
Price sweeping the mitigation level of an order block is highlighted on the chart using bordered rectangles. These highlight a breakout failure and can be indicative of a potential reversal.
🔶 SETTINGS
Swing Lookback: Period of the swing detection used to construct order blocks. Higher values will return longer-term order blocks.
Use Candle Body: Use the candle body as the order block area instead of the candle full range.

Fibonacci Inversion Fair Value Gaps | Flux Charts💎 GENERAL OVERVIEW
Introducing our new Fibonacci Inversion Fair Value Gaps (IFVG) indicator! Inverse Fair Value Gaps occur when a Fair Value Gap becomes invalidated. They reverse the role of the original Fair Value Gap, making a bullish zone bearish and vice versa. This indicator plots the Fibonacci retracement levels of the IFVG, which often act like support & resistance levels.
Features of the new Fibonacci IFVGs Indicator :
Renders Bullish / Bearish IFVG Zones
Renders Fibonacci Retracement Levels Of IFVGs
Combination Of Overlapping FVG Zones
Variety Of Zone Detection / Sensitivity / Filtering / Invalidation Settings
High Customizability
🚩UNIQUENESS
This indicator stands out with its ability to render up to 3 Fibonacci retracement levels of IFVGs. Fibonacci retracement levels are widely used within trading, and we wanted to implement them for IFVG zones. You can also customize the FVG Filtering method, FVG & IFVG Zone Invalidation, Detection Sensitivity etc. according to your needs to get the best performance from the indicator.
📌 HOW DOES IT WORK ?
A Fair Value Gap generally occur when there is an imbalance in the market. They can be detected by specific formations within the chart. An Inverse Fair Value Gap is when a FVG becomes invalidated, thus reversing the direction of the FVG.
This indicator renders 0.618, 0.5 and 0.382 (can be changed from the settings) Fibonacci retracement levels of the IFVGs, which often act as support and resistances. Check this example :
⚙️SETTINGS
1. General Configuration
FVG Zone Invalidation -> Select between Wick & Close price for FVG Zone Invalidation.
IFVG Zone Invalidation -> Select between Wick & Close price for IFVG Zone Invalidation. This setting also switches the type for IFVG consumption.
Zone Filtering -> With "Average Range" selected, algorithm will find FVG zones in comparison with average range of last bars in the chart. With the "Volume Threshold" option, you may select a Volume Threshold % to spot FVGs with a larger total volume than average.
FVG Detection -> With the "Same Type" option, all 3 bars that formed the FVG should be the same type. (Bullish / Bearish). If the "All" option is selected, bar types may vary between Bullish / Bearish.
Detection Sensitivity -> You may select between Low, Normal or High FVG detection sensitivity. This will essentially determine the size of the spotted FVGs, with lower sensitivies resulting in spotting bigger FVGs, and higher sensitivies resulting in spotting all sizes of FVGs.
Show Historic Zones -> If this option is on, the indicator will render invalidated IFVG zones as well as current IFVG zones. For a cleaner look at current IFVG zones which are not invalidated yet, you can turn this option off.
2. Fibonacci Retracement Levels
You can enable / disable up to 3 different Fibonnaci Retracement levels at this group of settings. You can also switch their line styles between solid, dashed and dotted as well as changing their colors.

FVG Detector LibraryLibrary "FVG Detector Library"
🔵 Introduction
To save time and improve accuracy in your scripts for identifying Fair Value Gaps (FVGs), you can utilize this library. Apart from detecting and plotting FVGs, one of the most significant advantages of this script is the ability to filter FVGs, which you'll learn more about below. Additionally, the plotting of each FVG continues until either a new FVG occurs or the current FVG is mitigated.
🔵 Definition
Fair Value Gap (FVG) refers to a situation where three consecutive candlesticks do not overlap. Based on this definition, the minimum conditions for detecting a fair gap in the ascending scenario are that the minimum price of the last candlestick should be greater than the maximum price of the third candlestick, and in the descending scenario, the maximum price of the last candlestick should be smaller than the minimum price of the third candlestick.
If the filter is turned off, all FVGs that meet at least the minimum conditions are identified. This mode is simplistic and results in a high number of identified FVGs.
If the filter is turned on, you have four options to filter FVGs :
1. Very Aggressive : In addition to the initial condition, another condition is added. For ascending FVGs, the maximum price of the last candlestick should be greater than the maximum price of the middle candlestick. Similarly, for descending FVGs, the minimum price of the last candlestick should be smaller than the minimum price of the middle candlestick. In this mode, a very small number of FVGs are eliminated.
2. Aggressive : In addition to the conditions of the Very Aggressive mode, in this mode, the size of the middle candlestick should not be small. This mode eliminates more FVGs compared to the Very Aggressive mode.
3. Defensive : In addition to the conditions of the Very Aggressive mode, in this mode, the size of the middle candlestick should be relatively large, and most of it should consist of the body. Also, for identifying ascending FVGs, the second and third candlesticks must be positive, and for identifying descending FVGs, the second and third candlesticks must be negative. In this mode, a significant number of FVGs are eliminated, and the remaining FVGs have a decent quality.
4. Very Defensive : In addition to the conditions of the Defensive mode, the first and third candlesticks should not resemble very small-bodied doji candlesticks. In this mode, the majority of FVGs are filtered out, and the remaining ones are of higher quality.
By default, we recommend using the Defensive mode.
🔵 How to Use
🟣 Parameters
To utilize this library, you need to provide four input parameters to the function.
"FVGFilter" determines whether you wish to apply a filter on FVGs or not. The possible inputs for this parameter are "On" and "Off", provided as strings.
"FVGFilterType" determines the type of filter to be applied to the found FVGs. These filters include four modes: "Very Defensive", "Defensive", "Aggressive", and "Very Aggressive", respectively exhibiting decreasing sensitivity and indicating a higher number of Fair Value Gaps (FVG).
The parameter "ShowDeFVG" is a Boolean value defined as either "true" or "false". If this value is "true", FVGs are shown during the Bullish Trend; however, if it is "false", they are not displayed.
The parameter "ShowSuFVG" is a Boolean value defined as either "true" or "false". If this value is "true", FVGs are displayed during the Bearish Trend; however, if it is "false", they are not displayed.
FVGDetector(FVGFilter, FVGFilterType, ShowDeFVG, ShowSuFVG)
Parameters:
FVGFilter (string)
FVGFilterType (string)
ShowDeFVG (bool)
ShowSuFVG (bool)
🟣 Import Library
You can use the "FVG Detector" library in your script using the following expression:
import TFlab/FVGDetectorLibrary/1 as FVG
🟣 Input Parameters
The descriptions related to the input parameters were provided in the "Parameter" section. In this section, for your convenience, the code related to the inputs is also included, and you can copy and paste it into your script.
PFVGFilter = input.string('On', 'FVG Filter', )
PFVGFilterType = input.string('Defensive', 'FVG Filter Type', )
PShowDeFVG = input.bool(true, ' Show Demand FVG')
PShowSuFVG = input.bool(true, ' Show Supply FVG')
🟣 Call Function
You can copy the following code into your script to call the FVG function. This code is based on the naming conventions provided in the "Input Parameter" section, so if you want to use exactly this code, you should have similar parameter names or have copied the "Input Parameter" values.
FVG.FVGDetector(PFVGFilter, PFVGFilterType, PShowDeFVG, PShowSuFVG)

FVG Detector [TradingFinder] Fair Value Gap-Imbalance-Mitigated🔵 Introduction
When the market makes a strong move in the form of a "Marubozu" or "Spike" candlestick and consecutive candles move without a retracement, the maximum place where a "FVG" or "Fair Value Gap" is created.
🔵 Definition
To describe this precisely, whenever a move occurs where the current candle does not cover the body of the previous and subsequent candles, a fair value gap is created.
Important : The significant point is that, because there is no equilibrium between buyers and sellers in these conditions, and market power is in the hands of buyers or sellers, the market is likely to move towards these areas.
An example of "FVG" in a price increase where we expect buying on the return to it.
An example of "FVG" in a downward trend where the market will move towards it in a downward direction.
🔵 How to Use
🟣 Bearish FVG
In a downward trend, "orange boxes" are drawn, which are the same and can act as "support" zones along the downward path, and we expect the price to continue its downward trend on return.
🟣 Bullish FVG
In an upward trend, "green boxes" are drawn, which are . They act exactly like support in the upward path, and we expect the price to continue its upward trend on return.
🟣 Auxiliary Definitions
Imbalance : As mentioned above, market power is in the hands of one of the two sides, buyers or sellers, and a non-equilibrium zone is created. It may be completed in whole or in part in subsequent price movements.
Mitigated : If the price returns to the "FVG" area and fills it, we call it "Mitigated," and most "pending" or "profit and loss limits" positions are executed. We will not have a specific reaction on the return of the price.
🔵 Settings
Very Aggressive : In addition to the initial condition, another condition is added. For an upward FVG, the maximum price of the last candle should be larger than the middle candle's maximum price. Similarly, for a downward FVG, the minimum price of the last candle should be smaller than the middle candle's minimum price. In this mode, a very small number of FVGs are eliminated.
Aggressive : In addition to the conditions of the Very Aggressive mode, in this mode, the size of the middle candle should not be small. In this mode, a larger number of FVGs are eliminated.
Defensive : In addition to the conditions of the Very Aggressive mode, in this mode, the size of the middle candle should be relatively large, and the majority of it should be made up of the body. Additionally, to identify upward FVGs, the second and third candles must be positive, and to identify downward FVGs, the second and third candles must be negative. In this mode, a large number of FVGs are eliminated, leaving only those with suitable quality.
Very Defensive : In addition to the conditions of the Defensive mode, the first and third candles should not be very small-bodied doji candles. In this mode, the majority of FVGs are filtered out, leaving only the highest quality ones.
🔵 Features
Show Demand FVG : Displays demand-related boxes, which can be "off" and "on."
Show Supply FVG : Displays supply-related boxes along the path, and can be turned "off" and "on."
🔵 Indicator Advantages
In this indicator, I have implemented 4 types of "filters" that allow you to select one based on the trading symbol, timeframe, etc. From "Very Aggressive" to "Very Defensive" mode, it is possible to select.
In most indicators, all FVGs are displayed, and the chart becomes full of lines. But this unique feature allows the trader to manage the drawing of boxes.

Order Blocks Finder [TradingFinder] Major OB | Supply and Demand🔵 Introduction
Drawing all order blocks on the path, especially in range-bound or channeling markets, fills the chart with lines, making it confusing rather than providing the trader with the best entry and exit points.
🔵 Reason for Indicator Creation
For traders familiar with market structure and only need to know the main accumulation points (best entry or exit points), and primary order blocks that act as strong sources of power.
🟣 Important Note
All order blocks, both ascending and descending, are identified and displayed on the chart when the structure of "BOS" or "CHOCH" is broken, which can also be identified with "MSS."
🔵 How to Use
When the indicator is installed, it plots all order blocks (active order blocks) and continues until the price reaches them. This continuation happens in boxes to have a better view in the TradingView chart.
Green Range : Ascending order blocks where we expect a price increase in these areas.
Red Range : Descending order blocks where we expect a price decrease in these areas.
🔵 Settings
Order block refine setting : When Order block refine is off, the supply and demand zones are the entire length of the order block (Low to High) in their standard state and cannot be improved. If you turn on Order block refine, supply and demand zones will improve using the error correction algorithm.
Refine type setting : Improving order blocks using the error correction algorithm can be done in two ways: Defensive and Aggressive. In the Aggressive method, the largest possible range is considered for order blocks.
🟣 Important
The main advantage of the Aggressive method is minimizing the loss of stops, but due to the widening of the supply or demand zone, the reward-to-risk ratio decreases significantly. The Aggressive method is suitable for individuals who take high-risk trades.
In the Defensive method, the range of order blocks is minimized to their standard state. In this case, fewer stops are triggered, and the reward-to-risk ratio is maximized in its optimal state. It is recommended for individuals who trade with low risk.
Show high level setting : If you want to display major high levels, set show high level to Yes.
Show low level setting : If you want to display major low levels, set show low level to Yes.
🔵 How to Use
The general view of this indicator is as follows.
When the price approaches the range, wait for the price reaction to confirm it, such as a pin bar or divergence.
If the price passes with a strong candle (spike), especially after a long-range or at the beginning of sessions, a powerful event is happening, and it is outside the credibility level.
An Example of a Valid Zone
An Example of Breakout and Invalid Zone. (My suggestion is not to use pending orders, especially when the market is highly volatile or before and after news.)
After reaching this zone, expect the price to move by at least the minimum candle that confirmed it or a price ceiling or floor.
🟣 Important : These factors can be more accurately measured with other trend finder indicators provided.
🔵 Auxiliary Tools
There is much talk about not using trend lines, candlesticks, Fibonacci, etc., in the web space. However, our suggestion is to create and use tools that can help you profit from this market.
• Fibonacci Retracement
• Trading Sessions
• Candlesticks
🔵 Advantages
• Plotting main OBs without additional lines;
• Suitable for timeframes M1, M5, M15, H1, and H4;
• Effective in Tokyo, Sydney, and London sessions;
• Plotting the main ceiling and floor to help identify the trend.

Implied Orderblock Breaker (Zeiierman)█ Overview
The Implied Order Block Breaker (Zeiierman) is a tool designed to identify enhanced order blocks with imbalances. These enhanced order blocks represent areas where there is a rapid price movement. Essentially, this indicator uses order blocks and suggests that a swift price movement away from these levels, breaking the current market structure, could indicate an area that the market has not correctly valued. This technique offers traders a unique method to identify potential market inefficiencies and imbalances, serving as a guide for potential price revisits.
The indicator doesn't scan for imbalances in the traditional sense — where there's an absence of trades between two price levels — but instead, it identifies quick movements away from key levels that suggest where an imbalance might exist. Relying on crossovers and cross-unders in conjunction with pivot points and examining the high/low within the same period provides an innovative method for traders to spot these potentially undervalued or overvalued areas in the market. These inferred imbalances can be crucial for traders looking for price levels where the market might make significant moves.
█ How It Works
Bullish
Crossover: The closing price of a bar crosses above a pivot high, which is an indication that buyers are in control and pushing the price upwards.
New Low Within Period: There is a lower low within the same period as the pivot high. This suggests that after setting a high, the market pulled back to set a new low, potentially leaving a price gap on the way up as the price quickly recovers.
Bearish
Crossunder: The closing price of a bar crosses under a pivot low, indicating that sellers are taking control and driving the price down.
New High Within Period: There is a higher high within the same period as the pivot low. This condition suggests that the market rallied to a new high before falling back below the pivot low, potentially leaving a gap on the way down.
█ How to Use
The enhanced order blocks are often revisited, and the price may aim to 'fill' the potential imbalance created by the rapid price movement, thereby presenting traders with potential entry or exit points. This approach aligns with the idea that imbalances are frequently revisited by the market, and when combined with the context of Order Blocks, it provides even more confluence.
Example
Here, if the price drops rapidly after setting a new high—crossing under the pivot low—it may skip over certain price levels, creating a 'gap' that signifies an area where the price might have been overvalued (imbalance), which the market may revisit for a potential price correction or revaluation.
█ Settings
Period: Determines the number of bars used for identifying pivot highs and lows. A higher value gives more significant but less frequent signals, while a lower value increases sensitivity but might give more false positives.
Pivot Surrounding: Specifies the number of candles to analyze around a pivot point. Increasing this value broadens the analysis range, potentially capturing more setups but possibly including less significant ones.
-----------------
Disclaimer
The information contained in my Scripts/Indicators/Ideas/Algos/Systems does not constitute financial advice or a solicitation to buy or sell any securities of any type. I will not accept liability for any loss or damage, including without limitation any loss of profit, which may arise directly or indirectly from the use of or reliance on such information.
All investments involve risk, and the past performance of a security, industry, sector, market, financial product, trading strategy, backtest, or individual's trading does not guarantee future results or returns. Investors are fully responsible for any investment decisions they make. Such decisions should be based solely on an evaluation of their financial circumstances, investment objectives, risk tolerance, and liquidity needs.
My Scripts/Indicators/Ideas/Algos/Systems are only for educational purposes!

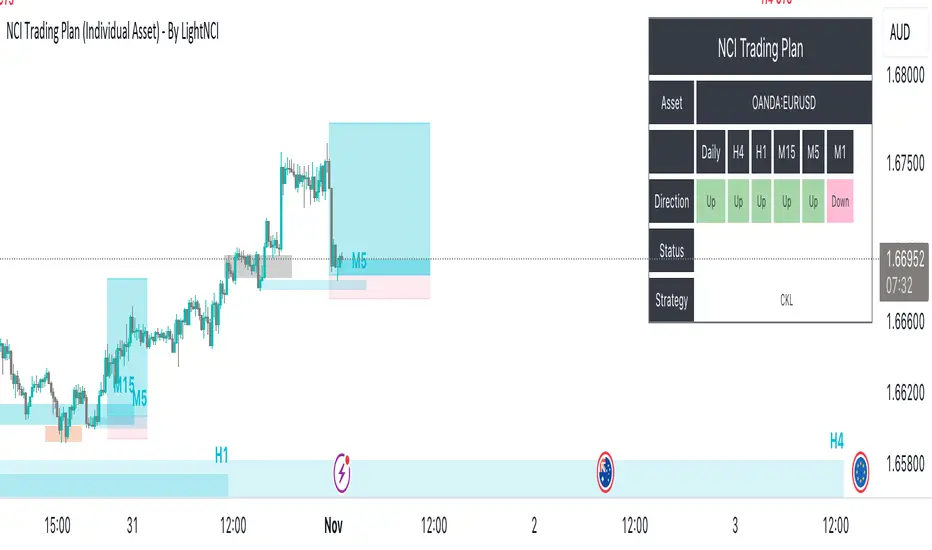
NCI Trading Plan (Individual Asset)NCI Trading Plan (Individual Asset)- By LightNCI
NCI, which stands for New Concept Integration by Jayce PHAM, is a comprehensive approach that incorporates various critical aspects of trading to provide a logical, structured, and integrated approach to the financial markets. NCI covers market structure, key levels, smart money concepts, multiple timeframes and market cycles
About the NCI Trading Plan (Individual Asset) Indicator
The NCI Trading Plan is just a table allowing traders to keep track of a single asset, but multiple timeframe status on a single table, ensuring a comprehensive overview of trading statuses and strategies for each timeframe. The status is not automatically update. Using the NCI strategy, you may update it yourself the status of each timeframe.
Features
1. Display column for Daily, H4, H1, M15, M5, M1: Designed to support multi-timeframe analysis.
2. Direction Status Indication: Visualise the direction of each timeframe.
3. Dynamic Status Indication: Visualize the trading status for each asset:
i. Monitor: Asset is under review or surveillance.
ii. Confirmation: A potential trading signal or setup is being confirmed.
iii. Entry Set: An order for the asset has been placed.
iv. Forward-Test: An asset under monitored for it to being forward test.
4. Strategy Indication: Each asset can be tagged with a specific strategy identifier:
i. CKL: Confluence Key Level
ii. UKL: Un-Confluence Key Level
iii. SMC: Smart Money Concept
iv. BRT: Break & Re-Test
v. RTNKL: Re-Test of New Key Level
5. Stylisation: Color-code the statuses, table and fonts to suit your visual preference.
How to use
1. Asset Name: Select asset from the list
2. Timeframe Direction: Choose direction for each timeframe.
3. Status Selection: Choose the current trading status for each asset.
4. Strategy Selection: Assign a trading strategy to each asset.
5. Style: Customise the appearance of your trading plan by selecting preferred colours for different statuses and headers.
Conclusion
The NCI Trading Plan ensures a systematic and organised approach to multi-time frame trading. By maintaining a visual overview of multi-time frame analysis and their corresponding trading statuses and strategies, traders can efficiently manage their portfolio and ensure timely decision-making.
Tip: To reset or modify an asset's status or strategy, simply adjust the settings in the panel on the left. The table will update in real-time.
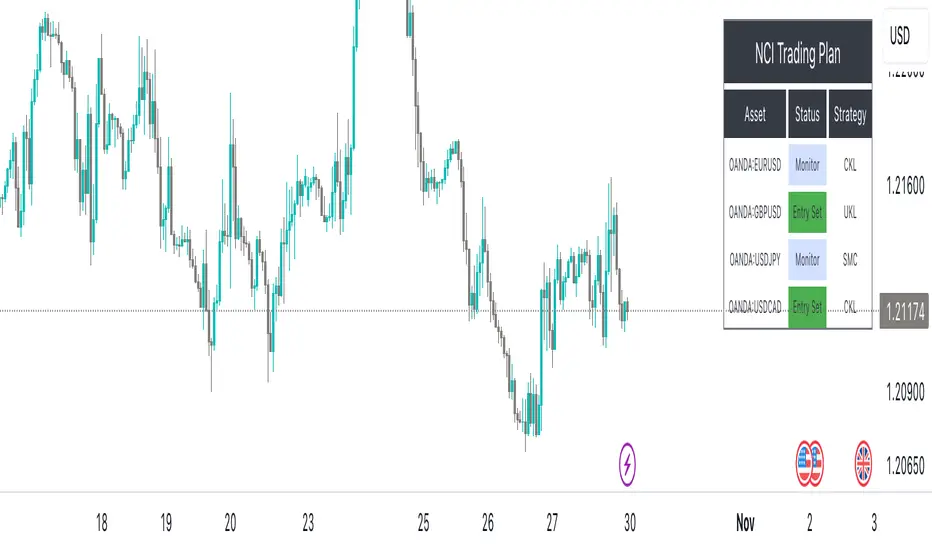
NCI Trading Plan - By LightNCINCI Trading Plan - By LightNCI
NCI, which stands for New Concept Integration by Jayce PHAM, is a comprehensive approach that incorporates various critical aspects of trading to provide a logical, structured, and integrated approach to the financial markets. NCI covers market structure, key levels, smart money concepts, multiple timeframes and market cycles
About the NCI Trading Plan Indicator
The NCI Trading Plan is just a table allowing traders to keep track of multiple assets on a single chart, ensuring a comprehensive overview of trading statuses and strategies for each asset. The status is not automatically update. Using the NCI strategy, you may update it yourself the status of each asset.
Features
1. Display up to 10 different assets: Designed to support multi-asset trading strategies.
2. Dynamic Status Indication: Visualize the trading status for each asset:
i. Monitor: Asset is under review or surveillance.
ii. Confirmation: A potential trading signal or setup is being confirmed.
iii. Entry Set: An order for the asset has been placed.
iv. Forward-Test: An asset under monitored for it to being forward test.
3. Strategy Indication: Each asset can be tagged with a specific strategy identifier:
i. CKL: Confluence Key Level
ii. UKL: Un-Confluence Key Level
iii. SMC: Smart Money Concept
iv. BRT: Break & Re-Test
v. RTNKL: Re-Test of New Key Level
4. Customisable Display: Choose which assets you wish to display with a simple toggle on/off feature.
5. Stylisation: Color-code the statuses, table and fonts to suit your visual preference.
How to use
1. Toggle Display: Use the "Show Asset" checkboxes to determine which assets are visible.
2. Asset Name: Assign a name or symbol to each asset.
3. Status Selection: Choose the current trading status for each asset.
4. Strategy Selection: Assign a trading strategy to each asset.
5. Style: Customise the appearance of your trading plan by selecting preferred colours for different statuses and headers.
Conclusion
The NCI Trading Plan ensures a systematic and organised approach to multi-asset trading. By maintaining a visual overview of various assets and their corresponding trading statuses and strategies, traders can efficiently manage their portfolio and ensure timely decision-making.
Tip: To reset or modify an asset's status or strategy, simply adjust the settings in the panel on the left. The table will update in real-time.
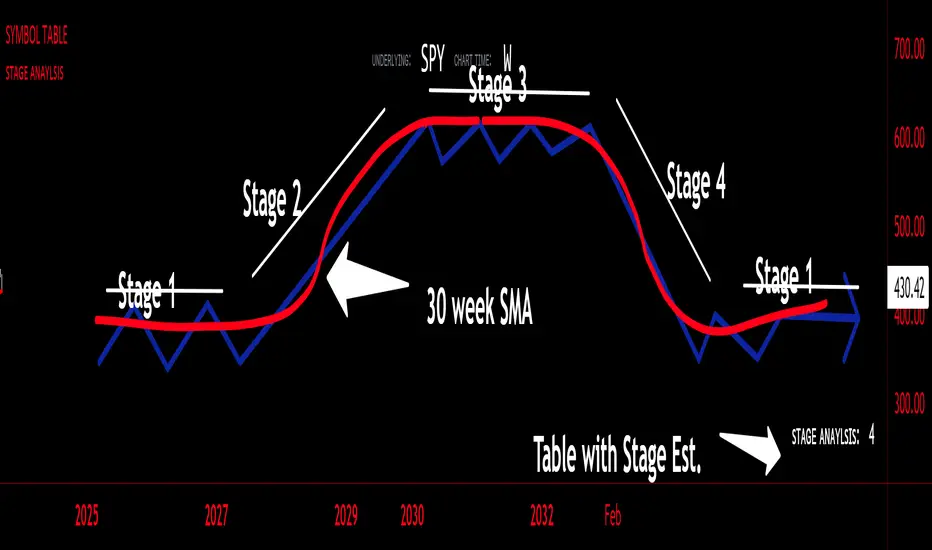
sᴛᴀɢᴇ ᴀɴᴀʏʟsɪsStage analysis is a technical analysis approach that involves categorizing a stock's price movements into different stages to help traders and investors make more informed decisions. It was popularized by Stan Weinstein in his book, "Secrets for Profiting in Bull and Bear Markets." The stages are used to identify the overall trend and to time entries and exits in the market. Here's an explanation of the typical stages in stage analysis:
1. **Stage 1: Accumulation Phase**
- In this stage, the stock is in a downtrend or has been trading sideways for an extended period.
- Volume is relatively low, indicating that institutions and smart money may be quietly accumulating shares.
- The stock may test and hold support levels, showing signs of stability.
- The goal for traders in this stage is to identify the potential for a trend reversal.
2. **Stage 2: Markup (Bull Market) Phase**
- This is the stage where the stock starts a significant uptrend.
- Volume increases as institutional and retail investors become more interested in the stock.
- Technical indicators like moving averages and trendlines confirm the uptrend.
- Traders and investors look for buying opportunities during pullbacks or consolidations within the uptrend.
3. **Stage 3: Distribution Phase**
- In this stage, the stock's price begins to show signs of weakness.
- Volume might decrease as institutions and smart money start selling their positions.
- The stock may start forming a trading range or exhibit bearish chart patterns.
- Traders should consider taking profits or reducing exposure to the stock as it may enter a downtrend.
4. **Stage 4: Markdown (Bear Market) Phase**
- This is the stage where the stock enters a significant downtrend.
- Volume may remain elevated as selling pressure dominates.
- Technical indicators confirm the downtrend.
- Traders and investors should avoid buying the stock and may consider short-selling or staying on the sidelines.
Stage analysis helps traders and investors make decisions based on the current stage of a stock's price movement. The goal is to enter during the accumulation phase or early in the markup phase and exit during the distribution phase or before the markdown phase to maximize profits and minimize losses.
=============================================================
try to just show the Stage number in a table, but always double check for yourself
Session CandlesThis indicator is designed to visually represent different trading sessions on a price chart, highlighting candlestick colors to distinguish between bullish (upward movement) and bearish (downward movement) trends during various market sessions. Here's an overview of how the indicator works:
1. Session Definition: The indicator defines four distinct trading sessions:
- London Session: Typically covering the European trading hours.
- New York AM Session: Representing the morning hours of the New York trading session.
- New York PM Session: Representing the afternoon hours of the New York trading session.
- Asia Session: Encompassing the trading hours of the Asian markets.
2. Configuration Options: Users can customize the behavior of the indicator through input options. For each session, users can enable or disable the display of session-specific candles.
3. Candle Coloring: The indicator determines the color of candles based on the following criteria:
- For each session, it checks whether the current candle's closing price is higher than its opening price.
- If the closing price is higher, the candle is considered bullish, and a user-defined green color is used for the candle.
- If the closing price is lower, the candle is considered bearish, and a user-defined red color is applied.
4. Display: The indicator then applies the calculated candle colors to the respective candles of each trading session on the price chart. This visual distinction helps traders quickly identify the prevailing trend during different market sessions.
To use the indicator, traders can overlay it on their price charts in TradingView. By enabling or disabling specific trading sessions, they can focus on the trends and price movements during those specific time periods.
Please note that the actual appearance of the indicator on the chart depends on the user's chosen settings for session enablement and color preferences.
Master Pattern [LuxAlgo]The Master Pattern indicator is derived from the framework proposed by Wyckoff and automatically displays major/minor patterns and their associated expansion lines on the chart.
Liquidity levels are also included and can be used as targets/stops. Note that the Liquidity levels are plotted retrospectively as they are based on pivots.
🔶 USAGE
The Master Pattern indicator detects contraction phases in the markets (characterized by a lower high and higher low). The resulting average from the latest swing high/low is used as expansion line. Price breaking the contraction range upwards highlights a bullish master pattern, while a break downward highlights a bearish master pattern.
During the expansion phase price can tend to be stationary around the expansion level. This phase is then often followed by the price significantly deviating from the expansion line, highlighting a markup phase.
Expansion lines can also be used as support/resistance levels.
🔹 Major/Minor Patterns
The script can classify patterns as major or minor patterns.
Major patterns occur when price breaks both the upper and lower extremity of a contraction range, with their contraction area highlighted with a border, while minor patterns have only a single extremity broken.
🔶 SETTINGS
Contraction Detection Lookback: Lookback used to detect the swing points used to detect the contraction range.
Liquidity Levels: Lookback for the swing points detection used as liquidity levels. Higher values return longer term liquidity levels.
Show Major Pattern: Display major patterns.
Show Minor Pattern: Display minor patterns.

Liquidity Sweeps and RaidsThis basic script calculates and plots runs on liquidity levels through Raids and Sweeps. When the price violates the 3 fractal level, a raid or sweep occurs. You can use it to automate markup, understand liquidity levels, and reduce human error in your analysis. Additionally, you can set up an alarm to notify you when new sweeps or raids occur. Combine it with your current strategy or try any price action theory you prefer. Essentially, the price always seeks liquidity, so when some of it is taken, it makes sense to look for a reaction and potential reversal. Stay ahead by capitalizing on liquidity insights for potential reversals. Cheers, Cancamurria.

Volume Profile Bar-Magnified Order Blocks [MyTradingCoder]Introducing "Volume Profile Bar-Magnified Order Blocks", an innovative and unique trading indicator designed to provide traders with a comprehensive understanding of market dynamics. This tool takes the concept of identifying order blocks on your chart and elevates it by integrating a detailed volume profile within each order block zone.
Unlike standard order block indicators, Volume Profile Bar-Magnified Order Blocks pulls data from lower timeframe bars and assigns it to various segments of the order block. By providing this volume profile inside the order block, the indicator supplies a deeper, multi-dimensional view of market activity that can enhance your trading decisions.
Crucially, users have the ability to fine-tune the detection of order blocks. This is made possible through a single input setting called "Tuning". This integer value allows you to control the significance and frequency of the order blocks. Higher numbers will produce more significant order blocks, though they will appear less frequently. Lower numbers, on the other hand, will yield less significant order blocks, but they will occur more often. This enables you to adjust the sensitivity of the indicator according to your specific trading strategy and style.
Key Settings:
Number of Segments: Customize the level of detail in your volume profile by selecting the number of segments you want inside each order block.
Tuning: Adjust the sensitivity of order block detection to align with your trading strategy. Higher values produce more significant but less frequent order blocks, while lower values yield less significant but more frequent order blocks.
Color Inputs: Personalize the look of your chart by selecting the colors for various elements of the indicator. This ensures a seamless integration with your current chart aesthetics and improves visual clarity.
Here is a s creenshot that beautifully demonstrates the power of this indicator. You'll see how the price rejects perfectly off the highest volume segment in an order block, showcasing the indicator's potential for pinpointing high-impact price levels.
While Volume Profile Bar-Magnified Order Blocks offers many unique features, it should be used in conjunction with other indicators and forms of analysis for a complete trading strategy. As with all tools, it does not guarantee profitable trades but is intended to give traders more information to base their decisions on. Use it to complement your existing analysis and enhance your understanding of market behavior.
Experience a new level of clarity in your trading with Volume Profile Bar-Magnified Order Blocks - an indicator that goes beyond the surface to help you navigate the markets more effectively.

Wyckoff Range StrategyThe Wyckoff Range Strategy is a trading strategy that aims to identify potential accumulation and distribution phases in the market using the principles of Wyckoff analysis. It also incorporates the detection of spring and upthrust patterns.
Here's a step-by-step explanation of how to use this strategy:
Understanding Accumulation and Distribution Phases:
Accumulation Phase: This is a period where smart money (large institutional traders) accumulates a particular asset at lower prices. It is characterized by a sideways or consolidating price action.
Distribution Phase: This is a period where smart money distributes or sells a particular asset at higher prices. It is also characterized by a sideways or consolidating price action.
Input Variables:
crossOverLength: This variable determines the length of the moving average crossover used to identify accumulation and distribution phases. You can adjust this value based on the market you are trading and the time frame you are analyzing.
stopPercentage: This variable determines the percentage used to calculate the stop loss level. It helps you define a predefined level at which you would exit a trade if the price moves against your position.
Strategy Conditions:
Enter Long: The strategy looks for a crossover of the close price above the SMA of the close price with a length of crossOverLength and a crossover of the low price above the SMA of the low price with a length of 20. This combination suggests the start of an accumulation phase and a potential buying opportunity.
Exit Long: The strategy looks for a crossunder of the close price below the SMA of the close price with a length of crossOverLength or a crossunder of the high price below the SMA of the high price with a length of 20. This combination suggests the end of an accumulation phase and a potential exit signal for long positions.
Enter Short: The strategy looks for a crossunder of the close price below the SMA of the close price with a length of crossOverLength and a crossunder of the high price below the SMA of the high price with a length of 20. This combination suggests the start of a distribution phase and a potential selling opportunity.
Exit Short: The strategy looks for a crossover of the close price above the SMA of the close price with a length of crossOverLength or a crossover of the low price above the SMA of the low price with a length of 20. This combination suggests the end of a distribution phase and a potential exit signal for short positions.
Stop Loss:
The strategy sets a stop loss level for both long and short positions. The stop loss level is calculated based on the stopPercentage variable, which represents the percentage of the current close price. If the price reaches the stop loss level, the strategy will automatically exit the position.
Plotting Wyckoff Schematics:
The strategy plots different shapes on the chart to indicate the identified phases and patterns. Green and red labels indicate the accumulation and distribution phases, respectively. Blue triangles indicate spring patterns, and orange triangles indicate upthrust patterns.
To use this strategy, you can follow these steps:
Jim Forte — Anatomy of a Trading Range
robertbrain.com/Bull...+a+Trading+Range.pdf

SMT Divergences [LuxAlgo]The SMT Divergences indicator highlights SMT divergences between the chart symbol and two user-selected tickers (ES and YM by default).
A dashboard returning the SMT divergences statistics is also provided within the settings.
🔶 SETTINGS
Swing Lookback: Calculation window used to detect swing points.
Comparison Ticker: If enabled, will detect SMT divergences between the chart prices and the prices of the selected ticker.
🔹 Dashboard
Show Dashboard: Displays statistics dashboard on the chart.
Location: Location of the dashboard on the chart.
Size: Size of the displayed dashboard.
🔶 USAGE
SMT Divergences are characterized by diverging swing points between two securities.
The detection of SMT Divergences is performed by detecting swing points using the user chart prices as well as the prices of the selected external tickers. If a swing point on the chart ticker is detected at the same time on external tickers, comparison is performed.
Due to the detection requiring swing point confirmation (3 candles by default), this indicator can better be used to study price behaviors on the occurrence of an SMT divergence.
The dashboard highlights the number of SMT divergences that occurred on a swing high and swing low between the chart ticker and the selected external tickers.
The returned percentage indicates the proportion of swing highs or swing lows that led to an SMT divergence.

ICT Concepts [LuxAlgo]The ICT Concepts indicator regroups core concepts highlighted by trader and educator "The Inner Circle Trader" (ICT) into an all-in-one toolkit. Features include Market Structure (MSS & BOS), Order Blocks, Imbalances, Buyside/Sellside Liquidity, Displacements, ICT Killzones, and New Week/Day Opening Gaps.
🔶 SETTINGS
🔹 Mode
When Present is selected, only data of the latest 500 bars are used/visualized, except for NWOG/NDOG
🔹 Market Structure
Enable/disable Market Structure.
Length: will set the lookback period/sensitivity.
In Present Mode only the latest Market Structure trend will be shown, while in Historical Mode, previous trends will be shown as well:
You can toggle MSS/BOS separately and change the colors:
🔹 Displacement
Enable/disable Displacement.
🔹 Volume Imbalance
Enable/disable Volume Imbalance.
# Visible VI's: sets the amount of visible Volume Imbalances (max 100), color setting is placed at the side.
🔹 Order Blocks
Enable/disable Order Blocks.
Swing Lookback: Lookback period used for the detection of the swing points used to create order blocks.
Show Last Bullish OB: Number of the most recent bullish order/breaker blocks to display on the chart.
Show Last Bearish OB: Number of the most recent bearish order/breaker blocks to display on the chart.
Color settings.
Show Historical Polarity Changes: Allows users to see labels indicating where a swing high/low previously occurred within a breaker block.
Use Candle Body: Allows users to use candle bodies as order block areas instead of the full candle range.
Change in Order Blocks style:
🔹 Liquidity
Enable/disable Liquidity.
Margin: sets the sensitivity, 2 points are fairly equal when:
'point 1' < 'point 2' + (10 bar Average True Range / (10 / margin)) and
'point 1' > 'point 2' - (10 bar Average True Range / (10 / margin))
# Visible Liq. boxes: sets the amount of visible Liquidity boxes (max 50), this amount is for Sellside and Buyside boxes separately.
Colour settings.
Change in Liquidity style:
🔹 Fair Value Gaps
Enable/disable FVG's.
Balance Price Range: this is the overlap of latest bullish and bearish Fair Value Gaps.
By disabling Balance Price Range only FVGs will be shown.
Options: Choose whether you wish to see FVG or Implied Fair Value Gaps (this will impact Balance Price Range as well)
# Visible FVG's: sets the amount of visible FVG's (max 20, in the same direction).
Color settings.
Change in FVG style:
🔹 NWOG/NDOG
Enable/disable NWOG; color settings; amount of NWOG shown (max 50).
Enable/disable NDOG ; color settings; amount of NDOG shown (max 50).
🔹 Fibonacci
This tool connects the 2 most recent bullish/bearish (if applicable) features of your choice, provided they are enabled.
3 examples (FVG, BPR, OB):
Extend lines -> Enabled (example OB):
🔹 Killzones
Enable/disable all or the ones you need.
Time settings are coded in the corresponding time zones.
🔶 USAGE
By default, the indicator displays each feature relevant to the most recent price variations in order to avoid clutter on the chart & to provide a very similar experience to how a user would contruct ICT Concepts by hand.
Users can use the historical mode in the settings to see historical market structure/imbalances. The ICT Concepts indicator has various use cases, below we outline many examples of how a trader could find usage of the features together.
In the above image we can see price took out Sellside liquidity, filled two bearish FVGs, a market structure shift, which then led to a clean retest of a bullish FVG as a clean setup to target the order block above.
Price then fills the OB which creates a breaker level as seen in yellow.
Broken OBs can be useful for a trader using the ICT Concepts indicator as it marks a level where orders have now been filled, indicating a solidified level that has proved itself as an area of liquidity. In the image above we can see a trade setup using a broken bearish OB as a potential entry level.
We can see the New Week Opening Gap (NWOG) above was an optimal level to target considering price may tend to fill / react off of these levels according to ICT.
In the next image above, we have another example of various use cases where the ICT Concepts indicator hypothetically allow traders to find key levels & find optimal entry points using market structure.
In the image above we can see a bearish Market Structure Shift (MSS) is confirmed, indicating a potential trade setup for targeting the Balanced Price Range imbalance (BPR) below with a stop loss above the buyside liquidity.
Although what we are demonstrating here is a hindsight example, it shows the potential usage this toolkit gives you for creating trading plans based on ICT Concepts.
Same chart but playing out the history further we can see directly after price came down to the Sellside liquidity & swept below it...
Then by enabling IFVGs in the settings, we can see the IFVG retests alongside the Sellside & Buyside liquidity acting in confluence.
Which allows us to see a great bullish structure in the market with various key levels for potential entries.
Here we can see a potential bullish setup as price has taken out a previous Sellside liquidity zone and is now retesting a NWOG + Volume Imbalance.
Users also have the option to display Fibonacci retracements based on market structure, order blocks, and imbalance areas, which can help place limit/stop orders more effectively as well as finding optimal points of interest beyond what the primary ICT Concepts features can generate for a trader.
In the above image we can see the Fibonacci extension was selected to be based on the NWOG giving us some upside levels above the buyside liquidity.
🔶 DETAILS
Each feature within the ICT Concepts indicator is described in the sub sections below.
🔹 Market Structure
Market structure labels are constructed from price breaking a prior swing point. This allows a user to determine the current market trend based on the price action.
There are two types of Market Structure labels included:
Market Structure Shift (MSS)
Break Of Structure (BOS)
A MSS occurs when price breaks a swing low in an uptrend or a swing high in a downtrend, highlighting a potential reversal. This is often labeled as "CHoCH", but ICT specifies it as MSS.
On the other hand, BOS labels occur when price breaks a swing high in an uptrend or a swing low in a downtrend. The occurrence of these particular swing points is caused by retracements (inducements) that highlights liquidity hunting in lower timeframes.
🔹 Order Blocks
More significant market participants (institutions) with the ability of placing large orders in the market will generally place a sequence of individual trades spread out in time. This is referred as executing what is called a "meta-order".
Order blocks highlight the area where potential meta-orders are executed. Bullish order blocks are located near local bottoms in an uptrend while bearish order blocks are located near local tops in a downtrend.
When price mitigates (breaks out) an order block, a breaker block is confirmed. We can eventually expect price to trade back to this breaker block offering a new trade opportunity.
🔹 Buyside & Sellside Liquidity
Buyside / Sellside liquidity levels highlight price levels where market participants might place limit/stop orders.
Buyside liquidity levels will regroup the stoploss orders of short traders as well as limit orders of long traders, while Sellside liquidity levels will regroup the stoploss orders of long traders as well as limit orders of short traders.
These levels can play different roles. More informed market participants might view these levels as source of liquidity, and once liquidity over a specific level is reduced it will be found in another area.
🔹 Imbalances
Imbalances highlight disparities between the bid/ask, these can also be defined as inefficiencies, which would suggest that not all available information is reflected by the price and would as such provide potential trading opportunities.
It is common for price to "rebalance" and seek to come back to a previous imbalance area.
ICT highlights multiple imbalance formations:
Fair Value Gaps: A three candle formation where the candle shadows adjacent to the central candle do not overlap, this highlights a gap area.
Implied Fair Value Gaps: Unlike the fair value gap the implied fair value gap has candle shadows adjacent to the central candle overlapping. The gap area is constructed from the average between the respective shadow and the nearest extremity of their candle body.
Balanced Price Range: Balanced price ranges occur when a fair value gap overlaps a previous fair value gap, with the overlapping area resulting in the imbalance area.
Volume Imbalance: Volume imbalances highlight gaps between the opening price and closing price with existing trading activity (the low/high overlap the previous high/low).
Opening Gap: Unlike volume imbalances opening gaps highlight areas with no trading activity. The low/high does not reach previous high/low, highlighting a "void" area.
🔹 Displacement
Displacements are scenarios where price forms successive candles of the same sentiment (bullish/bearish) with large bodies and short shadows.
These can more technically be identified by positive auto correlation (a close to open change is more likely to be followed by a change of the same sign) as well as volatility clustering (large changes are followed by large changes).
Displacements can be the cause for the formation of imbalances as well as market structure, these can be caused by the full execution of a meta order.
🔹 Kill Zones
Killzones represent different time intervals that aims at offering optimal trade entries. Killzones include:
- New York Killzone (7:9 ET)
- London Open Killzone (2:5 ET)
- London Close Killzone (10:12 ET)
- Asian Killzone (20:00 ET)
🔶 Conclusion & Supplementary Material
This script aims to emulate how a trader would draw each of the covered features on their chart in the most precise representation to how it's actually taught by ICT directly.
There are many parallels between ICT Concepts and Smart Money Concepts that we released in 2022 which has a more general & simpler usage:
ICT Concepts, however, is more specifically aligned toward the community's interpretation of how to analyze price 'based on ICT', rather than displaying features to have a more classic interpretation for a technical analyst.

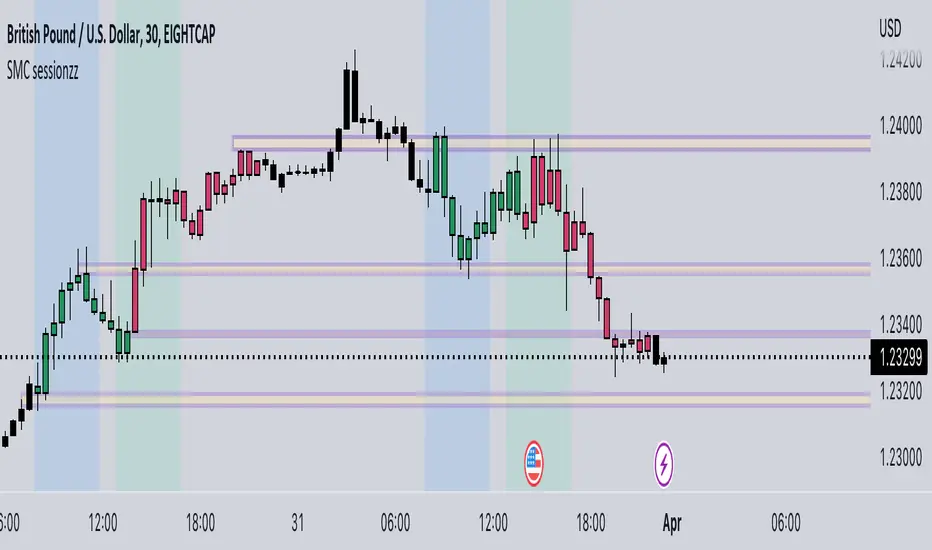
SMC sessionzz by JelleThe main function of this indicator is to make it easy to identify several smart money concepts (SMC) and ICT practices by using a single indicator. The functions themselves are not my original content, but rather a collection of several scripts with some tweaking, combined into a single indicator.
Main functions:
- Provides the ability to set bar color for London, New York and Asia sessions
- Provides the ability to set background color for London, New York and Asia sessions
- Provides the ability to indicate NY and GMT midnight on the chart by plotting vertical lines
- Provides several smart features to turn bar color and background color on/off depending on the timeframe
Usage example:
- Easily determine each session high and low by using the bar color feature
- Easily determine the daily high and low by using the vertical midnight lines
- Easily determine ICT kill zones by setting background color for each session
- Easily avoid clutter on your chart by using the timeframe filters
Strong Demands & Supplies + Liquidity | Zonas de Compra e VendaThis indicator is inspired on the Smart Money Concepts indicator (Credits to @LuxAlgo) and it was optimized to show only the most relevant demand and supply zones (premium) on every time frame - but on higher time frames (1H and above) the zones are more relevant and stronger, meaning these zones can handle the price for longer time.
I've added a new feature that includes the Liquidity lines in order to add more confluence and importance to a demand or supply zone: when a demand or supply zone has strong liquidity (like weekly or monthly) next to it means that zone can be a strongest price target.
- Blue Line: Daily liquidity
- Yellow Line: Weekly Liquidity
- Purple Line: Monthly Liquidity
Main Features:
- Displays the most relevant demand and supply zones (green and red boxes) and which ones are strong and weak
- Displays the relevant change of character and break of structure
- Displays the previous day highest price and previous day lowest price
- Display imbalances between sell and buy orders (purple boxes)
- Displays the liquidity areas with lines on each point.
- It works for Forex and Cryptocurrency as well.
Portuguese:
Este indicador é inspirado no Smart Money Concepts (Créditos para @LuxAlgo) e foi otimizado para mostrar apenas as zonas de procura e oferta mais relevantes em cada time frame - mas em time frames maiores as zonas são mais relevantes e mais fortes.
Adicionei uma nova funcionalidade que inclui as linhas de Liquidez de forma a adicionar mais confluência e importância a uma zona de procura ou oferta: quando uma zona de procura ou oferta tem forte liquidez (como semanal/linha amarela ou mensal/linha roxa) junto a ela significa que aquela zona pode ser um alvo de preço mais forte.
- Linha Azul: Liquidez diária
- Linha Amarela: Liquidez Semanal
- Linha Roxa: Liquidez Mensal
Principais características:
- Exibe as zonas de procura e oferta mais relevantes (zonas a verde e zonas a vermelho) e quais delas são fortes e fracas
- Exibe a mudança relevante de caráter e quebra de estrutura
- Exibe o preço mais alto do dia anterior e o preço mais baixo do dia anterior
- Exibe as imbalances entre as ordens de venda e compra (zonas a roxo)
- Exibe as zonas de maior liquidez através de linhas no gráfico
- Funciona tanto para Forex como para Criptomoedas

FluidTrades - SMC Lite
Price action and supply and demand is a key strategy use in trading. We wanted it to be easy and efficient for user to identify these zones, so the user can focus less on marking up charts and focus more on executing trades.
This indicator shows you supply and demand zones by using pivot points to show you the recent highs and the recent lows.
Features
This indicator includes some features relevant to SMC , these are highlighted below:
Full internal & swing market structure labeling in real-time
Swing Structure: Displays the swing structure labels & solid lines on the chart (BOS).
Supply & demand ( bullish & bearish )
Swing Points: Displays swing points labels on chart such as HH, HL, LH, LL.
Options to style the indicator to more easily display these concepts
White OB (supply): search for short opportunities
Blue OB (demand): search for long opportunities
Break of structure ( BOS )
For markets to move up and down a break in market structure must occur. A break in market structure occurs when the market begins to shift direction and break the previous HH and HL or HL and LL of the market. We also integrated the feature that you can see the BOS lines. In the indicator settings you can adjust the color of the label.
Settings
SwingHigh/Low Length: Allows the user to select Historical (default) or Present, which displays only recent data on the chart.
Supply/demand box width: Allows user to change the size of the supply and demand box
History to keep: allows the user to select how many most recent supply & demand box appear on the chart.
Visual settings
Show zig zag : allow user to see market patters within the market
Show price action labels: allow user to turn on/off the (swing points)
Supply box color : allow users to change the color of their supply box
Demand box color : allow users to change the color of their supply box
Bos label color : allow users to change the color of their BOS label
Poi label color : allow user to change the color of their POI label
Price action label : allow users to change the color of their swing points labels
Zig zag color : allow users to change the color of the zig/zag market patters
Warning
Never blindly take a trade on a supply/demand box - wait for a proper market structure to occur before considering a trade.
