Relative StrengthRelative Strength show the quotient (ratio) between a numerator (Your Security) and a common denominator (SPX, BTC, ...).
I inspired myself from already established indicators. But I've made my own because I had some issues with others.
Sometimes the moving average weren't fixed but where floating through the window.
Sometimes the colors (Up, Down) were inaccurate because the compiler didn't notice infinitesimal changes (0.0001 > 0.0002)
Thanks.
(The Relative Strength indicator is at the top of the chart.)
"spx"に関するスクリプトを検索

Ratio (Relative Strength) & EMAsRatio (Relative Strength) & EMAs
This indicator is used to compare the actual symbol with another one by calculating the ratio. EMA1 and EMA2 of the ration are shown as well. The idea is to choose an index like the NDX or SPX for comparison and to determine if the actual symbol outperforms the index or not - separate the wheat from the chaff. The rules are as follow:
When the calculation ratio (symbol divided ratio symbol) is above EMA1 and EMA1 is above EMA2) the background turs green. If not the background turn red.
Relative Strength ComparisonThis script plots the ratio between a ticker and the selected index. Currently, I have US equities indexes listed + BTC. It's a great way to check for relative strength, determine if absolute highs relative to the ratio are being made, etc.
Additionally, optional comparison of the RSI is included. I was just testing something out but figured I'd leave in here because why not. If you use this, enable the 1.0 line.
Script is a bit slow, will try to optimize eventually.

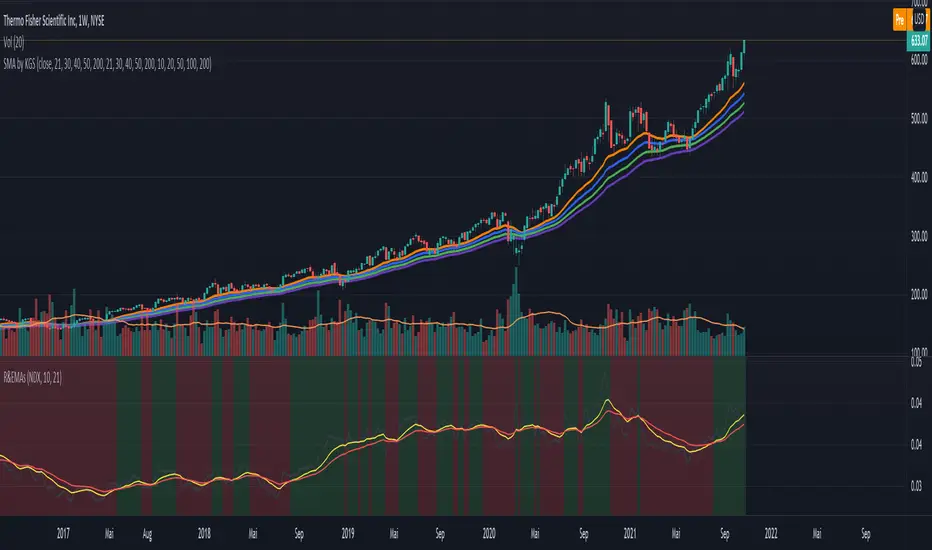
world stage indexThis is an indicator that expresses the ratio of "stage1" and "stage4" of world index.
40 symbols are as follows
(JAPAN, US, EUROPE, and CANADA)
OSE:NK2251!, DJ:DJI, NASDAQ:IXIC, SP:SPX, XETR:DAX, TVC:CAC40, TVC:UKX, TSX:TSX
(ASIA)
TVC:SHCOMP, SZSE:399001, TVC:HSI, TWSE:TAIEX, BSE:SENSEX, OANDA:SG30SGD, INDEX:KSI, SET:SET
(EUROPE)
INDEX:SX5E, INDEX:FTSEMIB, SIX:SMI, BME:IBC, EURONEXT:BEL20, TVC:AEX, OMXCOP:OMXC25, XETR:0Q5X
(Pacific Ocean)
ASX:XJO, TVC:NZ50G, IDX:COMPOSITE, FTSEMYX:FBMKLCI, BMFBOVESPA:IBOV, BMV:ME, BVL:SPBLPGPT, BYMA:IMV
(Eastern Europe & Middle East)
MOEX:IMOEX, GPW:WIG20, OMXHEX:OMXH25, OMXSTO:OMXS30, DFM:DFMGI, TADAWUL:TASI, OSE:GNRI, EGX:EGX30
The criteria are as follows:
EMA5≧EMA20≧EMA40 : Stage1
EMA5≦EMA20≦EMA40 : Stage4
A.The sum of Stage1 was multiplied by 2.5 and drawn on a scale of 0 to 100, with yellow area
B.The Sum of Stage4 was multiplied by 2.5 and drawn on a scale of 0 to 100, with blue area.
C. The ratio of A/B was multiplied by 2.5 and drawn on a scale of 0 to 100, with red lines.
This idea is from Kojirou Kousi.
40 symbols of this script are partially different from Kojiro kousi's idea.
But he said the difference isn't matter.
「小次郎講師指数」に着想を得た、世界40カ国の株価指数stage状態です。
参考文献は、小次郎講師著書「世界一わかりやすい投資の勝ち方」です。
小次郎講師とは一部異なるシンボルを採用していますが、
多少の違いは余り大した問題では無いと御本人から教わった事があります。
先進国に関してはおそらくほとんど同じだと思います。
stage1の合計の%を黄色、stage4の合計の%を青色、stage1の合計/stage4の合計の%を赤で表示しています。
雰囲気で分かればいいので、正確な数字までは表示しませんでした。
個人的には現状分析以外にも、プラクティス時に世界情勢を把握するのに重宝しています。

Improved Bollinger Swing Strategy Stock NasdaqThis is an improved bollinger band strategy adapted to Nasdaq Index/Stocks.
The new update include a multiple logic calculation BB adapted for long and short, together with a risk management using movement in %.
Rules for entry
For long we have a crossover between the close and the lower band from the bb
For long we have a crossover between the close and the upper band from the bb
Rules for exit
We exit when we either find a reverse condition, or if we hit the take profit/stop loss levels.
If you have any questions, let me know !

Stock trending strategy This is a long only strategy designed maily for stock markets and futures. In general it works best with 1h, however it can be optimized with other timeframes as well.
Components:
VWAP
MACD histogram
EMA 9
Rules for entry
Long :
For VWAP: close is above the vwap daily
EMA: close is above the moving average
MACD histogram is above 0
Short:
For VWAP: close is belowthe vwap daily
EMA: close is below the moving average
MACD histogram is below 0
Rules for exit
This strategy does not have any risk management inside. Instead it exits whenver it receives an opposite signal form the original one used for entry.
If you have any questions let me know !

Ichimoku with MACD/ CMF/ TSIThis is a very powerful trend strategy designed for markets such as stocks market , stock index and crypto.
For time frames I found out that 1h seems to do the trick.
Components:
Ichimoku full pack
MACD histogram
CMF oscillator
TSI oscillator
Rules for entry
Long :
For Ichimoku:Tenkan part of cloud is bigger than kijun, Chikou is above 0 , close of a candle is above the Senkou
MACD histogram is above 0
CMF oscillator is positive and bigger than 0.1
TSI oscillator is above 0
Short:
For Ichimoku:Tenkan part of cloud is smaller than kijun, Chikou is below 0 , close of a candle is belowthe Senkou
MACD histogram is below 0
CMF oscillator is negative and below -0.1
TSI oscillator is below 0
Rules for exit
This strategy does not have any risk management inside. Instead it exits whenver it receives an opposite signal form the original one used for entry.
If you have any questions let me know !

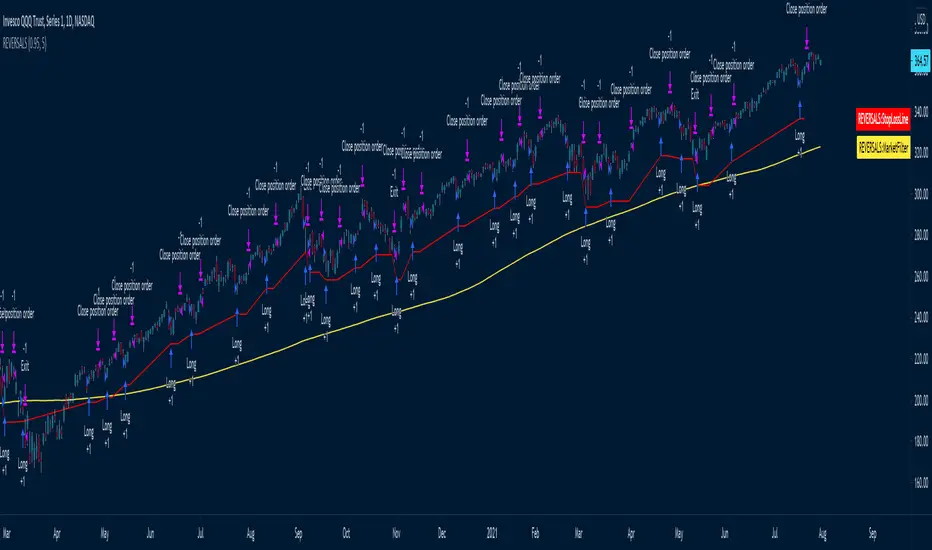
REVERSALS
The systems basically play reversals, it enters when the close is lower than its low of 5 bars ago to enter
It exits when the price is higher than the high of 5 days ago
Uses a 200 MA as a market filter, does not trade when the price is below its 200 Moving average
Uses a 5% stop, as per the red Stop Loss Line -- can be adjusted
The amount of bars it uses to look for reversals is set to 5 by default, but can be adjusted in settings.
Best to use on directional instruments where you know that the long term direction is up, for example:
TQQQ, SSO, SPX, SPY, or sector tickers -- but it would be best to include some more advanced filtering for sectors
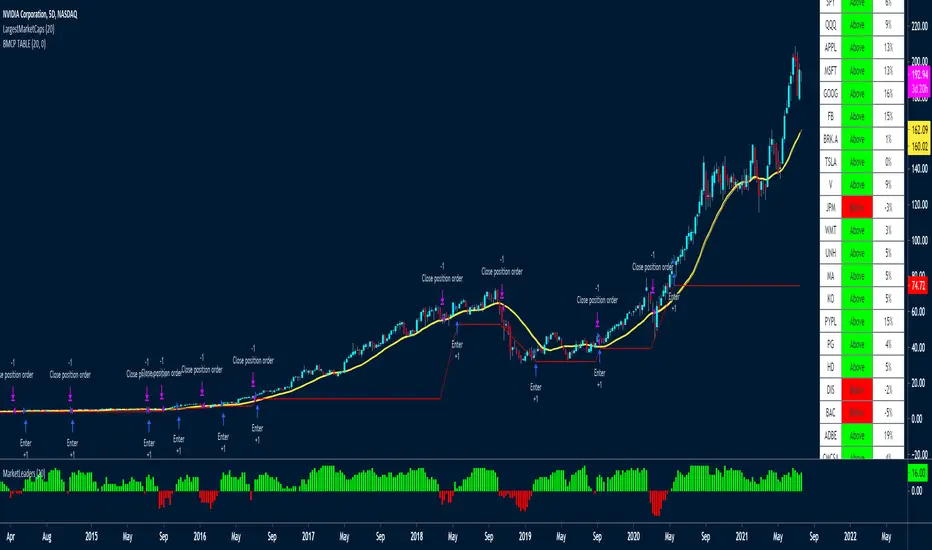
LargestMarketCapsThis trading system uses a MA to check if the LARGEST CAP stocks are above or below the MA.
You can see from the indicator below how well it manages to capture big moves.
It aggregates the data of all the tickers to create the histogram indicator at the bottom of the chart called MarketLeaders.
If a ticker is above its moving average, then the output will increase by +1 and -1 if a ticker is below its moving average.
This is a powerful system because it uses not only data from one stock but from the stocks that really affect the market big time. If those stocks don't do well, the market won't do well either.
Basically if all the market leaders are doing well, then this system will buy those 20 tickers and keep positions open until the MarketLeaders indicator crosses below 0 -- meaning red.
It also has a red stop loss line, with a wide 15% stop loss to keep us in the trades for the long term.
I've used a 5-day chart because I wanted fewer signals, but higher quality signals.
There are no profit targets, this exits when the indicator turns red -- meaning below 0 or if a position falls 15% in price.
The MA setting is adjustable, the default is 20
These are the tickers that the strategy and indicator currently looks at
The tickers will need to be updated every 6-12 months to remove and ad those who have dropped out of the largest 20 stocks.
It would be a good idea to create a watchlist and alerts for the Large Cap tickers so you can scroll through to see how the system performed on each ticker
"SPX"
"QQQ"
"AAPL"
"MSFT"
"GOOG"
"FB"
"BRK.A"
"TSLA"
"V"
"JPM"
"WMT"
"UNH"
"MA"
"KO"
"PYPL"
"PG"
"HD"
"DIS"
"BAC"
"ADBE"
"CMCSA"
"NKE"
RELATED IDEAS / Indicators
Market Leaders Ribbon
Market Leaders Large Performance Table
Financial Astrology Indexes ML Daily TrendDaily trend indicator based on financial astrology cycles detected with advanced machine learning techniques for some of the most important market indexes: DJI, UK100, SPX, IBC, IXIC, NI225, BANKNIFTY, NIFTY and GLD fund (not index) for Gold predictions. The daily price trend is forecasted through planets cycles (angular aspects, speed phases, declination zone), fast cycles are based on Moon, Mercury, Venus and Sun and Mid term cycles are based on Mars, Vesta and Ceres . The combination of all this cycles produce a daily price trend prediction that is encoded into a PineScript array using binary format "0 or 1" that represent sell and buy signals respectively. The indicator provides signals since 2021-01-01 to 2022-12-31, the past months signals purpose is to support backtesting of the indicator combined with other technical indicator entries like MAs, RSI or Stochastic . For future predictions besides 2022 a machine learning models re-train phase will be required.
When the signal moving average is increasing from 0 to 1 indicates an increase of buy force, when is decreasing from 1 to 0 indicates an increase in sell force, finally, when is sideways around the 0.4-0.6 area predicts a period of buy/sell forces equilibrium, traders indecision which result in a price congestion within a narrow price range.
We also have published same indicator for Crypto-Currencies research portfolio:
DISCLAIMER: This indicator is experimental and don’t provide financial or investment advice, the main purpose is to demonstrate the predictive power of financial astrology. Any allocation of funds following the documented machine learning model prediction is a high-risk endeavour and it’s the users responsibility to practice healthy risk management according to your situation.

Moving Average Color StrategyHello,
Strategy based on scrips "Moving Average Color Direction Detection" from Dreadblitz published on Aug 9, 2019.
You can chose MA type, length and reaction setting to adjust to time frame/ticker. Always seemed like RSI is ahead of actual price action
and just messing around with MA on the RSI .
Couple I found:
SPXS / SPXL 20M timeframe, MA 32 Reaction 2 (HullMA) 50% of equity so you dont lose everything :)
UVXY / SVXY 20M MA 32 Reaction 6 (HullMA) 50% of equity so you dont lose everything :)
APPLY to RSI , or any indicator really and play with Adjustments.
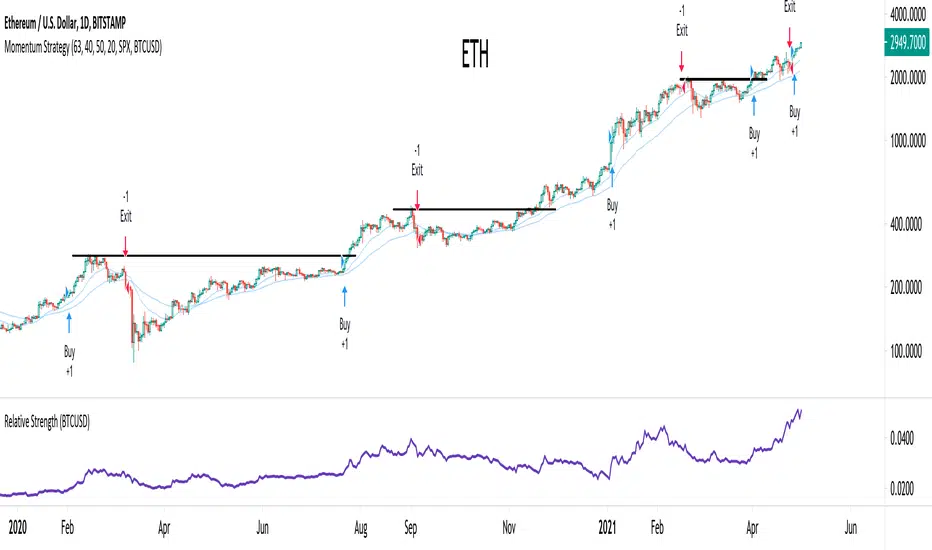
Momentum StrategyThis strategy uses momentum to determine when to enter and exit positions. The default settings are set to look for a new 63 day high (~1 trading quarter) and a new 40 day relative high. If the stock is trending above the 50 day moving average it is a candidate to be bought. Stops are triggered when price closes below the 20 day or 50 day EMAs depending on how well the stock is trending. A stop could also be triggered even if price continues to move up, but is breaking down on a relative basis to a benchmark either SPX or BTCUSD . The goal is to hold on to our winners for as long as possible and cut the losers as soon as possible. This will alow us to capture the majority of major trends while avoiding many large drawdown and relative losers.
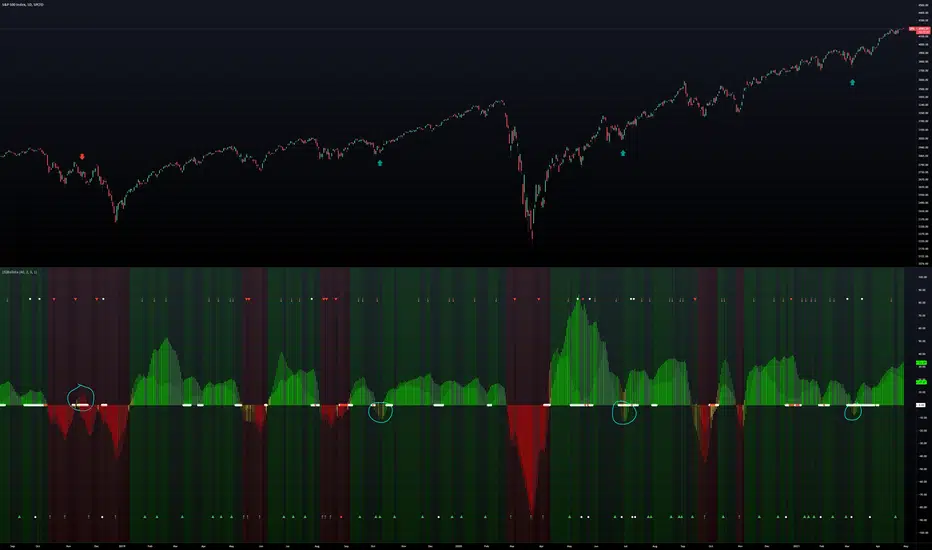
(JS) BallistaAlright so this is a script I made by combining two existing ones and making a really cool discovery that has proven very useful.
You'll notice that there are two separate oscillators that are laid on top of each other. The background oscillator is my "Tip-and-Dip" oscillator which you can see here (will refer to this as TnD from here), and the foreground oscillator from the Squeeze , which can be viewed here .
Initially I just wanted to see how they interacted with one another and compare them, but this led to some pretty interesting observations.
First let me go through the options real quick to get that out of the way, though it is mostly self-explanatory.
Lookback Period defines the amount of bars used for the TnD oscillator.
Smoothing Value smooths out the TnD output.
Standard Deviations is used to calculate the TnD formula.
Color Scheme is preset BG colors.
Using Dark Mode changes colors based on dark mode or not.
Squeeze Momentum On turns the Squeeze in the foreground off and on.
Arrows Off turns the arrows on the indicator off and on.
Now to explain the indicator a bit more. I have the default lookback period as 40 due to the Squeeze being 20, which makes the TnD oscillator the "slow" output with the Squeeze being the "fast" output.
Some initial observations were that when both the Squeeze and the TnD are moving in the direction, when the Squeeze is higher (uptrend) or lower (downtrend) it seems to indicate strength in the move. As the move loses steam you'll notice the Squeeze diverge from the TnD.
However, the most useful thing I discovered about the interaction between these two indicators is where the name for it came from. So if you aren't familiar with what a Ballista is, per Wikipedia, "The ballista... sometimes called bolt thrower, was an ancient missile weapon that launched either bolts or stones at a distant target." There are instances where the Squeeze seems to get ahead of itself and gets too far away from the TnD (which is the long term trend between the two). The key thing to look for is an "inverted squeeze" - this is when the squeeze oscillator ends up flipping against the TnD. When this occurs there is an extremely high probability that you'll see price shoot back the opposite way of the Squeeze.
I've been using this setup myself for about a year now and have been very satisfied with the results thusfar. I circled some examples on the SPX daily chart here to show you what I mean with the inverted Squeeze shooting back.
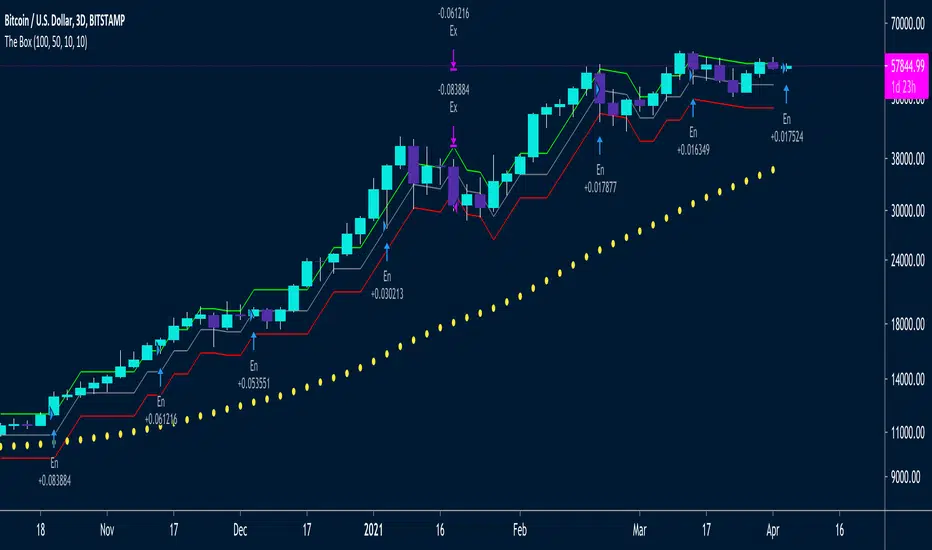
The Box Percent StratHi guys,
Version Zero (more work needed) of an idea I've been meaning to out into a strategy for a while. 🤯
This uses percent boxes🤔 instead of traditional indicators like RSI, MACD etc. 🤫
Takes the first close price of the series and creates a Top Band 10% up, buys if price reaches that level, and puts a stop on a Bot Band, 10% down
When the first trade is in profit by another 10%, it enters another trade and moves the stop of the first trade to breakeven ~ this way it only has one unit of risk at a time
/// Designed for LONG only on Daily, 2D or 3D Charts👌🏻
/// Uses fixed investment risk amount, meaning you're willing to lose that amount per trade
/// Limit buy to not overpay on entries
/// Idea Based on the Darvas system:
/// System only enters trades on strength, when prices equals of exceeds the green line
/// It ads onto the trades, but only *IF* the previous trade is in profit by the UpBoxSize percent size
/// The trailing stop loss is moved up, with the red line
/// A key idea is to only take one unit of risk at a time, meaning for a new add on trade to be taken, the previous trade should be in profit by the same box size as the new new trade's stop loss
/// This will keep adding trades again and again, and they will stop out at the same stop loss
/// Yellow Circles is an MA that filters out choppy areas -- this system only does really well on trending linear markets like: TQQQ, SSO, SPX, SPY
/// Base setting is 10% UpBox Size and 10% DnBox Size: 15% & 15% will be more accurate but fewer signals. 13% profit and 10% stop loss will give a higher risk to reward ratio
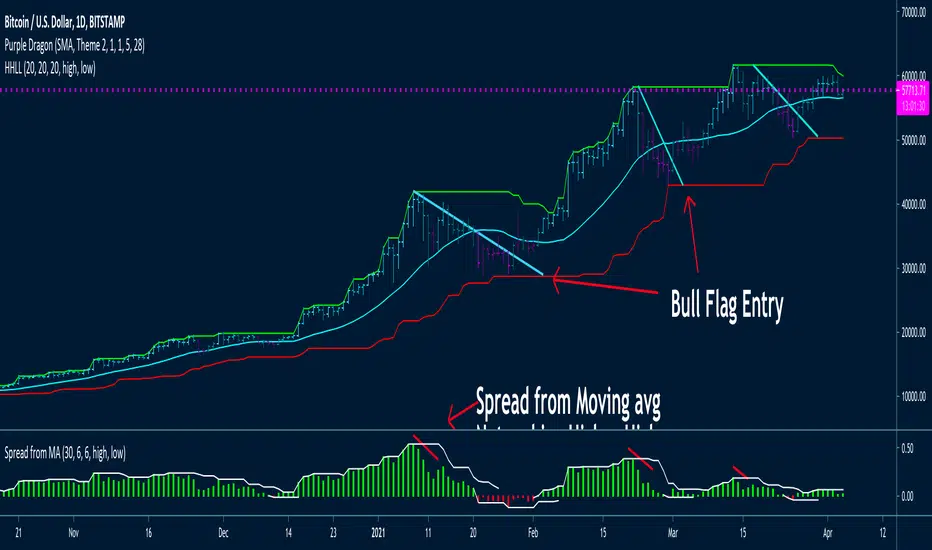
Highest High, Lowest LowHi guys,
This is a simple indicator that I think looks 😎
Basically just determines what the Highest High and the Lowest Low for X bars is.
As many of you know, moving averages are quite susceptible to noise ~ I like how how this really shows key inflection points on the chart and reduces trade signal chop which leads to losses.
Seems to be a good system to use with bull flags, on tickers like: BTCUSD, TQQQ, SSO, SPX etc.
Highest High and Lowest Low lookback periods can be changed to your needs
Have included a Moving Average
Will be coding a strategy for this in the next couple of weeks.
Have included in an alert system
Spread from Moving average indicator is available under my other scripts -- seems to indicate when price momentum is starting to stall by price not moving further away from the moving average. That would indicate good points to take profits, as price will likely do a mean reversion 😭
Altered True Strength Indicator (TSI) Reupload-
Altered TSI provides a slightly more volatile signal that demonstrates extremities in price action with greater success than standard TSI. In addition, I added bull/bear cross indicators (green/red) to make it easier to notice the crosses to save time when the market is moving fast (I couldn't find a regular TSI script with this addition). Finally, the signal also has overextension parameters (red and green lines)
I think this is best used on Intraday time frames as the signals respond to volatility very well and using Heikin Ashi candles, trend is more visual. In this particular example, I am showing SPY on the 3m time chart (my favorite short time frame) and the signal alone provided many opportunities for trades when using simple divergences and countering overextension direction when short term (blue) signal crosses either
In the first example (purple lines), SPY ramps but it was a dull signal given the signal strength flatlining- we would be looking for a short entry. When the signal fires, it provides a clean $1.50 move down in spy.
In the second example (orange), the blue signal provides a nice V shape (rebound signal) in which we are looking for a long entry. 390.50 is a strong SPY support in confluence with 2nd std dev VWAP extension, but disregarding that bull signal fires resulting in a 2 dollar move upwards. Exit is provided when blue line crosses green overextension.
In the third example (white), we are searching for a short entry at 392.5 resistance in confluence with divergently higher highs. Bear cross signal when fired and a significant cross is visible provides a $2.50 move to the downside with a potential exit provided when blue line crosses red overextension line in confluence with previous LOD area.
In the fourth example (green), we watch as the blue line provides a V pattern, we are searching for a long entry. If you didn't take a riskier long at 2nd std dev VWAP overextension with V recovery on blue line at red overextension for a ride to vwap, then you are looking for a secondary entry long as you wouldn't take the trade at resistance (vwap). Bullishly divergent lows provide this entry and the signal does not bear cross at all (but looking for significant crosses is more important even if the signal were to make a minor bear cross). Bullishly divergent double bottom provides a long entry to end of day with a nice clean signal for a $5.00 move until eod or when signal crosses overextension range.
Ideally, close to the money options or SPY/SPXS/SPXL are best used in the intraday time frame.
Again, this is not a standalone indicator but it's best used in conjunction with other indicators/trading strategies
Any questions feel free to comment

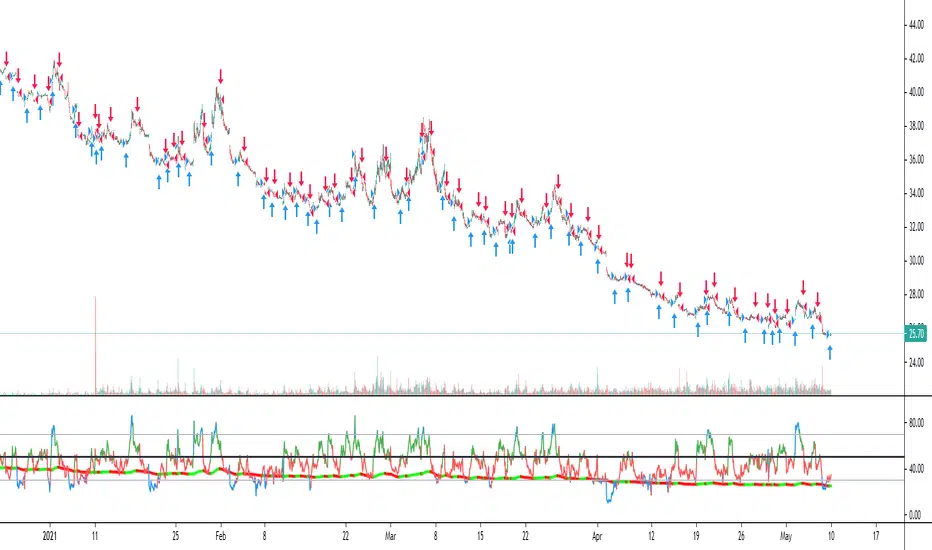
fake volume (normalized volatility)fake volume is not volume.
This is open source. check it my source.
there is no 'volume'
but look at that indicator, it really looks like volume.
- how is it possible?
i tried to calculate volatility. and this is it.
usually volatility = volume. so this is not a supprise.
- how is it helpful? (how can we use this?)
compare with real volume. sometime it make difference.
if "fake volume" is high, but real volme is not high,
and that means the price may not peak( nor bottom )
also it doesnt have influence.
you can use this indicator for something like score, index. that doesnt have volume.
ex: SPX, KOSPI
======================================
가짜볼륨은 볼륨이 아닙니다.
소스코드를 보면 알겠지만 볼륨을 사용하지 않았습니다.
하지만 굉장히 볼륨처럼 보입니다.
- 어째서 이게 가능한가?
저는 시장변동률을 수치화 하려고 했고 그걸 가시화했을 뿐 입니다.
일반적으로 시장변동률은 거래량과 같이 움직입니다.
그러니 딱히 놀라운 현상은 아닙니다.
- 이것을 어떻게 쓰나요? 어떤 도움이 되나요?
가끔 볼륨이랑 가짜볼륨이 다를 수가 있습니다.
만약 볼륨이 가짜볼륨보다 작다면, 그 지점은 중요 고점이나 저점이 아니겠지요.
(사실 이런 기법들을 연구하면서 만들어진 저의 지표 shock detector가 따로 있습니다.)
볼륨이 없는 인덱스나 점수 계열을 보실 때에 볼륨 대신에 아쉬운대로 이걸 사용해볼 수도 있겠습니다.

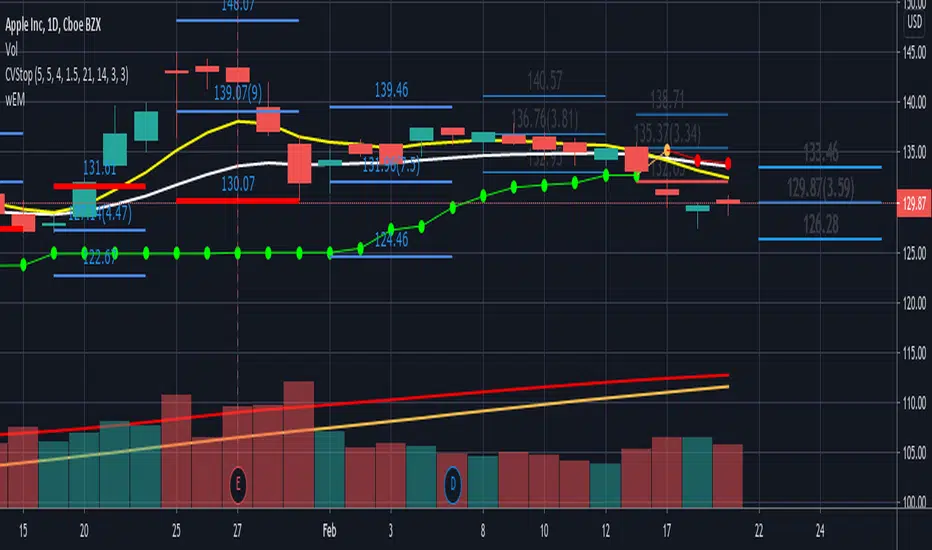
wEMPlotDescription:
Plots the Weekly Expected Move (wEM) using the following week's Option Chain ATM Call+Put ask price to determine the EM for the following week
The wEM is the options market pricing in the expected future volatility for the following week.
The wEM is the range that the underlying price will be contained during the week 68% of the time.
These levels can be used as targets for options or equity trades for either directional or non-directional trades.
The options market in the major indices, such as SPX, can drive the overall market's order flow and so the EM can provide
useful insight into the hedging levels being used by professionals and market markers.
As Trading View does not currently provide access to option chain data, the option chain expected move for an underlying has to be manually
entered each week, but the script provides an easy to use framework to enter the parameters for the next week.
These parameters are as follows:
eg.
t1_1 = timestamp(2021, 02, 08) <==== timestamp for the start of next week (yyyy,mm,dd)
t1_2 = timestamp(2021, 02, 12) <==== timestamp for the end of next week (yyyy,mm,dd)
plotwem("QQQ", 331.36, 5.86, t1_1, t1_2, 0, 0)
^^^^
plotwem(Symbol, Close-last-week, Expected Move next week, Next week start timestamp, Next week end timestamp, Highlight-Upper-EM, Highlight-Lower-EM)
Parameters are:
Symbol : Underlying chart symbol (aka ticker). Can be a symbol for equity, future or index.
Close-last-week: Closing price at the end of last week.
Expected Move next week: The Expected Move for next week: Calculated from next week's Option Chain ATM Call+Put ask price
Next week start timestamp : Timestamp for the start of next week
Next week end timestamp : Timestamp for the end of next week
Highlight-Upper-EM : highlight upper expected move level. Set to 1 to highlight with red color. Set to 0 is no highlight.
Highlight-Lower-EM : highlight lower expected move level. Set to 1 to highlight with red color. Set to 0 is no highlight.
The highlight parameters can be updated at any point to indicate that the underlying has either touched the EM level or breached the level.
The highlights can be used to visually determine periods of market instability which can provide insight into applicable strategies for the market conditions.
US10Y / DXY - 10 Yield correlated This oscillator tracks the US and US10Y , Script is based in SPX/US oscillator by @someguy


McClellan Froth IndexFrom the article "Extreme Point for Nasdaq Volume" by Tom McClellan:
"We are seeing some wild numbers for Nasdaq share volume lately, much bigger than anything in recent years. This points to a speculative blowoff underway.
For many years, analysts have looked at the ratio of Nasdaq to NYSE volume as an indicator of tops and bottoms for stock prices. This week’s chart shows a 10-day simple moving average of that daily ratio. The current reading is the highest since all the way back in 2001, when the stock market was in the process of violently unwinding the 2000 Internet bubble peak. If you look closely at the chart, you can see that other lesser peaks in this 10-day MA have been associated with meaningful price tops. This reading is in a whole separate category.
Part of what is happening is an upsurge in the trading of stocks that have a low share price. Here is a recent tally of the most active stocks on the Nasdaq, as published by Marketwatch.
Nasdaq most active list
Notice how many of these are priced in the single digits, and many even below $1. So to trade any meaningful dollar amount in these stocks means trading more share volume, due to those low prices.
A lot of investors, especially new investors, hold the funny belief that a low numerical share price means that a stock is “cheap”. That used to be true, back in the 1800s and early 1900s when companies issued stock at a “par” value of $100. That custom was also part of why the NYSE would delist a stock if its share price fell below $5, because that meant it had fallen so far from its par value that it was not considered a reasonable investment.
But nowadays, companies can pick their own IPO prices at fanciful numerical values. So the message of a low-priced stock being a “cheap” stock is no longer a valid one. But that does not stop the Robinhood crowd from playing around in that segment of the market.
And this is a big part of why the Nasdaq/NYSE volume ratio works as an indicator of froth, or fear. The extent to which traders and investors decide it is a good idea to speculate on the low priced stocks, and to jack up their trading volume, can be an indication of frothy bullish sentiment."
The volume values on Tradingview seem to be slightly different than the values in Tom's version, but the script still demonstrates the relationship between Nasdaq volume and NYSE volume.
It also includes the option to use (Nasdaq Options Volume / SPX Options Volume).
*Includes an option for repainting -- default value is true, meaning the script will repaint the current bar.
False = Not Repainting = Value for the current bar is not repainted, but all past values are offset by 1 bar.
True = Repainting = Value for the current bar is repainted, but all past values are correct and not offset by 1 bar.
In both cases, all of the historical values are correct, it is just a matter of whether you prefer the current bar to be realistically painted and the historical bars offset by 1, or the current bar to be repainted and the historical data to match their respective price bars.
As explained by TradingView,`f_security()` is for coders who want to offer their users a repainting/no-repainting version of the HTF data.

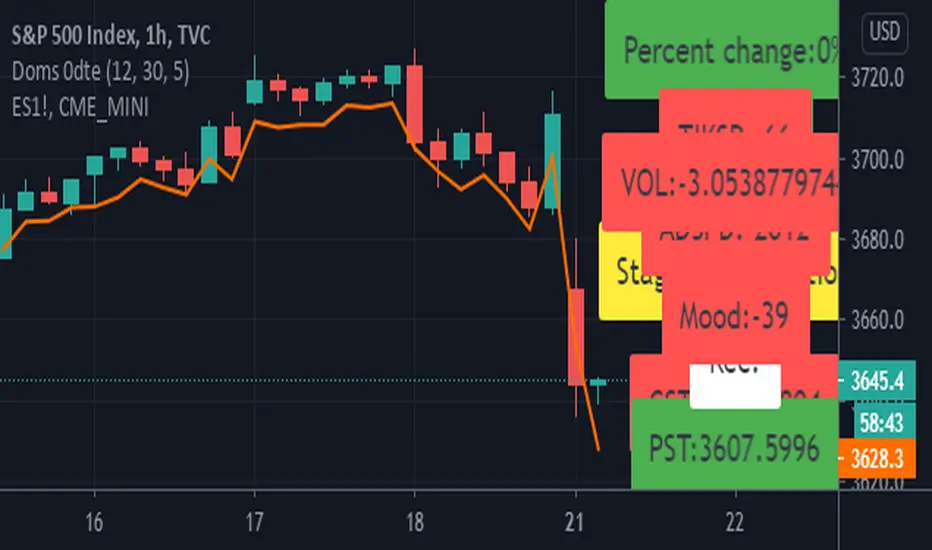
Doms 0dte/hassan conversion v2 Hello Guys
This is a reupload!
The 0dte is for options trading and is used for the main 1 to 0 odte strategy!
It uses volume, sector and tik analysis in order to give an understanding of looking which way to play.
The next version will look at correlations between the es! Feel free to point out bugs and reach out as I want this to grow into something way stronger!