Zero-Lag MA Trend FollowingScript Name: Zero-Lag MA Trend Following Auto-Trading
Purpose and Unique Features:
This script is designed to implement a trend-following auto-trading strategy by combining the Zero-Lag Moving Average (ZLMA), Exponential Moving Average (EMA), and ATR Bands. To differentiate it from similar scripts, the following key aspects are emphasized:
Zero-Lag MA (ZLMA):
Responds quickly to price changes, minimizing lag compared to EMA.
Detects crossovers with EMA and generates Diamond Signals to indicate trend reversals.
ATR Bands:
Measures market volatility to set stop-loss levels.
Helps optimize entry points and manage risk effectively.
Diamond Signals:
A vital visual cue indicating the early stages of trend reversals.
Green diamonds signal an uptrend, while red diamonds signal a downtrend.
Each component plays a distinct role, working synergistically to enhance trend detection and risk management. This system doesn’t merely combine indicators but optimizes them for comprehensive trend-following and risk control.
Usage Instructions:
Entry Conditions:
Long Entry:
Enter when a green Diamond Signal appears (ZLMA crosses above EMA).
Short Entry:
Enter when a red Diamond Signal appears (ZLMA crosses below EMA).
Exit Conditions:
Stop Loss:
Set at the lower boundary of the ATR band for BUY or the upper boundary for SELL at entry.
Take Profit:
Automatically executed based on a 1:2 risk-reward ratio.
Account Size: ¥100,0000
Commissions and Slippage: Assumed commission of 90 pips per trade and slippage of 1 pip.
Risk per Trade: 10% of account equity (adjustable based on risk tolerance).
Improvements and Original Features:
While based on open-source code, this script incorporates the following critical enhancements:
Diamond Signals from ZLMA and EMA Integration:
Improves entry accuracy with a proprietary trend detection strategy.
ATR Bands Utilization:
Adds a volatility-based risk management function.
Optimized Visual Entry Signals:
Includes plotted triangles (▲, ▼) to clearly indicate trend-following entry points.
Credits:
This script builds upon indicators developed by ChartPrime, whose innovative approach and insights have enabled a more advanced trend-following strategy. We extend our gratitude for their foundational work.
Additionally, it integrates technical methods based on Zero-Lag Moving Average (ZLMA), EMA, and ATR Bands, leveraging insights from the trading community.
Chart Display Options:
The script offers options to toggle the visual signals (Diamond Signals, trend lines, and entry points) on or off, keeping the chart clean while maximizing analytical efficiency.
Disclaimer:
This script is provided for educational purposes and past performance does not guarantee future results.
Use it responsibly with proper risk management.
"the script"に関するスクリプトを検索

Dual Chain StrategyDual Chain Strategy - Technical Overview
How It Works:
The Dual Chain Strategy is a unique approach to trading that utilizes Exponential Moving Averages (EMAs) across different timeframes, creating two distinct "chains" of trading signals. These chains can work independently or together, capturing both long-term trends and short-term price movements.
Chain 1 (Longer-Term Focus):
Entry Signal: The entry signal for Chain 1 is generated when the closing price crosses above the EMA calculated on a weekly timeframe. This suggests the start of a bullish trend and prompts a long position.
bullishChain1 = enableChain1 and ta.crossover(src1, entryEMA1)
Exit Signal: The exit signal is triggered when the closing price crosses below the EMA on a daily timeframe, indicating a potential bearish reversal.
exitLongChain1 = enableChain1 and ta.crossunder(src1, exitEMA1)
Parameters: Chain 1's EMA length is set to 10 periods by default, with the flexibility for user adjustment to match various trading scenarios.
Chain 2 (Shorter-Term Focus):
Entry Signal: Chain 2 generates an entry signal when the closing price crosses above the EMA on a 12-hour timeframe. This setup is designed to capture quicker, shorter-term movements.
bullishChain2 = enableChain2 and ta.crossover(src2, entryEMA2)
Exit Signal: The exit signal occurs when the closing price falls below the EMA on a 9-hour timeframe, indicating the end of the shorter-term trend.
exitLongChain2 = enableChain2 and ta.crossunder(src2, exitEMA2)
Parameters: Chain 2's EMA length is set to 9 periods by default, and can be customized to better align with specific market conditions or trading strategies.
Key Features:
Dual EMA Chains: The strategy's originality shines through its dual-chain configuration, allowing traders to monitor and react to both long-term and short-term market trends. This approach is particularly powerful as it combines the strengths of trend-following with the agility of momentum trading.
Timeframe Flexibility: Users can modify the timeframes for both chains, ensuring the strategy can be tailored to different market conditions and individual trading styles. This flexibility makes it versatile for various assets and trading environments.
Independent Trade Logic: Each chain operates independently, with its own set of entry and exit rules. This allows for simultaneous or separate execution of trades based on the signals from either or both chains, providing a robust trading system that can handle different market phases.
Backtesting Period: The strategy includes a configurable backtesting period, enabling thorough performance assessment over a historical range. This feature is crucial for understanding how the strategy would have performed under different market conditions.
time_cond = time >= startDate and time <= finishDate
What It Does:
The Dual Chain Strategy offers traders a distinctive trading tool that merges two separate EMA-based systems into one cohesive framework. By integrating both long-term and short-term perspectives, the strategy enhances the ability to adapt to changing market conditions. The originality of this script lies in its innovative dual-chain design, providing traders with a unique edge by allowing them to capitalize on both significant trends and smaller, faster price movements.
Whether you aim to capture extended market trends or take advantage of more immediate price action, the Dual Chain Strategy provides a comprehensive solution with a high degree of customization and strategic depth. Its flexibility and originality make it a valuable tool for traders seeking to refine their approach to market analysis and execution.
How to Use the Dual Chain Strategy
Step 1: Access the Strategy
Add the Script: Start by adding the Dual Chain Strategy to your TradingView chart. You can do this by searching for the script by name or using the link provided.
Select the Asset: Apply the strategy to your preferred trading pair or asset, such as #BTCUSD, to see how it performs.
Step 2: Configure the Settings
Enable/Disable Chains:
The strategy is designed with two independent chains. You can choose to enable or disable each chain depending on your trading style and the market conditions.
enableChain1 = input.bool(true, title='Enable Chain 1')
enableChain2 = input.bool(true, title='Enable Chain 2')
By default, both chains are enabled. If you prefer to focus only on longer-term trends, you might disable Chain 2, or vice versa if you prefer shorter-term trades.
Set EMA Lengths:
Adjust the EMA lengths for each chain to match your trading preferences.
Chain 1: The default EMA length is 10 periods. This chain uses a weekly timeframe for entry signals and a daily timeframe for exits.
len1 = input.int(10, minval=1, title='Length Chain 1 EMA', group="Chain 1")
Chain 2: The default EMA length is 9 periods. This chain uses a 12-hour timeframe for entries and a 9-hour timeframe for exits.
len2 = input.int(9, minval=1, title='Length Chain 2 EMA', group="Chain 2")
Customize Timeframes:
You can customize the timeframes used for entry and exit signals for both chains.
Chain 1:
Entry Timeframe: Weekly
Exit Timeframe: Daily
tf1_entry = input.timeframe("W", title='Chain 1 Entry Timeframe', group="Chain 1")
tf1_exit = input.timeframe("D", title='Chain 1 Exit Timeframe', group="Chain 1")
Chain 2:
Entry Timeframe: 12 Hours
Exit Timeframe: 9 Hours
tf2_entry = input.timeframe("720", title='Chain 2 Entry Timeframe (12H)', group="Chain 2")
tf2_exit = input.timeframe("540", title='Chain 2 Exit Timeframe (9H)', group="Chain 2")
Set the Backtesting Period:
Define the period over which you want to backtest the strategy. This allows you to see how the strategy would have performed historically.
startDate = input.time(timestamp('2015-07-27'), title="StartDate")
finishDate = input.time(timestamp('2026-01-01'), title="FinishDate")
Step 3: Analyze the Signals
Understand the Entry and Exit Signals:
Buy Signals: When the price crosses above the entry EMA, the strategy generates a buy signal.
bullishChain1 = enableChain1 and ta.crossover(src1, entryEMA1)
Sell Signals: When the price crosses below the exit EMA, the strategy generates a sell signal.
bearishChain2 = enableChain2 and ta.crossunder(src2, entryEMA2)
Review the Visual Indicators:
The strategy plots buy and sell signals on the chart with labels for easy identification:
BUY C1/C2 for buy signals from Chain 1 and Chain 2.
SELL C1/C2 for sell signals from Chain 1 and Chain 2.
This visual aid helps you quickly understand when and why trades are being executed.
Step 4: Optimize the Strategy
Backtest Results:
Review the strategy’s performance over the backtesting period. Look at key metrics like net profit, drawdown, and trade statistics to evaluate its effectiveness.
Adjust the EMA lengths, timeframes, and other settings to see how changes affect the strategy’s performance.
Customize for Live Trading:
Once satisfied with the backtest results, you can apply the strategy settings to live trading. Remember to continuously monitor and adjust as needed based on market conditions.
Step 5: Implement Risk Management
Use Realistic Position Sizing:
Keep your risk exposure per trade within a comfortable range, typically between 1-2% of your trading capital.
Set Alerts:
Set up alerts for buy and sell signals, so you don’t miss trading opportunities.
Paper Trade First:
Consider running the strategy in a paper trading account to understand its behavior in real market conditions before committing real capital.
This dual-layered approach offers a distinct advantage: it enables the strategy to adapt to varying market conditions by capturing both broad trends and immediate price action without one chain's activity impacting the other's decision-making process. The independence of these chains in executing transactions adds a level of sophistication and flexibility that is rarely seen in more conventional trading systems, making the Dual Chain Strategy not just unique, but a powerful tool for traders seeking to navigate complex market environments.

Pullback_Power [JackTz]Welcome to Pullback_Power
Pullback_Power is a scalping strategy designed to capitalize on market retracements while incorporating unique dynamic features to enhance profitability.
Calculation
Pullback_Power purely uses moving averages to calculate both entry and exits. Exits can also be set to fixed percentages for both take profit and stop loss.
How the Strategy Works
Statistics show that markets normally do a recovery after each drop. Crypto markets can easily drop up to 20% within a few hours and then do a complete or partial recovery. Pullback_Power utilizes this known pattern alongside pyramiding. The strategy aims to catch one or more entries when the price drops, hoping to make profits when the market recovers from the drop. The fixed take profit and stop loss can be used to define your risk management, while the dynamic exit opportunity is riskier but provides the ability to stay in the trade longer while it recovers. Pullback_Power can make up to four entries. This means it utilizes pyramiding to spread out the entry points, but every exit is a full exit. It is not possible to partially exit.
Utility
Pullback_Power is a scalping strategy suitable for traders who operate with small trades and don't want to stay in the market for too long. Pullback_Power offers precise signals with no repainting. The strategy thrives in volatility, so crypto pairs might yield the best results, although this strategy can be adapted to work on all pairs and markets.
How to Automate It
Pullback_Power utilizes the standard placeholders of strategies on TradingView. This enables the trader to add every data point into a webhook, making it fully flexible to suit every trader's needs. To automate, create an alert, set the webhook URL, and add the JSON body needed for the webhook. An example of a simple JSON webhook with some of the standard strategy placeholders:
{
"side": "{{strategy.order.action}}",
"symbol": "{{ticker}}",
"amount": "{{strategy.order.contracts}}"
}
Read about all the standard placeholders that you can use here: TradingView - Standard strategy placeholders
Originality
Pullback_Power is unique in its ability to create precise signals without repainting while maintaining a solid approach to the pullback strategy. Its simplicity not only makes the strategy easy to use and understand but also highly effective. The simplicity reduces inputs, eliminating overfitting and limits each input to avoid incorrect usage. Many times, default settings are enough to achieve good backtesting results on almost all pairs available. Pullback_Power also differs from many other strategies by its solid code, which enhances performance and provides more reliable backtesting. The clean code increases the resilience and precision of the entries, making it less prone to errors.
Many pullback/scalping strategies normally only works on specific scopes of timeframes or pairs. Pullback_Power can easily be adapted to work on almost every scenario. The biggest change needed is the length of the moving average. The lower the timeframe, the higher a length is needed for proper results. I.e. on a 2H timeframe a length of 3 can yield good results. On a 5min timeframe the length might need to be as high as 70.
How to Use
To use Pullback_Power, add the script to your trading chart. By default, Pullback_Power opens four orders to optimize trade opportunities with a default fee value set at 0.1%. You can change these default settings in the Settings window under the Properties tab. To tailor Pullback_Power to your individual trading style, navigate to the Settings under the Input tab. Here you can configure various inputs to fit your trading style.
- Backtest settings , Start Date:
Defines the date of when the calculation starts. Use this to set the date of when the first trade could potentially emit.
- Backtest settings , End Date:
Defines the date of when the calculation ends. If there are any open trades after this date the close calculations are still live. It only makes sure that new orders cannot be opened after this date.
- Backtest settings , Only trade on weekdays:
This is a toggle you can enable or disable. If enabled it only allows new entries to happen during the normal week days, meaning Monday, Tuesday, Wednesday, Thursday and Friday.
Disable this to enable the script to open trades on all 7 days of the week.
- Open settings , Use dynamic long positions:
This toggle allows you to enable or disable the pullback level calculations after first trade.
If enabled, the calculations of level 2, 3 and 4 continues to happen after each bar, making the levels follow the price with the moving averages calculations.
If disabled, the calculations of the levels stop after the first trade. This means that the levels calculation at the point of the first trade stay fixed until all trades are closed.
You can see the difference of the green lines on the chart when you toggle this flag.
- Open settings , Data type:
This is the bar data used for the moving average calculation when opening trades. The possible data types are Open, High, Low, Close, HL2, HLC3, OHLC4, OC2 and HC2.
- Open settings , Source type:
This is the source used to calculate the moving average. The types available are: SMA, PCMA, EMA, WMA, DEMA, ZLEMA and HMA.
- Open settings , Length:
This is the length used for the moving average calculations. 3 means it takes the last 3 bars of historical data for the calculation.
- Open settings , Offset:
This defines if the calculation should use an offset for the historical data. This does not use a look-forward feature, but a look-backward feature. To prevent any possible repaints the offset can only be positive, not negative.
For instance, if the length is 3 and the offset is 0 the calculation is made from the last 3 bars, making it bar1, bar2 and bar3. If the length is 3 and the offset is 1 the calculation is made from bar2, bar3, and bar4 – offsetting the calculation by 1 bar.
- Leverage settings , Leverage liquidation (1-125):
The script itself does not handle any custom leverage calculation – this must be done in the Properties tabs and increasing the order size.
This setting is made to test a possible liquidation event if using leverage.
By setting this to higher than 1, a red line is visible after the first trade on the chart. This indicates the liquidation price.
If this setting is set to 25, the script will calculate the liquidation price from a x25 leverage. If this price is hit, the scripts stops emitting any orders and the background turns red.
You can use this to test if your settings could handle a certain level of leverage.
- Pullback settings , Pullback 1, 2, 3 and 4:
Each of these settings defines the entry price of each pullback level. If Pullback 1 is set to -6 it means that the moving average calculation should be 6% lower than the actual price.
The same logic applies to Pullback 2, 3 and 4.
Setting any level to 0 will disable the level – eliminating any orders to emit on that level.
This can be used to change the level of pyramiding down from 4 if needed.
If you do this, remember to also change the order size and the pyramiding value in the Properties tab accordingly.
- Close settings , Use dynamic TP and SL:
If enabled, script will exit all orders using the same but separate algorithm for moving averages. This enables the user to define if you want the orders to be closed if the price level of this moving average is hit. The price level for this calculation is visible on the chart by the blue line.
Although you can change the length and offset, as described underneath, this calculation uses the same data and source type defined in the Open settings area.
- Close settings , Length, Close:
This is the length used for the closing moving average calculations. 3 means it takes the last 3 bars of historical data for the calculation.
- Close settings , Offset, Close:
This defines if the calculation for the closing moving average should use an offset for the historical data. Just as the offset used for opening order, this does not use a look-forward feature, but a look-backward feature. To prevent any possible repaints the offset can only be positive, not negative.
For instance, if the length is 3 and the offset is 0 the calculation is made from the last 3 bars, making it bar1, bar2 and bar3. If the length is 3 and the offset is 1 the calculation is made from bar2, bar3, and bar4 – offsetting the calculation by 1 bar.
- Close settings , Use TakeProfit:
This toggle enables/disables a fixed take profit percentage.
- Close settings , TP %:
This sets the wanted % to reach on a take profit. This setting is ignored if the toggle above is disabled.
- Close settings , Use StopLoss:
This toggle enables/disables a fixed stop loss percentage.
- Close settings , SL %:
This sets the wanted % to reach on a stop loss. This setting is ignored if the toggle above is disabled.
Exit on Same Bar as Entry
By default, the script doesn't emit any exit orders on the same bar as the first entry order. Enable "Recalculation: After order is filled" to change this behavior.
Troubleshooting
While Pullback_Power is designed to provide reliable trading signals, you may encounter rare issues. One such issue could be receiving an error message stating "can't open orders with 0 or negative qty." If you encounter this error, it is likely due to specific conditions on the selected timeframe. To resolve this issue, change the timeframe on your trading chart.
Underlying Principles and Value Proposition
Pullback_Power leverages moving averages and volatility behavior to identify market retracements and capitalize on them. The strategy is rooted in the understanding that markets often experience temporary reversals or "pullbacks" before resuming their primary trend. By identifying these pullbacks and entering trades at opportune moments, Pullback_Power aims to capture quick profits from short-term market movements.
The dynamic and fixed calculations of Take Profit (TP) and Stop Loss (SL) levels enhances risk management, ensuring that potential losses are controlled while allowing room for profits to grow. The adaptive approach using the moving averages considers current market conditions, making the strategy flexible and responsive to changing volatility.
Moreover, Pullback_Power's non-repainting nature ensures the reliability of its signals, eliminating hindsight bias and providing traders with actionable insights based on real-time market data.
The strategy's simplicity and effectiveness make it accessible for traders of all experience levels. Whether you're a beginner looking to start scalping or an experienced trader seeking to diversify your trading approach, Pullback_Power offers a balanced blend of simplicity and sophistication to help you navigate the markets with confidence.
By focusing on clear, transparent principles and offering practical tools for risk management, Pullback_Power aims to provide tangible value to traders, empowering them to make informed decisions and optimize their trading outcomes.
Thank you for choosing Pullback_Power. I wish you successful trading!

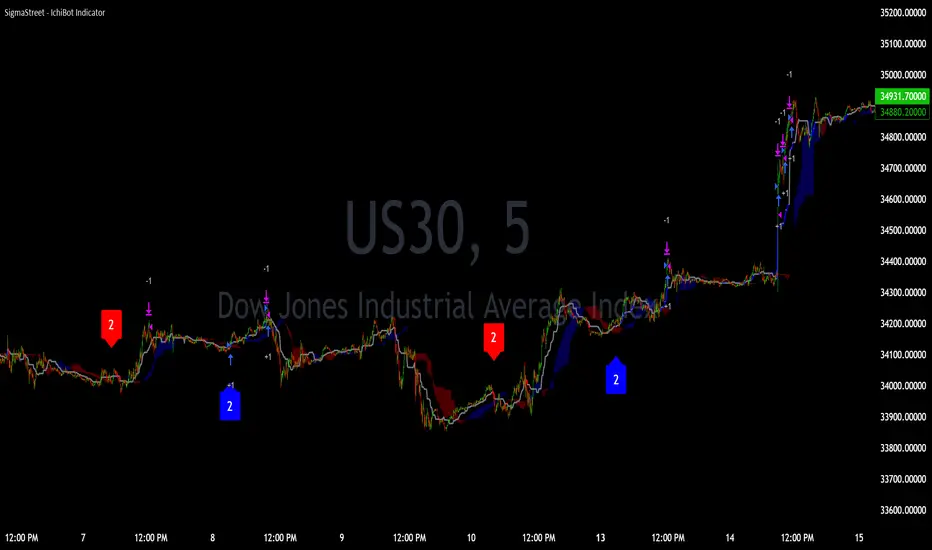
IchiBot - [SigmaStreet]
The IchiBot Indicator has been used to develop automated trading systems. It leverages the open-source Ichimoku framework provided by Trading View, to enable users to creatively generate over 1 trillion different combinations of trading conditions with the use of multiple timeframes to create unique “signal labels” that can be used to create custom strategies or provide in depth market analysis. At the end of this description, I have provided an example of input settings for a simple scalping strategy that I have back tested on US30 on the 5 minute timeframe.
Overview of the Settings:
The visuals section includes an option to show or hide certain parts of the indicator and change the size of the signal labels plotted on the chart.
Next to the “Signal color on baseline/candles” section, you can choose if you want to see additional signals generations from the most previous plotted label on a color changing baseline, or color changing candles. A color change from gray to blue/red indicate that the conditions from the most previously plotted signal label have been met again.
The next 5 sections are all related to the strategy portion of the indicator, used to aid in the back testing process. These sections are titled “Stop loss”, “Take Profit”, “Trail Stop”, “Trade Settings” and “Trade Schedule”.
The Stop Loss section includes an option to choose between value of “pts”, “atr” (average true range) or “None”. The stop loss value in “pts” is simply a specified number of points or pips from the current entry price of a trade that are input in the “SL” section. If the stop loss type is “atr” the “SL” section is not used and the value is calculated and displaced from the current entry price of a trade based on the atr period multiplied by the atr multiplier.
The take profit section is based on the same logic as the stop loss.
The Trail Stop section includes an option to choose between values “pts” or “None”. If the Trail Stop value is “pts”, a trailing stop loss is activated if a trade moves a point value into profit that exceeds the value of the “Trail Activation”. If the Trail Offset type is “pts”, the trailing stop loss is placed a point value away from the current price that is equal to the “Trail Offset” value.
The trade settings section has two options to either prevent or allow trade reversals and prevent or allow only 1 trade per signal label.
If the “Don’t allow trade reversals” is on, then a currently active trade can not be cancelled by an opposite trade signal. It can only be cancelled by the exit logic selected in the above sections. If the “One trade per signal” is selected, the strategy will only enter a trade if the most recent signal label is different from the last signal label where a trade was entered, or if the most recent signal label is in the opposite direction of the most recent signal label where a trade was entered.
The trade schedule section includes an option to only generate signal labels during the specified time. You can choose between 24/7 which will generate signals without any time restriction, or you can choose a custom time which is based on the America / New York time zone.
The timeframe settings section includes an option to choose “single” or “multiple” timeframes, as well as an option to show every signal label combination (“all”), or only the signal labels with the highest numerical value (“absolute”).
If you select “single” next to “timeframe”, the indicator will show you labels based on trade conditions met from only 1 selected timeframe. If you select “multiple” next to “timeframe”, the indicator is designed to return signal labels based on trade conditions that have been met on at least 2 different timeframes.
If you select “multiple” and “use current timeframe”, the indicator will include labels that always include a minimum of 2 timeframes where 1 timeframe is always the current timeframe. If you unselect the “use current timeframe”, the indicator will include labels with a minimum of 2 timeframes.
If you select “multiple” next to “timeframe” and “all” next to “Show all/absolute labels”, the indicator will show you every possible combination of labels that vary from trade conditions met on a minimum of 2 timeframes, to the maximum number of timeframes selected.
If you select “multiple” next to “timeframe” and “absolute” next to “Show all/absolute labels”, the indicator will only show you labels where the numerical value is equivalent to the maximum number of timeframes selected.
Each signal label provides a number which refers to the number of timeframes used to generate the label, offering insights briefly. Hover over a label to reveal detailed tooltip information that details the exact timeframes used to generate each label.
You can choose all from “Show all/absolute labels” to see every possible combination of trade signals or “absolute” to only see labels that have the highest possible numerical value. Absolute means that every condition selected from every timeframe was calculated to be true at the same time on the same candle.
The next 8 sections are “Current timeframe trade conditions”, “1-minute timeframe trade conditions”, “5-minute timeframe trade conditions”, “15-minute timeframe trade conditions”, “30-minute timeframe trade conditions”, “1-hour timeframe trade conditions”, “4-hour timeframe trade conditions”, “Daily timeframe trade conditions”.
These sections include the same 10 trade conditions, that can be used independently, or in combination with each other. This brings the total number of trade conditions to 70.
The final section includes a standard option to adjust the current Ichimoku values.
Understanding the Calculations:
The term “future” refers to a value that is calculated 26 candles to the right of the most recent closing price.
The term “current” refers to a value that is calculated on the most recent closing price.
The term “past” refers to a value that is calculated 26 candles to the left of the most recent closing price.
Bullish is referred to as “blue” and bearish is referred to as “red”.
Buy Signals:
1. The current closing price is greater than the current cloud value.
2. The future cloud is blue.
3. The current closing price is greater than the current conversion line.
4. The current conversion line is greater than the current baseline.
5. The lagging span is greater than the closing price of the last 25 candles.
6. The lagging span is greater than the past cloud.
7. The lagging span is greater than the past conversion line and the past baseline.
8. The current conversion line is greater than the current cloud.
9. The current baseline is greater than the current cloud.
10. The value of the current cloud to the future cloud is completely blue.
Sell Signals:
1. The current closing price is less than the current cloud value.
2. The future cloud is red.
3. The current closing price is less than the current conversion line.
4. The current conversion line is less than the current baseline.
5. The lagging span is less than the closing price of the last 25 candles.
6. The lagging span is less than the past cloud.
7. The lagging span is less than the past conversion line and the past baseline.
8. The current conversion line is less than the current cloud.
9. The current baseline is less than the current cloud.
10. The value of the current cloud to the future cloud is completely red.
The script enables users to access the value of these 10 trade conditions across the 7 major time frames (1-minute, 5-minute, 15-minute, 30-minute, 1-hour, 4-hour, Daily, and the current charts time frame) by using the official non repainting request security function provided by Trading View:
f_secSecurity(_src, _res, _exp) =>
request.security(_src, _res, _exp )
This indicator provides up to 70 variables (10 variables X 7 timeframes) that can be used separately, or in combination to generate signal labels.
Enhance your visual analysis with a color-changing baseline and candle colors that adapt to signal shifts, offering an immediate understanding of market trends. The base line will change from gray to blue/red which will reference the most previously plotted signal label. This change in color indicate that the conditions from the most recently plotted signal label have been met once again. Please refer to the example below.
Adjustments to the Ichimoku Indicator:
The script uses a slightly refined version of the Ichimoku indicator to calculate 10 different “trade conditions”. Each trade condition can create 1 bullish signal label and 1 bearish signal label. The calculations are primarily based on “greater than and less than logic” which is standard for signal generation.
In the original Ichimoku calculations, the “Lagging Span” has a default value of 26 periods. In the actual calculations, this input with the title “Lagging Span” is referred to as the “displacement”. When the lagging span is plotted on the chart, it is plotted with an offset value of offset = -displacement + 1 which technically plots the lagging span 25 candles to the left the most recent candle (if you count the most recent closing price as 0 and not 1). The clouds are plotted with an offset of offset = displacement -1 which technically plots the clouds 25 candles to the right of the most recent candle.
I have adjusted the logic of the Ichimoku indicator so the lagging span is still plotted 25 candles to the left of the most recently confirmed candle close, but the cloud is plotted 26 candles to the right of the most recent confirmed candle close.
This seemingly small adjustment of one candle cannot simply be adjusted in the settings of the original Ichimoku indicator since the calculations of the cloud and lagging span displacements are directly affected by the same value (displacement = 26, also known as the “lagging span”). My script is adjusted to make calculations where the lagging span is 25 candles to the left of the most recent candle, and the cloud is displaced 26 candles to the right of the most recent candle.
For example, my scripts logic to detect if the current closing price is over the current cloud is (close > leadLead1 and close > leadLine2 and leadLine1 > leadLine2 . By using a lookback of , the logic assumes that the displaced value is 26 bars to the right of the most recent candle. My script also reflects this logic in the plotted values of the cloud where the offset values are offset = displacement. This adjustment is made without affecting any other part of the Ichimoku indicators calculations, only the displacement of the cloud which directly affects the logic of trade conditioins. This change is a deliberate and necessary function of this script’s logic to generate trade conditions and signal labels.
I’ve removed the conversion line and the lagging span and introduced a 26-period pivot high/low to provide a less cluttered chart. The pivot high/low looks 26 periods to the left and only 1 period to the right. The lagging span and conversion line logic is still built into the framework of the trading signals. If you choose to enable the lagging span, or conversion line.
trading approach, and always test your strategies thoroughly.
The function to generate the "Signal Labels" calculates every single possible combination of the 7 different timeframes which is a total of 127 combinations for bullish signal labels, and 127 combinations for bearish signal labels. This function also provides the necessary criteria for the strategy entry conditions, based on the dynamically calculated values derived from the signal labels themselves. For example: "buy signal on 1 minute and 5 minute timeframe" is considered 1 combination, and "Buy signal on current, 5 minute, 15 minute, 30 minute, 1 hour, 4 hour and daily timeframe" is also considered 1 combination. There are a total of 254 combinations between buy and sell signal labels along with 254 individual variables with their own unique tool tip description. The signal label function alone spans over 1340 lines of code (minus spaces and comments) to specifically account for every possible variable combination. This unique and original function also calculates the signal label "value" which is the number you see on the signal label. This function adjusts the amount of labels plotted, the value and description of all labels based on the timeframe settings "single"/"multiple", the use of "use current timeframe" setting, and the "trade schedule". This signal label function has been a landmark piece of code for me in my endeavor to create and optimize my strategies based on its ability to provide an in depth analysis of the timeframes used when generating signal labels. This function is main reason that this script has been published closed source.
Back tested results.
The current results are from US30 (Dow Jones Industrial Average CFD) on the 5-minute timeframe using regular candles. The inputs are as follows:
Stop loss = 5000 pts
No take profit.
Trail activation = 100 pts
Trail offset = 100 pts
Don’t allow trade reversals
Trade 24/7
Timeframe = multiple
Show absolute signals
Use current timeframe, lag span over/under candles
Use 30m timeframe, all cloud is bull/bear
Initial capital = $10,000 USD, 1 contract, $0.07 per contract, slippage = 3 ticks, use bar magnifier = on
Timeframe = June 1st, 2023 – November 10th, 2023, risk = 5% (greatest loosing trade = $500.44)
Premium VWAP Trendfollow Strategy [wbburgin]This is a strongly-revised version of my VWAP Trendfollow Strategy, which follows a substantial reworking to address various structural inefficiencies with the script, such as the narrowing of the standard deviation band upon anchor reset. I will continue updating the original script with planned adjustments, this is a different proof-of-concept that builds off of the original script thesis with a different calculation method and execution.
This strategy is not built for any specific asset or timeframe, and has been backtested on crypto and equities from 1 min-1 day. The previous experimental strategy was heavily-correlated with the actual movement of the asset, which added unpalatable risk to the strategy and increased drawdown. This revised form has a more stable backtesting curve, but I want to heavily emphasize that I cannot guarantee that the strategy will be profitable for your circumstances. Backtesting only goes so far and every exchange has a different fee schedule, which can substantially eat into your profits. At the bottom I will explain the parameters behind the strategy results.
**********
The VWAP Trendfollow Strategy begins with a simple premise: to enter long when the price breaks above the upper standard deviation of a VWAP, and to close the position when the price breaks below the lower standard deviation of the VWAP. This is more effective than initiating the same strategy for a VWMA because the VWAP resets its anchor depending on your chosen anchor period, and the act of resetting its anchor also resets its standard deviation value. As a consequence, in sustained uptrends, the standard deviation is pulled upward to meet the price when the anchor resets, instead of requiring the price to fall all the way back down, as in the lower standard deviation band of the VWMA. This essentially acts as the VWAP itself raising the stop loss at each anchor period, which works well for the overall trend-following strategy.
However, this narrowing can still have consequences for a simple breakout strategy; as the price gradually oscillates towards above or below its standard deviation band, it may cross over the other and produce false signals. This oscillation is worrisome especially when fees are taken into account.
Thus, the premium VWAP Trendfollow strategy has a variable width which detects abnormal narrowing of the band, and adjusts it until it is reasonable to close the variability period. Additionally, a filter is added to the open/close signals to soften the frequency of signals without impacting performance significantly.
This script contains an ATR stop loss and an ATR take profit (which is also a difference between it and the original experimental script), with customizable inputs. The strategy results shown below are with initial capital of $1000, qty entry of 10%, and commissions of 0.06%. It works best on 24/7 instruments, like crypto, but I have found it also works with FAANG stocks or other high volatility / high volume assets. The issue with stocks, however, is that the price can jump/plummet because of abnormal events after-hours, which the strategy cannot pick up on until pre-trading begins the next morning. For that reason I suggest it be used on crypto and, because of its low % profitable (but high average winning trade in relation to its average losing trade), be used on an exchange that has minimal fees or volume-based discounts. In the unfortunate case that you cannot find a minimal fee or volume-discounted fee exchange (such as fellow Americans following the liquidity-retreat on Binance.US), I encourage you to test out the higher anchor periods for the higher timeframes, which will reduce the number of trades and increase the average % per trade.
Additionally, this is a long-term strategy used best for accumulation. It is currently long-only; that may change based off of user input.
**********
Disclaimer
Copyright by wbburgin.
The information contained in my Scripts/Indicators/Algorithms does not constitute financial advice or a solicitation to buy or sell any securities of any type. I will not accept liability for any loss or damage, including without limitation any loss of profit, which may arise directly or indirectly from the use of or reliance on such information.
All investments involve risk, and the past performance of a security, industry, sector, market, financial product, trading strategy, backtest, or individual's trading does not guarantee future results or returns. Investors are fully responsible for any investment decisions they make. Such decisions should be based solely on an evaluation of their financial circumstances, investment objectives, risk tolerance, and liquidity needs.

[pAulseperformance] PSStrategyX█ OVERVIEW
This script reduces the amount of time it takes to turn your indicator into a live trading bot.
It will convert your signals into alerts that will be sent to your exchange for trading.
The script features a broker connector to automate alert syntax and connect with third-party exchanges to live trade strategies with minimal setup.
It also includes an enhanced version of the built-in backtester with customizable options to speed up backtesting, trade-by-trade statistics, and a chart strategy summary to help traders make informed decisions.
The PSStrategyX trading tool is designed to provide traders with a range of benefits, including:
Increased confidence in their strategies.
Better understanding of the accuracy of indicator signals.
Simplified automated trading through third-party broker connections.
Reduced time to develop strategies by focusing on signal development only. No need to work with complicated strategy testing code and 3rd party automation.
█ FEATURES
Broker Connector
— Supports Autoview (More Connectors added in the future)
— Connects and auto trades with most exchanges
— No need for Webhooks (AutoView)
— Can forward test live strategies on Testnets before using real money.
Built in Backtester loaded with options to speed up backtesting
— Standard strategy features including stop loss, take profit, and various filters reduce the time and complexity involved in building a working strategy.
Trade By Trade Statistics
— Gain insight on every trade with additional trade-by-trade statistics.
Strategy Summary
— Get instant feedback on your chart of your strategies performance. Visual cues and feedback give you hints on where to look and what to improve.
Strategy Tester Enhancements
— Take the max trades allowed in the strategy tester without errors.
— Take the largest or smallest trade allowed without errors.
█ WHY?
The PSStrategyX tool was developed to solve a common problem faced by traders who use Pine Script on TradingView: the inability to integrate Pine Script with exchanges through TradingView.
Without this integration, traders need to go through several extra steps to live trade their Pine Script strategies on a real exchange with real money. This includes finding a broker, learning the new syntax for the broker, and placing that syntax correctly in the strategy.
These steps can be time-consuming and add complexity to the codebase.
The PSStrategyX tool simplifies this process by automatically configuring the correct alert syntax to connect to third-party exchanges, allowing traders to live trade their strategies with minimal setup. This saves traders time and effort, allowing them to focus on signal development rather than complicated strategy testing code and 3rd party automation.
Additionally, the tool was developed to address the time-consuming task of converting any one of the thousands of great free indicators on TradingView to strategies through hours of coding.
Overall, I built the PSStrategyX to streamline the auto trading process and make auto trading more accessible to traders of all levels.
█ HOW TO USE THIS?
Using the PSStrategyX trading tool is a straightforward process that requires a few key steps:
1 — Generate trading signals: You need a signal generator that can provide buy and sell signals for your preferred trading instrument(s).
You can use TradingView's indicators or create your own custom indicators using TradingView's Pine programming language.
2 — Connect trading signals to PSStrategyX: You will use 2 scripts on your chart. One generates buy/sell/exit signals, and the other is the PSStrategyX script executing those signals as trades.
To set this up you will need to make sure that your signal generator is an indicator, NOT a strategy.
Make sure the signals are being plotted buy = 1; sell = -1; exit = 0; signals in one plot. Exits are optional.
Example plot(buy ? 1 : sell ? -1 : exit ? 0 : na)
You will choose the plot with buy/sell/exit signals inside the PSStrategyX tool to execute trades. If you need help, check out the docs for more details.
3 — Set up the broker connector (optional): If you want to take live trades with this tool, you will need to set up a third party connecter. Once set up, everything is automated. See more details in the "authors instructions." at the bottom of this post.
4 — Set up an exchange account (optional): If you want to trade on an exchange, you will need to set up an account with the exchange you plan to use.
The Broker Connector supports a range of popular exchanges, including Binance, Bitfinex, Kraken, Oanda and more.
Once you have generated your trading signals, set up the Broker connecter (optional) and set up an exchange account (optional), you can start using the PSStrategyX trading tool to execute trades automatically based on your trading signals.
█ LIMITATIONS
Here are some important limitations to keep in mind when using the PSStrategyX trading tool:
General:
— Once the alert is sent, there is no way to monitor positions on any exchange. The order will be processed by the broker connector and sent to the exchange.
While this usually works fine, it's important to check the log for errors.
Sometimes the broker connector may fail to process the order, or the exchange may not process it for various reasons.
— The tool sends TP/SL orders with the entry order when possible to protect your order in case of errors or if you lose a connection.
However, not all exchanges accept TP/SL orders, and sometimes your entry order will be left unprotected.
FIFO:
— This tool DOES NOT support the First In First Out (FIFO) method for closing positions.
— Instead, it uses the ANY method. There currently is no way to make this variable.
█ FAQ
What does PSStrategyX do exactly?
PSStrategyX is a strategy enhancing, backtester, forwardtester, automation and simulation tool. It's NOT a signal generator, and does not produce buy/sell signals by itself. You provide buy/sell signals, and PSStrategyX will put those signals on steroids...basically.
PSStrategyX helps you figure out what indicators actually work. Without wasting time learning how to code.
Why did you choose AutoView for this tool?
AutoView offered the best integration I could find. They allow you to connect to test exchanges for free, which is great for practicing without using real money. They also work without using webhooks, which means you can live trade without paying for Tradingview pro. Additionally, AutoView supports many different exchanges. I don't work for AutoView, but if you sign up through my referral link and purchase a paid version, I earn a commission.
Why doesn't Tradingview automatically connect Pine Script to exchanges?
This is a great question, but unfortunately I don't have the answer. It would definitely be helpful if Tradingview provided this feature, but it might also put some brokers out of business.
How do I get access?
DON'T ask for access in the comments.
DO review the "Authors Instructions" on this page for details.

Mean reversal QFL v3My aim is to make the bots trade as you would trading QFL manually and “by the book” or at least to my experience and understanding from the material out there of how you should plan a QFL trade.
Im absolutely not a pro trader, I have made my share of costly mistakes trying to be clever or Beeing impatient resulting in painful losses. QFL is we’re I’ve had consistently good results tough.
Is this where I have to say I’m not a financial advisor and all that? Well I’m not. As always Do your own research and backtest, backtest, backtest.
First: I believe no bot strategy are set and forget, while they can run unattended 80-90% of the time you're always going to find yourself in a situation where you will have to manually handle a bad deal. It would also make sense to be somewhat involved in the really good trades making the most out of them. That’s why understanding the strategy the bot Is using is really important, hence why I prefer QFL. It's an easy concept to understand, and proved to be a safe way of making steady profit in pretty much all market conditions if done right.
Some changes in how aggressive you are might be needed if you are the impatient kind of trader who needs to see a lot of deals happening. But it is an added risk. In those cases Luc would advise to start “nibbling” but that would be hard to implement in a bot but I will see if that’s something I can implement.
Same goes for going the more conservative route when market conditions calls for it.
QFL stands for Quickfingersluc, and sometimes it is referred to as the Base Strategy or Mean Reversals. Its main idea is about identifying the moment of panic selling and buying below the base level and utilizing Safety orders.
Base level or Support Level refers to the lowest price level that was reached before the moment the price started increasing again. At that level, you can notice that buyers of some cryptocurrencies make a strong reaction.
As a bit of a learning material i want to make a few points on important factors in trading using the QFL strategy:
• Identify strong bases
• Read the history of the chart
• No emotions
Trading QFL using a bot has it’s limitations:
· Some of the bases are questionable but im constantly trying to improve this
· The strategy don’t take into consideration chart history(success rate)*
· You need to follow a predefined (by you) buying ladder, hence not considering a particular coin's average price movement, which may vary quite a lot. This why I for now has limited the strategy to SIMPLE bots. So that unique alerts can be created for each pair.
· A set Take profit %, possibly making you miss out on higher profits(This is easy to change during a trade though), and no chance of selling in layers(This is coming soon).
1. Some of the bases are questionable
The strategy will start trades of bases that you wouldn’t consider being a strong base(or a base at all) when looking at the chart.
For those not as familiar with QFL. What is a base, and what qualifies as a strong base?
• A base is also called the Support Level, which is the lowest price level that was reached before the price started turning and increasing again.
• A strong base is recognized by a steep fall in price after breaking the base(Panic), followed by a big reaction pump.
• The reaction pump is the most important factor to say that it is a strong base.
• And also the last base, the one you are trading of is the one that counts
Tip: Look for V shapes on the chart, easy to spot when zoomed out.
2. The integrated signals don’t take into consideration chart history(success rate)*
How can you assess the success rate by looking at the chart?
After finding the bases based on the criterias from the 1st point. Looking at the, how many times did it respect the base after breaking it? 7/10, 8/10, 9/10 times? Great! Chances of the next trade also respecting the base is big, and I would consider raising the TP on that deal. Any lower than that I would keep a really close eye on the deal, or even consider closing the deal. And again remember the last base is the one that counts. If all the others are nice strong bases but that last one you are about to take a trade off is no good the base is invalidated so be cautious.
3. You need to follow a predefined (by you) buying ladder
Crypto is volatile, and there is a huge variation in price movements on all the coins.
Trading manually, looking at the chart gives you a good idea on how much a coin on avg. drops below base, and how big the following reaction is. This gives you an indication on how deep you need to set your layers, and where you can take profit.
Using the strategy you have the backtester to see how much max deviation has been in the past so that you can figure out what the optimal max deviation is.
4. A set Take profit %, possibly making you miss out on higher profits(This is easy to change during a trade though), and no chance of selling in layers.
Not going to say to much about this other than what I often do is:
When a bot has started a trade I usually take a look at the chart. If I like what I see, nice chart history, success rate and trading of a strong previous base etc, with the current base break resulting in a panic drop I will consider increasing the TP so that it will make more profit. This can be a bit risky but also very rewarding. Imagine filling all safeties and then selling just below base! Massive profits!! (Gotta be honest though, almost never stretch it that far with a bot though, but it is a possibility) .
If you have studied the chart and concluded that this particular trade has a 90% chance of success, there isn’t really any reason not to place TP just below base. This is where I would like to have the option of layering my sell orders as well so its something im working on implementing.
Trailing is an option in 3commas, but it’s slow to place orders making you miss a selling opportunity when the coin makes a sudden spike up.
ABOUT THIS STRATEGY
In this strategy we can also reverse the strategy and go short. But i must warn you that that is alot riskier.
QFL is meant to be used on higher TF's like 1hr, 2hr and 4hr. But this strategy also work well on lower Timeframes.
The script also simulates DCA strategy with parameters used in 3commas DCA bots for futures trading.
Experiment with parameters to find your trading setup.
Beware how large your total leveraged position is and how far can market go before you get liquidated!
Do that with the help of futures liquidation calculators you can find online!
Included:
An internal average price and profit calculating, instead of TV`s native one, which is subject to severe slippage.
A graphic interface, so levels are clearly visible and back-test analyzing made easier.
Long & Short direction of the strategy.
Table display a summary of past trades
Vertical colored lines appear when the new maximum deviation from the original price has
been reached
All the trading happens with total account capital, and all order sizes inputs are expressed in percent.
How to use:
- Add the script to the current chart
- Open the strategy settings
-Tweak the settings to to your liking.
-Make a SIMPLE bot in 3commas and use the same settings as you did in tradingview if you only want the strategy to send signals to open a deal and let 3commas handle the rest.
If you check safety orders, Take profit deal stop and Stop loss. The strategy will send all the orders to 3 commas. If that’s what you want set TP in 3commas to 50% set number of safety orders to 0 and keep stop loss unchecked.
- Insert bot details using the deal start condition message found in your 3commas bot.
- When happy, right click on the "..." next to the strategy name, then "Add alert'".
- Under "Condition", on the second line, chose "Any alert () function call". Add the webhook from 3commas( 3commas.io ), give it a name, use {{strategy.order.alert_message}} as a placeholder message and "create".
In the future this signal might make it to the 3commas marketplace. You can then subscribe to that signal where I have cherrypicked coins based on thorough backtesting and optimization.
How to obtain access to the script: send me a private message in Tradingview

BollingerBands Strat + pending order alerts via TradingConnectorSoftware part of algotrading is simpler than you think. TradingView is a great place to do this actually. To present it, I'm publishing each of the default strategies you can find in Pinescript editor's "built-in" list with slight modification - I'm only adding 2 lines of code, which will trigger alerts, ready to be forwarded to your broker via TradingConnector and instantly executed there. Alerts added in this script: 14, 17, 20 and 23.
SCRIPT INCLUDES PENDING ORDERS AND ALERTS! Alert will be sent to MetaTrader when order is triggered, but not yet filled. That means if market conditions change and order does not get filled, it needs to be cancelled as well, and there are alerts for that in the script as well.
How it works:
1. TradingView alert fires.
2. TradingConnector catches it and forwards to MetaTrader4/5 you got from your broker.
3. Trade gets executed inside MetaTrader within 1 second of fired alert.
When configuring alert, make sure to select "alert() function calls only" in CreateAlert popup. One alert per ticker is required.
Adding stop-loss, take-profit, trailing-stop, break-even or executing pending orders is also possible. These topics have been covered in other example posts.
This routing works for Forex, indices, stocks, crypto - anything your broker offers via their MetaTrader4 or 5.
Disclaimer: This concept is presented for educational purposes only. Profitable results of trading this strategy are not guaranteed even if the backtest suggests so. By no means this post can be considered a trading advice. You trade at your own risk.
If you are thinking to execute this particular strategy, make sure to find the instrument, settings and timeframe which you like most. You can do this by your own research only.

SignalCAVE Strategy BuilderYou can create strategies without writing single line of Pine Script code!
Do backtesting, set alerts and explore algorithmic trading with using SignalCAVE Strategy Builder on TradingView.
SignalCAVE Strategy Builder for TradingView
SignalCAVE is a tool that help you to create strategies in TradingView. SignalCAVE offers flexible strategy builder panel enabling users to backtest and set alerts with custom conditions (selected indicators and parameters).
CAPABILITIES
You can define rules and conditions for “Long” and “Short” signals.
“Stop Loss” or “Take Profit” functions can be activated with providing percentage values.
“Only Long”, “Only Short” or both “Long and Short” signals can be used at the same time.
Available Indicators
EMA, SMA, WMA, HMA, RSI, MACD, Stochastic, Bollinger Bands, SuperTrend, Parabolic SAR, DMI, ATR, CCI, CMF, ROC, Ichimoku, OHLC Prices
How to Set Strategy Rules?
On SignalCAVE strategy settings screen, there are four types of input groups. You can populate these input boxes based on your strategy.
A: First indicator’s parameter and index value selection area
First Input: First indicator selection.
Second Input: First indicator’s parameter selection. If you want to use default parameters, select “Default Parameters”. If you want to use custom parameters, select “Custom Parameters”. If your selection was custom, then you need to fill “P:A” input boxes to assign your custom parameter.
Third Input: First indicator’s index selection. Default parameter is “0”, If you want to get previous value of indicator/price, you can type positive numbers.
?: Condition and Interval selection area.
You can select “Upper (>), Lower (<), Upper or Equal (>=), Lower or Equal (<=), CrossOver (⬆), CrossUnder (⬇)” conditions and time frame interval for calculation both first (A:) and second (B:) indicator.
B: Second indicator’s parameter and index value selection area
First Input: Second indicator selection.
Second Input: Second indicator’s parameter selection. You may use either default parameters, or custom parameters. If your selection was custom, then you need to fill “P:B” input boxes to assign your custom parameter.
Third Input: Second indicator’s index selection. Default parameter is “0”, If you want to get previous values of indicator/price, you can type positive numbers.
P:A First indicator’s custom parameter settings. If selected indicator has less then four parameters, you can fill unnecessary fields with “0” value.
P:B Second indicator’s custom parameter settings. If selected indicator has less then four parameters, you can fill unnecessary fields with “0” value.
DASHBOARD
After you build the strategy with SignalCAVE, you can see rules and conditions on dashboard with chart view screen.
Hint: By adding multiple times of SignalCAVE strategy on your chart screen, you can build more then one strategy.
STRATEGY TESTER / BACKTEST RESULTS
You can see strategy backtest results from “Strategy Tester” panel.
By changing parameters or strategy rules (strategy optimization), you may get better results. These results does not guarantee a success for future trades.
ALERT SETTINGS
If you want to get notify about your strategy outputs (Long Entry, Long Exit, Short Entry, Short Exit, Stop, Take Profit) you can set an “Alert”.
You can click “Alert” button to create a new alert. Make sure on “Conditions” selection must be “SignalCAVE” strategy.
Paste to “Message” field exactly the text below.
{{strategy.order.alert_message}}
Hint: By setting a single alarm, you can get notifications for all outputs.
Do your alerts modifies when you change the strategy conditions or parameters?
While the strategy got updated, its alerts still use the strategy’s state from the time when we made the alert (TradingView Wiki, 2018b).
This has the advantage that, once we made a script alert, we can change the script’s input options, change chart settings, or remove the script from to the chart. All of that won’t affect our existing alert. That gives a lot of flexibility to keep interacting with the chart and script.
But there’s also a disadvantage: if we do want our script’s alerts to change, we first need to remove the existing alerts. Then we have to create and configure new alerts based on the indicator’s updated code or settings.

Double EMA CROSS
Double EMA CROSS (DEC)
Useful for identifying and receiving alerts about uptrends and downtrends.
This script uses two Exponential Moving Averages (EMAs) to find price uptrends and downtrends.
An Exponential Moving Average ( EMA ) is a type of moving average that places a greater weight and significance on the most recent data points.
The script produces uptrend and downtrend signals based on crossovers and divergences between the two EMAs,
the user will be able to spot a trend change (when the EMAs crossover) and to determine the strength of the current trend (when the EMAs diverge).
It is also posible to get alerts for uptrends and downtrends on the web and mobile app with sound and pop-ups as well as via email.
The optimal time to enter and exit the market can be concluded from this trend changes.
The user can set their own EMAs, by default they are set to 25 and 75 periods for medium and long term respectively.
When the medium term EMA crosses below the long term EMA the asset is in a downtrend and the price will decline, and when the
medium term EMA crosses above the long term EMA the asset is in an uptrend and price will increase.
This scripts plots the following indicators and signals on the chart to help the user to identify trends:
1.- Medium and long term EMAs as lines overlaid on the price chart.
2.- Up green triangles above bars when the price is on an uptrend and down red triangles below bars when the price is on a downtrend.
3.- Arrows with text to indicate the start of an uptrend or downtrend.
The user can enable and disable the indicators and signals as well as set colors and shapes to their liking.
This script also lets the user create alerts for uptrends and downtrends. To create a new alert using this script follow this instructions:
1.- Once you added this script to your chart, go to the alerts panel (right on web or bottom tool bar on the mobile app) and add a new alert (alarm clock icon with a plus sign).
2.- A modal window will open. On the “Condition” dropdown menu select “DEC”.
3.- On the next dropdown menu (right below the “Condition” one) you can select.
4.- Lastly you can set all the normal alert options and create the alert.

Ultimate multi-indicator strategy and script- AlphaNHBI created this to be the best multi-indicator strategy, with a matching alert script. This script is ideal for beginners, as well experienced traders who need direct indicators without any of the flashy unnecessary features. This script gets right to the point.
This strategy code was designed for the best mixture of most common indicators, allowing the user to mix and match any indicator he/she chooses. You are able to use sell signals that are either take profits and sell signals, or you are able to use the sell signals of one, or more indicators, OR you can use both (sell signals of indicators AND take profits and stop losses.)
Buying indicators allow you to use the MACD , stochastics, RSI , moving average, fibonacci, t3, Bollinger bands , fractals, and more.
This script works on anything with a chart. It can be applied to crypto, stocks, bonds, forex, etc.
If you would like the script that matches this strategy so that you can do REAL TRADING with LIVE TIME ALERTS, please DM me.
If anyone has suggestions on how to make this better, let me know! This is a growing script that I am building to be universally solid through different markets and through different market conditions!
The details of this backtest are the following:
Initial Capital: 5000
Order Size: 25%
Pyramiding: 10 (although, I don't usually use pyramiding myself, and you don't need to and you will still be largely profitable, by pyramiding definitely helps with smoothing results.)
Commission: 0.1% to match Binance fees

BlueFX Strategy We are re publishing the script so the Script Title doesn't display the old version number, to stop further confusion with our members.
This title will now remain constant, until you click into the strategy and the latest version number will be shown.
The previous release notes below are copied from the previous descriptions with the release note updates shown.
Hi Traders,
I hope everyone is great - its a long one - but worth the read, I promise....
Firstly, thank you to our members for being patient with this release - it took longer than anticipated but now with even more functionality too - and some improved profitability in back-testing on our H1 time frame especially - explained further below.
Secondly, thank you to the individuals that have made this happen - you know who you are! Sounds like an Oscar speech right.... sorry.
This tool we believe really does change the game - please read on to find out more.
As a brief reminder this builds upon on initial V1 and V2 indicator/scripts ...
The strategy itself
Our strategy will help you identify the current trend in the markets and highlight when this is changing. The strategy itself is based upon 4 indicators lining up in total confluence to increase the probability of the trade being a success.
Absolutely no technical analysis is needed to trade this successfully - this can be used on all time frames and all pairs - obviously with varying profitability as all pairs work differently - this can be reviewed quickly in 'Strategy Tester' to hone in on your own desired settings.
When all criteria is in alignment the strategy will convert all candles to the relevant colour - Green for an uptrend and Red for a downtrend; a candle that is printed normally simply shows that no current trend is in place to warrant a colour change. A normal coloured candle could possibly indicate a change in current market direction or the market consolidating before a further move in the initial direction.
When a new signal is valid, 'Blue FX Buy'' or 'Blue FX Sell' will be displayed and the small arrow shown on candle open for entry. (*Now along with Entry Price (EP), Stop Loss (SL), Take Profit (TP) and Lot size that is based on the risk parameters you have set personally on V3)
Version 2 was created with H4 confluence built in and also a display of a suggested Stop Loss (SL) and multiple Take Profits (TP's) on the H1 (One Hour) time frame - thus making your entry even easier and your SL more reliable - these suggested SL's and targets were based on the ATR of that pair at that time - a popular choice amongst traders - automatically built in.
What is a Trading View Script?
A script is like an indicator but better, we can prove the success of our strategy by using Trading Views strategy tester function. As shown below and on the chart - you can see the 'Buy' and 'Close Buy' on the chart, supported by a live trading log showing you the entry, entry price date, volume and closing price.
This is a great function for numerous reasons; firstly, you know you are using a profitable strategy, secondly you can use this as a trading journal to support your trading too. This in itself can help you with your trading psychology - letting winning trades run is a prime example of this. Take confidence in the statistics and performance over time.
Ultimately, we believe we have saved YOU the need to firstly, find an edge and a strategy - and all of the time it takes to BACKTEST a strategy - to then find it may or may not work - and then you start again!
Well guess what?
We know this works and it takes you seconds to see it.
Everyone can see the statistics themselves for 2020 to date (and previous!); an account gain of over 500% if you managed to catch all trades risking 1% per trade. I understand that catching all trades is difficult but even if you caught a third, that's still not too bad right?
Disclaimer alert; Please remember past performance is exactly that - how our strategy performed over those dates tested, it is not obviously a guarantee of future performance.
Even better, you/we can still hone in these settings to find an improved performance per pair on any given time frame and money management plan. (We are currently looking into automating this process too)
Default settings are set for use with the H1 time frame - no extra confluence checking is needed with these settings.
So what are the specific changes I hear you ask?
- Visibility of the SL and TP labels across all time frames.
- Visibility of all previous SL and TP labels with the click of a button (Prev. was only 2).
- Proof of the profitability of the strategy - we had this in V1 but this was based on trend following with the exit - we didn't in V2 when we added the SL and TP display function.
- The ability to customise the parameters and see the instant impact of the desired pair/time-frame and testing date range - of course some work better than others and will do at different times - once we have found a way to test this in an automated way we could look to do this monthly/quarterly to ensure we are using 'optimal' parameters at all times.
- Another game changer here is the addition of a lot size calculator - set your balance, set your risk and the LOT SIZE you should be trading will appear as if by magic - no need to use any other tool to do this. For inexperienced traders and especially trading stocks/ gold / commodities we suggest you check the contract sizes first as some brokers may operate differently. This visual cue will help ensure you are managing your risk and save you time in checking the right Lot Size for your trade (every pair has a different pip value and every trade a different SL).
- Although not required in our H1 settings currently - we have added more higher time frame confluences - which can improve the profitability of different pairs on different time frames in testing.
- As our tool can be used across all instruments we have a pull down menu for Crypto/Metals/Stocks/ Commodities , etc.
- The option to also test fixed lot size or percentage - see the benefit of compounding right away.
- The option to turn the testing function on and off.
Let's see an example......
An example trade - display Entry, SL, multiple TP, lot size and contract size.
snapshot
We have deliberately set the TP3 to be an increased target, this way we can capitalise on a large move in the market, should the move reverse and the opposite signal appears we close the trade anyway and follow the new signal.
I am unable to add other pictures in this Script description - but we will include in our Public channel and update our website to show them over the coming days.
I hope you can all see the functionality in this tool, the profitability in historic tests and how it can be used to give you your edge.
How do you access this I hear you ask?
Please visit our website for signup / purchase information in the first instance (the link is on our trading view profile / signature) or send us a private message on here - its impossible to keep track of comments on our posts so to ensure we don't miss you, a private DM will be great please.
Thank you for reading, we hope you choose to join our vastly growing community.
Kind regards
Darren
Blue FX
Jun 14
Release Notes: Default settings have been improved, providing a 600% gain YTD in back testing with less trades too.
Jul 4
Release Notes: Trend filter using ADX - our strategy is based on a trending market, adding the ADX filter to our strategy allows us to remove trades under the threshold level set. Previously - we tried to teach our members how to spot the ranging markets to help further increase their successes (although the stats were not based on any manual intervention) - now they don't have too.
Specific parameters set into the code - detects the pair and TF to shown them automatically - our method has been solid YOY growth based on a fixed 0.01 lot size to gain consistent yearly consistent results.
Trade volumes substantially reduced with a much higher win rate - due to the specific parameters and ADX filter.
No pull down menu when flicking between instruments - all done automatically; making it easier for trades flicking between trading instruments.
More TP options for testing - we have TP1/2/3 and other variables including FT (Follow Trend) / FT + SL (Follow trend with Stop loss) / TS (Trail Stop function)
Smaller labels showing entry, SL and TP, etc - much clearer on screen and on your app.
Lot sizes fixed - we had a previous bug affecting some currencies - as always where money is involved and managing risk, ensure you check and are comfortable this is correct of course
Filter for days of the week - some pairs hate specific days, a great tool, see how removing Fridays affects the performance in seconds.
Back testing on all instruments - not previously available - trade stocks like Tesla or Lloyds - or indices? We can give you back testing data for them all.
Filter for trading sessions - like the days of the week - if you are only trading London and US sessions, back testing data for other sessions is pretty pointless - now you can remove them too!
If you wish to just stay with the default V3 settings its simple, turn 'Use pre-defined parameter?' Off - and turn off ADX - your chart will then look like the initial v3.0 strategy anyway. However, every pair has improved performance we have found when including ADX - each pair is affected differently with a higher or lower ADX Threshold - this is parameter #9.
I don't think there is much more that can be added now - fuelled by our ambition - to provide our members with an easy yet profitable trading strategy for both beginner or experienced trader. We have this at the forefront of our minds when adding and reviewing functions.
Follow the trades, stay disciplined and don't focus on the money. Focus on the 'process' of following the strategy, its much easier on your mind too. Far easier following instructions than trying to do something without - follow your plan, the process and the money will follow.
If you wish to see all of the back testing data for each pair - hop into our Discord Server and check out the #public-backtesting-channel - all of them will be there when I post them tonight.
Jul 5
Release Notes: Another quick update.
More days of week added - Sat and Sunday trading sessions - (Sat - just crypto is open on TV)
Also a specific setting for trading just a certain time of day - this is based on EST time you will will need to convert back to your time zone for this to work.
For example, if you would like to test trading EURUSD between 7am and 11am - you will need to find the EST time for this which is 2am to 6am, you will then see these trades in the list of trades section. This is ideal for scalping certain sessions where all trades will be open and closed promptly.
I use the 'Time Buddy' app for this as its quite straight forward.
Regards
Darren
18 hours ago
Release Notes: Update - correcting the entry price label error.

Crypto Trend Following StrategyThis is the strategy script indicator of Crypto Trend Following Strategy which can be used for back testing. With study script indicator, strategy can be easily automated.
To set alerts, see Crypto Trend Following Study indicator.
Script is using several moving averages to keep you on the right side of the trend. Signals are also filtered based on other indicators to prevent buying already overbought or selling already oversold coins and avoid ranging markets.
MAIN GOAL
Main goal of the strategy is long-term stable profit. No strategy has 100% accuracy therefore there always will be some false signals. But patience pays, with Trend Following Strategy, you will get couple of small loses while waiting to get big wins when coin is trending strongly. As you never know the right time you must sustain and be in all trades to make sure that you will not miss the big move.
BACKTEST
This script is for free to play with so you can back test and see for yourself how the strategy performs on any of your favourite coins.
Strategy is optimized and back tested for USDT and BTC pairs on 6h timeframe but it can be used on any pair and any timeframe.
RISK & REWARD
Strategy does not use safety orders as DCAs usually leads to bag holding sooner or later. It does not use take profit either as strategy will tell you when to buy and when to sell based on the actual market condition.
You should always use stop loss to protect your account from drawdown or even being liquidated.
You can change stop loss or take profit as you like or even back test the strategy with your preferred settings to find what suits you best.
STRATEGY SETTINGS
You can use the strategy script for fine tuning and find best settings for yourself.
If you need any help with settings do not hesitate to ask. I would also appreciate any feedback and ideas how to improve the script.
==== Indicators settings ====
RSI Long < and StochRSI Long <
• used to filter out buy signals of already overbought coins - ( stoch ) RSI must be under set value to fire a BUY signal
RSI Short > and StochRSI Short >
• used to filter out sell signals of already oversold coins - ( stoch ) RSI must be over set value to fire a SELL signal
ADX >
• used to filter out buy or sell signals in ranging markets - ADX must be over set value to fire a BUY or SELL signal
MA Fast and Slow Length
• Two moving averages to indicate an actual short-term trend
Baseline Length & Type
• Baseline is a moving average which confirms the longer-term trend. You can set length and type of the moving average
==== Test period settings ====
• You can set the back tested window
==== Strategy settings =====
• Target Take profit and Stop loss in %
• Only LONG trades – tick if you do not want to calculate SHORT trades in the back test
• Plot key levels on chart – if you use stop loss and/or take profit, you can turn on levels of price to reach (yellow – bought price, red – stop loss – green - take profit)
Back test calculates with commission and fixed order size. You can change these settings on Properties Tab

eha Moving Averages StrategyMoving Average based strategies are very popular ones among both long-term investors and short-term traders as they can be tailored to any time frame. One of the main moving average strategies are crossovers. The very simple type is a price crossover , which is when the price crosses above or below a moving average to signal a potential change in trend.
Another strategy is to apply two moving averages to a chart: one longer (or slow) and one shorter (or fast). When the shorter-term MA crosses above the longer-term MA, it's a buy signal, as it indicates that the trend is shifting up (also known as “ Golden Cross ”). Meanwhile, when the shorter-term MA crosses below the longer-term MA, it's a sell signal, as it indicates that the trend is shifting down (which is also known as “ Dead/Death Cross ”).
This is a study to find a suitable trading strategy for 4-6 hour time frames. As you can see the performance is currently very poor. It has just generated almost 90 trades in a very long period from January 2017 to the time of publishing the study for the first time.
Moving averages work quite well in strong trending conditions but poorly in choppy or ranging conditions. Adjusting the time frame can correct this problem temporarily, although, at some point, these issues are likely to occur regardless of the time frame chosen for the moving average(s).
I am working on this basic strategy to make its performance better and I will update the post in the future. So keep in touch by following the post.
Why have I republished my study?
It sounds like TradingView stores and indexes scripts based on the title of the post rather than the actual title of the scripts and if one chose general terms as the title of the post, the TradingView script search engine may be unable to find it. So I decided to repost the strategy with a more searchable and unique prefix of " eha ".
Please provide me with your precious feedback.

TrendLines with AlertsThis isn't my own work, hence giving it in Open Source library for others to benefit from it too.
I have tried to refin the output of trendlines in this Strategy
The original Code is available at
The script needs some modifications, so I'll be making further updates in future, but for now I'm publishing this because most people don't know how to track trandlines, moreover, some use Line.New() by tradingview Pinescript, which again is a bit difficult to deal with.
This script is a basic version of trendlines on a certain angle (anglecheck was provided by the original author in his script).
Nothing fancy in this script.
Also Converted the original Script to Pinescript v4.
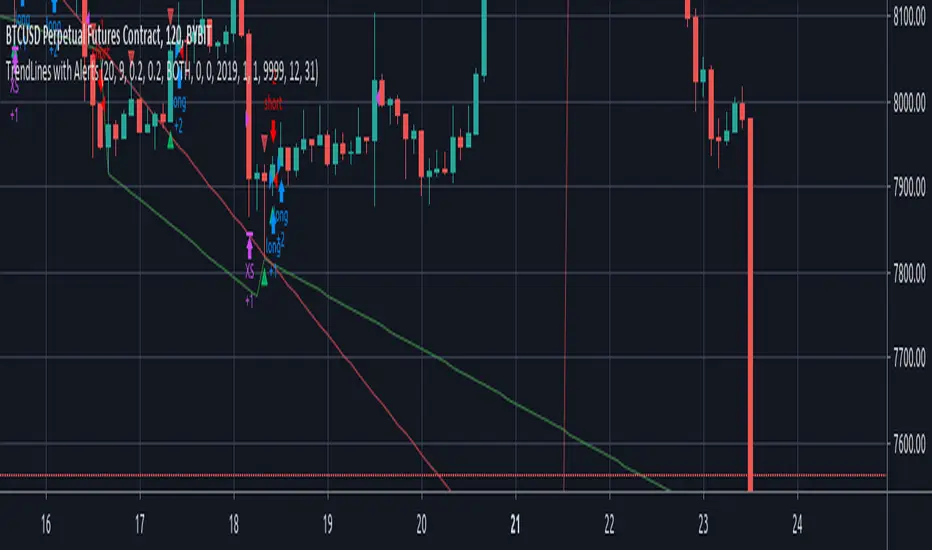
Reticulata - StrategyThis is the backtesting script for Reticulata
Reticulata is the first of many scripts to come from Bull Bear Bots. It is an early release version and supports multiple trade logics.
The script works across various markets including Forex and Cryptocurrencies.
All of our scripts are designed for manual traders but are ready to use with automated trading bots.
www.bullbearbots.com

Bollinger and Tendencies (Bollinger e Tendências )The strategy consists of buying when the price breaks up (crossover) the bottom line of the Bollinger and selling when the price breaks down (crossunder) to your top line.
The chart still shows trends clearly, with the fill between the exponential average and the closing value of the canlestick, green at high, red at low (this part of the script is based on the code: "Pivot Daily Price Color" by Rimko).
It also places notes on the high and low candlesticks (based on the code: "Candlesticks Pattern Identified" by Repo32).
It is recommended to use it in conjunction with the "IFR and Storage" script (also available to me), and some volume script.
A estratégia consiste em comprar quando o preço rompe para cima (crossover) a linha inferior do Bollinger e vender quando o preço rompe para baixo (crossunder) a sua linha superior.
O gráfico ainda mostra as tendências de forma clara, com o preenchimento entre a média exponencial e o valor de fechamento do canlestick, verde em alta, vermelho em baixa (essa parte do script é baseada no código: "Pivot Daily Price Color" do usuário: Rimko).
Também, coloca apontamentos nos candlesticks de alta e de baixa (baseado no código: "Candlesticks Pattern Identified" do usuário Repo32).
Recomenda-se a utilização em conjunto com o script "IFR e Estocagem" (também por mim disponibilizado), e algum script de volume.

Help with SMA Crossover Demo scriptHi I'm currently in the process of learning to write a script. Here's a very basic SMA 34/4 crossover script. Is somebody able to help me with adding the following functions to the script.
1. Add an alert and indicator to close a short or long trade whenever any candle touches the SMA 34 line?
2. When a SMA 34/4 Crossover has been executed (a Short Trade condition) add an alert/indicator (Titled “Add”) every time a Green bullish candle has closed.
3. When a SMA 34/4 Crossunder has been executed (a Long Trade condition) add an alert/indicator (Titled “Add) every time a Red bearish candle has closed.
4. To used on 15m/30m/1hr/2hr/4hr/1D/1W timeframe charts?
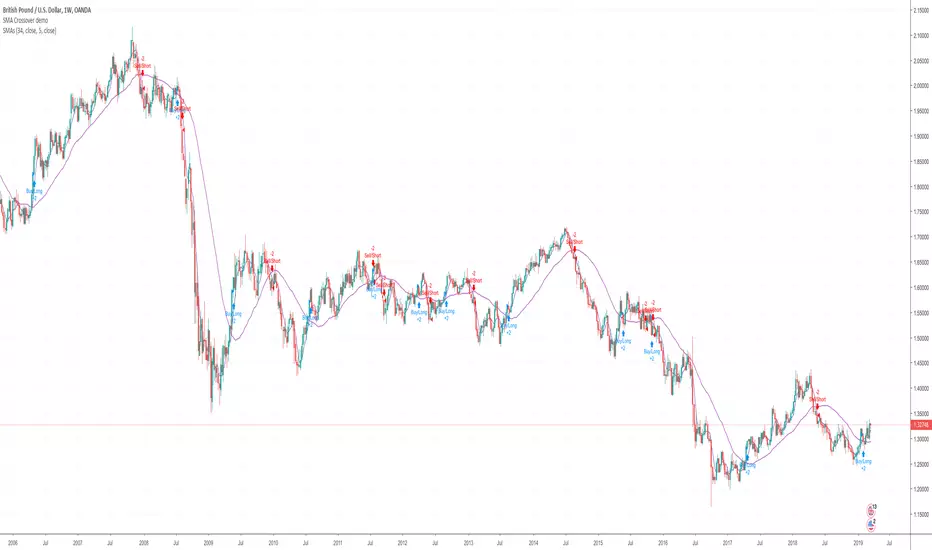
08-18 EMA Watson [BACKTEST][STRATEGY] BTC/USDTHello, it has been a while since I published something, I have been working on webdev in the last months but Here I Am again with a brand new strategy, I called it EMA Watson lol (no I'm not a fan)!
Recently Bitcoin has been outperforming almost all altcoins so I made a script for trading Bitcoin against USDT. This script should be used on a pair that is in an uptrend, just like BTC/USDT today. The script is coded in such a way that it won't make any trade if the trend goes bearish.
This is a simple buy and sell strategy, that can be used for manual trading or for a trading bot. The strategy is based upon the Exponential Moving Average trading rules, and I added my personnal touch of course.
I give access for free, just leave a comment.
More info about the script, such as inputs description, how to configure the script, strategy explanation, alert configuration can be found here : blockchainfiesta.com
The Alert Setup (indicator) script should be uploaded soon on my profile.
--------------------------------------------------------------------------------------------------------------
Commission Work: TradingView development, Reverse Engineering, Pine Script. contact@blockchainfiesta.com. You can also send me a message in TradingView or Discord
If you have too much crypto and want to help me out:
BTC address: 19sVQvCDmVfEACq7BiMnWSMqFPZ8qfSQ2K
ETH address: 0xc8a5d3a63a05db0c2363ea1c08b37a01cce9ebfb
Nick's Momentum Trading Strategy - Beats Buy and Hold manifolds!This script works on the principle of short-term mean reversion and long term trend following, and uses minimal parameters to ensure no overfitting.
The scripts beats buy and hold for almost all major pairs that satisfy the following conditions:
- are trading on multiple exchanges as either ALTBTC or ALTUSD pairs
- have good volume available with them
- have an established history - (try not to use this script with really new pairs)
To run the script, follow these rules:
- script should be run on ALTBTC pair
- set first parameter such that when multiplied with resolution of chart, we get a whole day/week/month, etc. e.g. for a '4H' chart, set this to multiples of 6. The reason being that most algorithmic rebalancing in cryptosphere happens at these times, and we want to make effective use of this.
- set second parameter in the range of 1-6 - this is the smoothing factor (ema) we want to apply to our indicator (governed by our first parameter) - more smoothing = lesser trades. See what works for you.
- Last parameter is a filter condition. Just check/uncheck it once to see if market works better with this on or off.
- If script does not beat buy and hold on this pair (rarely), don't use script on this pair at all.
Access available only to friends. I do code trading strategies on request - so, let me know if you have a good set of rules to create a strategy.
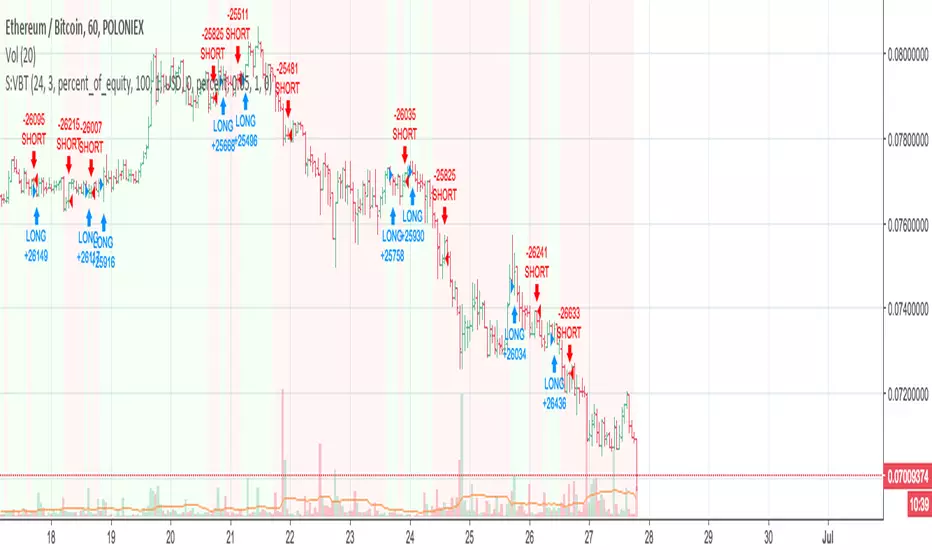
MACD Strategy- Script Example how to use % SL in your script ** Tired of Script showing a trade that you stopped out on but is still long on your script? Not any more**
I used Pine script to create realistic trading scenarios for SL users. Now your scripts will reflect what you see on the order book.
a=0.0
a := (*Insert buy condition*)? close: nz(a )
plot(0.98*a, color= green) //2%SL for BUY
b=0.0
b:= (*Insert Short condition*) ? close: nz(b )
plot(1.02*b, color= red) //2% SL for Short
Please check the script on how to implement this :)

Universal Regime Alpha Thermocline StrategyCurrents settings adapted for BTCUSD Daily timeframe
This description is written to comply with TradingView House Rules and Script Publishing Rules. It is self contained, in English first, free of advertising, and explains originality, method, use, defaults, and limitations. No external links are included. Nothing here is investment advice.
0. Publication mode and rationale
This script is published as Protected . Anyone can add and test it from the Public Library, yet the source code is not visible.
Why Protected
The engine combines three independent lenses into one regime score and then uses an adaptive centering layer and a thermo risk unit that share a common AAR measure. The exact mapping and interactions are the result of original research and extensive validation. Keeping the implementation protected preserves that work and avoids low effort clones that would fragment feedback and confuse users.
Protection supports a single maintained build for users. It reduces accidental misuse of internal functions outside their intended context which might lead to misleading results.
1. What the strategy does in one paragraph
Universal Regime Alpha Thermocline builds a single number between zero and one that answers a practical question for any market and timeframe. How aligned is current price action with a persistent directional regime right now. To answer this the script fuses three views of the tape. Directional entropy of up versus down closes to measure unanimity.
Convexity drift that rewards true geometric compounding and penalizes drag that comes from chop where arithmetic pace is high but growth is poor.
Tail imbalance that counts decisive bursts in one direction relative to typical bar amplitude. The three channels are blended, optionally confirmed by a higher timeframe, and then adaptively centered to remove local bias. Entries fire when the score clears an entry gate. Exits occur when the score mean reverts below an exit gate or when thermo stops remove risk. Position size can scale with the certainty of the signal.
2. Why it is original and useful
It mixes orthogonal evidence instead of leaning on a single family of tools. Many regime filters depend on moving averages or volatility compression. Here we add an information view from entropy, a growth view from geometric drift, and a structural view from tail imbalance.
The drift channel separates growth from speed. Arithmetic pace can look strong in whipsaw, yet geometric growth stays weak. The engine measures both and subtracts drag so that only sequences with compounding quality rise.
Tail counting is anchored to AAR which is the average absolute return of bars in the window. This makes the threshold self scaling and portable across symbols and timeframes without hand tuned constants.
Adaptive centering prevents the score from living above or below neutral for long stretches on assets with strong skew. It recovers neutrality while still allowing persistent regimes to dominate once evidence accumulates.
The same AAR unit used in the signal also sets stop distance and trail distance. Signal and risk speak the same language which makes the method portable and easier to reason about.
3. Plain language overview of the math
Log returns . The base series is r equal to the natural log of close divided by the previous close. Log return allows clean aggregation and makes growth comparisons natural.
Directional entropy . Inside the lookback we compute the proportion p of bars where r is positive. Binary entropy of p is high when the mix of up and down closes is balanced and low when one direction dominates. Intensity is one minus entropy. Directional sign is two times p minus one. The trend channel is zero point five plus one half times sign times intensity. It lives between zero and one and grows stronger as unanimity increases.
Convexity drift with drag . Arithmetic mean of r measures pace. Geometric mean of the price ratio over the window measures compounding. Drag is the positive part of arithmetic minus geometric. Drift raw equals geometric minus drag multiplier times drag. We then map drift through an arctangent normalizer scaled by AAR and a nonlinearity parameter so the result is stable and remains between zero and one.
Tail imbalance . AAR equals the average of the absolute value of r in the window. We count up tails where r is greater than aar_mult times AAR and down tails where r is less than minus aar_mult times AAR. The imbalance is their difference over their total, mapped to zero to one. This detects directional impulse flow.
Fusion and centering . A weighted average of the three channels yields the raw score. If a higher timeframe is requested, the same function is executed on that timeframe with lookahead off and blended with a weight. Finally we subtract a fraction of the rolling mean of the score to recover neutrality. The result is clipped to the zero to one band.
4. Entries, exits, and position sizing
Enter long when score is strictly greater than the entry gate. Enter short when score is strictly less than one minus the entry gate unless direction is restricted in inputs.
Exit a long when score falls below the exit gate. Exit a short when score rises above one minus the exit gate.
Thermo stops are expressed in AAR units. A long uses the maximum of an initial stop sized by the entry price and AAR and a trail stop that references the running high since entry with a separate multiple. Shorts mirror this with the running low. If the trail is disabled the initial stop is active.
Cooldown is a simple bar counter that begins when the position returns to flat. It prevents immediate re entry in churn.
Dynamic position size is optional. When enabled the order percent of equity scales between a floor and a cap as the score rises above the gate for longs or below the symmetric gate for shorts.
5. Inputs quick guide with recommended ranges
Every input has a tooltip in the script. The same guidance appears here for fast reading.
Core window . Shared lookback for entropy, drift, and tails. Start near 80 on daily charts. Try 60 to 120 on intraday and 80 to 200 for swing.
Entry threshold . Typical range 0.55 to 0.65 for trend following. Faster entries 0.50 to 0.55.
Exit threshold . Typical range 0.35 to 0.50. Lower holds longer yet gives back more.
Weight directional entropy . Starting value 0.40. Raise on markets with clean persistence.
Weight convexity drift . Starting value 0.40. Raise when compounding quality is critical.
Weight tail imbalance . Starting value 0.20. Raise on breakout prone markets.
Tail threshold vs AAR . Typical range 1.0 to 1.5 to count decisive bursts.
Drag penalty . Typical range 0.25 to 0.75. Higher punishes chop more.
Nonlinearity scale . Typical range 0.8 to 2.0. Larger compresses extremes.
AAR floor in percent . Typical range 0.0005 to 0.002 for liquid instruments. This stabilizes the math during quiet regimes.
Adaptive centering . Keep on for most symbols. Center strength 0.40 to 0.70.
Confirm timeframe optional . Leave empty to disable. If used, try a multiple between three and five of the chart timeframe with a blend weight near 0.20.
Dynamic position size . Enable if you want size to reflect certainty. Floor and cap define the percent of equity band. A practical band for many accounts is 0.5 to 2.
Cooldown bars after exit . Start at 3 on daily or slightly higher on shorter charts.
Thermo stop multiple . Start between 1.5 and 3.0 on daily. Adjust to your tolerance and symbol behavior.
Thermo trailing stop and Trail multiple . Trail on locks gains earlier. A trail multiple near 1.0 to 2.0 is common. You can keep trail off and let the exit gate handle exits.
Background heat opacity . Cosmetic. Set to taste. Zero disables it.
6. Properties used on the published chart
The example publication uses BTCUSD on the daily timeframe. The following Properties and inputs are used so everyone can reproduce the same results.
Initial capital 100000
Base currency USD
Order size 2 percent of equity coming from our risk management inputs.
Pyramiding 0
Commission 0.05 percent
Slippage 10 ticks in the publication for clarity. Users should introduce slippage in their own research.
Recalculate after order is filled off. On every tick off.
Using bar magnifier on. On bar close on.
Risk inputs on the published chart. Dynamic position size on. Size floor percent 2. Size cap percent 2. Cooldown bars after exit 3. Thermo stop multiple 2.5. Thermo trailing stop off. Trail multiple 1.
7. Visual elements and alerts
The score is painted as a subtle dot rail near the bottom. A background heat map runs from red to green to convey regime strength at a glance. A compact HUD at the top right shows current score, the three component channels, the active AAR, and the remaining cooldown. Four alerts are included. Long Setup and Short Setup on entry gates. Exit Long by Score and Exit Short by Score on exit gates. You can disable trading and use alerts only if you want the score as a risk switch inside a discretionary plan.
8. How to reproduce the example
Open a BTCUSD daily chart with regular candles.
Add the strategy and load the defaults that match the values above.
Set Properties as listed in section 6.(they are set by default) Confirm that bar magnifier is on and process on bar close is on.
Run the Strategy Tester. Confirm that the trade count is reasonable for the sample. If the count is too low, slightly lower the entry threshold or extend history. If the count is excessively high, raise the threshold or add a small cooldown.
9. Practical tuning recipes
Trend following focus . Raise the entry threshold toward 0.60. Raise the trend weight to 0.50 and reduce tail weight to 0.15. Keep drift near 0.35 to retain the growth filter. Consider leaving the trail off and let the exit threshold manage positions.
Breakout focus . Keep entry near 0.55. Raise tail weight to 0.35. Keep aar_mult near 1.3 so only decisive bursts count. A modest cooldown near 5 can reduce immediate false flips after the first burst bar.
Chop defense . Raise drag multiplier to 0.70. Raise exit threshold toward 0.48 to recycle capital earlier. Consider a higher cooldown, for example 8 to 12 on intraday.
Higher timeframe blend . On a daily chart try a weekly confirm with a blend near 0.20. On a five minute chart try a fifteen minute confirm. This moderates transitions.
Sizing discipline . If you want constant position size, set floor equal to cap. If you want certainty scaling, set a band like 0.5 to 2 and monitor drawdown behavior before widening it.
10. Strengths and limitations
Strengths
Self scaling unit through AAR makes the tool portable across markets and timeframes.
Blends evidence that target different failure modes. Unanimity, growth quality, and impulse flow rarely agree by chance which raises confidence when they align.
Adaptive centering reduces structural bias at the score level which helps during regime flips.
Limitations
In very quiet regimes AAR becomes small even with a floor. If your symbol is thin or gap prone, raise the floor a little to keep stops and drift mapping stable.
Adaptive centering can delay early breakout acceptance. If you miss starts, lower center strength or temporarily disable centering while you evaluate.
Tail counting uses a fixed multiple of AAR. If a market alternates between very calm and very violent weeks, a single aar_mult may not capture both extremes. Sweep this parameter in research.
The engine reacts to realized structure. It does not anticipate scheduled news or liquidity shocks. Use event awareness if you trade around releases.
11. Realism and responsible publication
No promises or projections of performance are made. Past results never guarantee future outcomes.
Commission is set to 0.05 percent per round which is realistic for many crypto venues. Adjust to your own broker or exchange.
Slippage is set at 10 in the publication . Introduce slippage in your own tests or use a percent model.
Position size should respect sustainable risk envelopes. Risking more than five to ten percent per trade is rarely viable. The example uses a fixed two percent position size.
Security calls use lookahead off. Standard candles only. Non standard chart types like Heikin Ashi or Renko are not supported for strategies that submit orders.
12. Suggested research workflow
Begin with the balanced defaults. Confirm that the trade count is sensible for your timeframe and symbol. As a rough guide, aim for at least one hundred trades across a wide sample for statistical comfort. If your timeframe cannot produce that count, complement with multiple symbols or run longer history.
Sweep entry and exit thresholds on a small grid and observe stability. Stability across windows matters more than the single best value.
Try one higher timeframe blend with a modest weight. Large weights can drown the signal.
Vary aar_mult and drag_mult together. This tunes the aggression of breakouts versus defense in chop.
Evaluate whether dynamic size improves risk adjusted results for your style. If not, set floor equal to cap for constancy.
Walk forward through disjoint segments and inspect results by regime. Bootstrapping or segmented evaluation can reveal sensitivity to specific periods.
13. How to read the HUD and heat map
The HUD presents a compact view. Score is the current fused value. Trend is the directional entropy channel. Drift is the compounding quality channel. Tail is the burst flow channel. AAR is the current unit that scales stops and the drift map. CD is the cooldown counter. The background heat is a visual aid only. It can be disabled in inputs. Green zones near the upper band show alignment among the channels. Muted colors near the mid band show uncertainty.
14. Frequently asked questions
Can I use this as a pure indicator . Yes. Disable entries by restricting direction to one side you will not trade and use the alerts as a regime switch.
Will it work on intraday charts . Yes. The AAR unit scales with bar size. You will likely reduce the core window and increase cooldown slightly.
Should I enable the adaptive trail . If you wish to lock gains sooner and accept more exits, enable it. If you prefer to let the exit gate do the heavy lifting, keep it off.
Why do I sometimes see a green background without a position . Heat expresses the score. A position also depends on threshold comparisons, direction mode, and cooldown.
Why is Order size set to one hundred percent if dynamic size is on . The script passes an explicit quantity percent on each entry. That explicit quantity overrides the property. The property is kept at one hundred percent to avoid confusion when users later disable dynamic sizing.
Can I combine this with other tools on my chart . You can, yet for publication the chart is kept clean so users and moderators can see the output clearly. In your private workspace feel free to add other context.
15. Concepts glossary
AAR . Average absolute return across the lookback. Serves as a unit for tails, drift scaling, and stops.
Directional entropy . A measure of uncertainty of up versus down closes. Low entropy paired with a directional sign signals unanimity.
Geometric mean growth . Rate that preserves the effect of compounding over many bars.
Drag . The positive difference between arithmetic pace and geometric growth. Larger drag often signals churn that looks active but fails to compound.
Thermo stops . Stops expressed in the same AAR unit as the signal. They adapt with volatility and keep risk and signal on a common scale.
Adaptive centering . A bias correction that recenters the fused score around neutral so the meter does not drift due to persistent skew.
16. Educational notice and risk statement
Markets involve risk. This publication is for education and research. It does not provide financial advice and it is not a recommendation to buy or sell any instrument. Use realistic costs. Validate ideas with out of sample testing and with conservative position sizing. Past performance never guarantees future results.
17. Final notes for readers and moderators
The goal of this strategy is clarity and portability. Clarity comes from a single score that reflects three independent features of the tape. Portability comes from self scaling units that respect structure across assets and timeframes. The publication keeps the chart clean, explains the math plainly, lists defaults and Properties used, and includes warnings where care is required. The code is protected so the implementation remains consistent for the community while the description remains complete enough for users to understand its purpose and for moderators to evaluate originality and usefulness. If you explore variants, keep them self contained, explain exactly what they contribute, publish in English first, and treat others with respect in the comments.
Load the strategy on BTCUSD daily with the defaults listed above and study how the score transitions across regimes. Then adjust one lever at a time. Observe how the trend channel, the drift channel, and the tail channel interact during starts, pauses, and reversals. Use the alerts as a risk switch inside your own process or let the built in entries and exits run if you prefer an automated study. The intent is not to promise outcomes. The intent is to give you a robust meter for regime strength that travels well across markets and helps you structure decisions with more confidence.
Thank you for your time to read all of this

DNSE VN301!, ADX Momentum StrategyDiscover the tailored Pine Script for trading VN30F1M Futures Contracts intraday.
This strategy applies the Statistical Method (IQR) to break down the components of the ADX, calculating the threshold of "normal" momentum fluctuations in price to identify potential breakouts for entry and exit signals. The script automatically closes all positions by 14:30 to avoid overnight holdings.
www.tradingview.com
Settings & Backtest Results:
- Chart: 30-minute timeframe
- Initial capital: VND 100 million
- Position size: 4 contracts per trade (includes trading fees, excludes tax)
- Backtest period: Sep-2021 to Sep-2025
- Return: over 270% (with 5 ticks slippage)
- Trades executed: 1,000+
- Win rate: ~40%
- Profit factor: 1.2
Default Script Settings:
Calculates the acceleration of changes in the +DI and -DI components of the ADX, using IQR to define "normal" momentum fluctuations (adjustable via Lookback period).
Calculates the difference between each bar’s Open and Close prices, using IQR to define "normal" gaps (adjustable via Lookback period).
Entry & Exit Conditions:
Entry Long: Change in +DI or -DI > Avg IQR Value AND Close Price > Previous Close
Exit Long: (all 4 conditions must be met)
- Change in +DI or -DI > Avg IQR Value
- RSI < Previous RSI
- Close–Open Gap > Avg IQR Gap
- Close Price < Previous Close
Entry Short: Change in +DI or -DI > Avg IQR Value AND Close Price < Previous Close
Exit Short: (all 4 conditions must be met)
- Change in +DI or -DI > Avg IQR Value
- RSI > Previous RSI
- Close–Open Gap > Avg IQR Gap
- Close Price > Previous Close
Disclaimers:
Trading futures contracts carries a high degree of risk, and price movements can be highly volatile. This script is intended as a reference tool only. It should be used by individuals who fully understand futures trading, have assessed their own risk tolerance, and are knowledgeable about the strategy’s logic.
All investment decisions are the sole responsibility of the user. DNSE bears no liability for any potential losses incurred from applying this strategy in real trading. Past performance does not guarantee future results. Please contact us directly if you have specific questions about this script.
