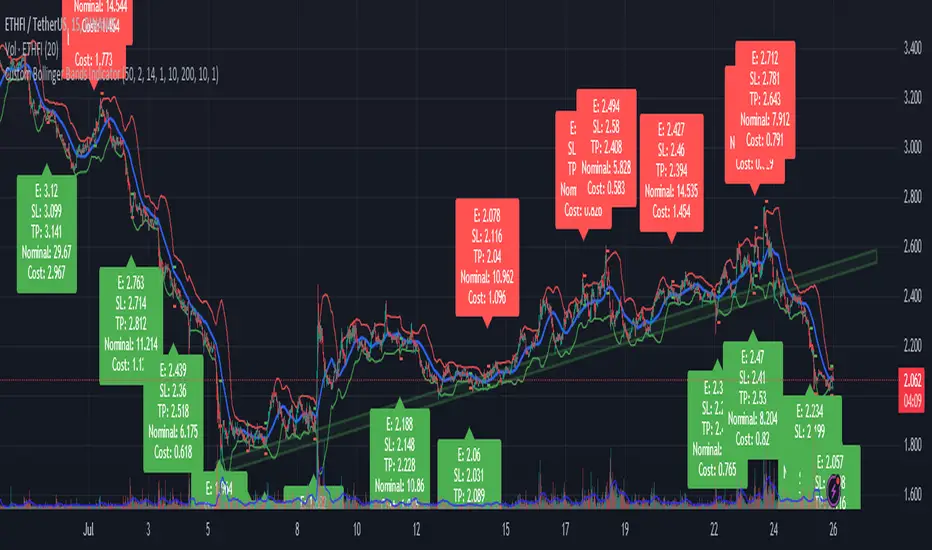
Chieu - Bollinger Bands SMA 50 StrategyOverview
The Custom Bollinger Bands Indicator is a versatile tool designed to help traders identify potential market reversals and optimize their trading strategies. This indicator combines Bollinger Bands with an ATR-based stop-loss mechanism, configurable take-profit levels, and dynamic position sizing to manage risk effectively. By highlighting key market conditions and providing clear visual cues, it enables traders to make informed decisions and execute trades with precision.
Key Features
Bollinger Bands Calculation:
The indicator calculates Bollinger Bands based on a configurable Simple Moving Average (SMA) length.
Standard deviation multiplier is adjustable, allowing traders to fine-tune the width of the bands.
Candlestick Highlighting:
Candles that touch the upper or lower Bollinger Bands are highlighted, indicating potential overbought or oversold conditions.
Reversal candles are identified and highlighted based on specific criteria:
The candle must touch the Bollinger Bands for two consecutive periods.
The reversal candle must have a body at least twice the size of the previous candle's body.
The reversal candle must close in the opposite direction to the previous candle (e.g., a bullish candle following a bearish one).
Stop-Loss and Take-Profit Levels:
Stop-loss levels are calculated using the ATR (Average True Range) indicator, ensuring they are dynamically adjusted based on market volatility.
Two configurable take-profit levels (1R and 2R) are plotted based on the initial risk (distance between entry and stop-loss).
Take-profit and stop-loss lines are visually represented on the chart for easy reference.
Position Sizing and Risk Management:
The indicator includes configurable inputs for account balance, leverage, and risk percentage.
It calculates the nominal value (position size without leverage) and cost value (position size with leverage) based on the specified risk parameters.
Combined labels display SL, TP, nominal value, and cost value, replacing the default "Reversal" text for clear, concise information.
Customization Options:
Users can configure the length of the take-profit lines.
The option to toggle the highlighting of candles touching the Bollinger Bands on or off, while always highlighting the identified reversal candles.
How to Use
Configuration:
Set the desired SMA length and Bollinger Bands multiplier in the input settings.
Configure the ATR length for accurate stop-loss calculations.
Adjust the risk-reward ratio and take-profit line length according to your trading strategy.
Specify your account balance, leverage, and risk percentage for precise position sizing.
Chart Analysis:
Monitor the chart for candles touching the upper or lower Bollinger Bands. These highlights indicate potential overbought or oversold conditions.
Look for highlighted reversal candles, which meet the specified criteria and suggest a potential market reversal.
Use the plotted stop-loss and take-profit lines to manage your trades effectively. The combined labels provide all necessary information (SL, TP, nominal value, and cost value) for quick decision-making.
Execution and Risk Management:
Enter trades based on the reversal candle signals.
Set your stop-loss at the indicated level using the ATR calculation.
Take partial profits at the first take-profit level (1R) and adjust your stop-loss to the entry point to secure the remaining position.
Exit the trade entirely at the second take-profit level (2R) or if the price returns to the adjusted stop-loss level.
"tp"に関するスクリプトを検索
Turbo Oscillator [RunRox]Introducing Turbo Oscillator by RunRox, our new indicator that combines a multitude of useful and unique features, which we will detail in this post.
List of Advanced Technologies:
Real-Time Divergences: Detects discrepancies between price movements and oscillator indicators to forecast potential price reversals.
Real-Time Hidden Divergences: We identify hidden divergences in real-time. These are not the standard type of divergences; they are opposite to regular divergences, providing unique insights into potential market movements.
Overbought and Oversold Zones: Identifies areas where the market is potentially overextended, suggesting possible entry and exit points.
Signal Line: Indicates the market direction, helping traders to quickly understand current trends.
Money Flow Histogram: Shows the flow of money into and out of the market, providing insights into buying and selling pressure.
Predicted Reversal Zones: Pinpoints areas where the market might experience reversals, aiding in strategic planning and risk management. These zones also serve as potential areas for taking profits, enhancing their utility for exit strategy planning.
Customizable Alerts: You can flexibly set up alerts for any events detected by our indicator, ensuring you stay informed about critical market movements.
To begin with, I would like to describe the difference between classic divergences and hidden divergences.
As you can see, these are opposite situations. Our oscillator identifies both types of divergences and displays them in real-time.
Divergences can serve as points where the price might reverse in the opposite direction, making both classic and hidden divergences powerful tools for spotting reversal points. I'll show a few examples of how divergences are used in our oscillator.
Classic Divergences - which we identify in real-time. As you can see, the price often reacts strongly to the formation of these divergences, frequently changing its direction.
Hidden Divergences - we also observe frequent movement in the opposite direction on the chart. The advantage of our indicator is that we show divergences in real-time without delays, allowing you to react immediately to trend changes.
Overbought and Oversold Zones - These zones allow you to see trend changes when the price is clearly overbought or oversold. When the color changes from a contrasting shade to a neutral one, you can observe the trend shift. The lines work by combining the positivity/negativity of the histogram, the positivity/negativity of the signal line, and the direction of the signal line (red/green). This sophisticated interaction provides precise insights into market conditions, making it an invaluable tool for traders.
Signal Line - This provides insights into trend changes and price reversals. The points on the line better indicate the beginning of a trend shift. These points can vary in size, offering a clearer understanding of the strength of the emerging trend. This feature works in combination with RSI, Stochastic, and MFI. RSI and MFI are top-tier indicators, while Stochastic adds responsiveness and sensitivity to trend changes, ensuring you capture every market movement accurately and promptly.
Money Flow Histogram - As shown in the example, our histogram displays the divergence between money flow and the actual price. You can see that while the price is rising, the money flow is decreasing, indicating insufficient demand for the asset and an imminent trend change. This feature uses MFI with an extended period, providing a more comprehensive and accurate analysis of market conditions. The extended period enhances the reliability of the Money Flow Index, making it an essential tool for identifying subtle shifts in market dynamics.
Predicted Reversal Zones - We automatically identify potential price reversal zones and display them above our overbought and oversold zones. In cases of strong overbought or oversold conditions, we detect potential price pullbacks and mark the beginning of a trend change. This helps you better identify trend shifts. We recommend considering these zones as potential take profit points for your trades.
Customizable Alerts - Our flexible alert system allows you to receive notifications only for the events you are interested in. These can include:
1. Classic Divergences
2. Hidden Divergences
3. Overbought or Oversold conditions on the status line
4. Strong Overbought or Oversold conditions on the status line
5. Signals from the signal line
6. Reversal zones in any direction
Our oscillator is a unique indicator that provides a comprehensive understanding of price movements. It can be used as a standalone tool for analyzing price action.
Here are a few examples of using our Oscillator in practice:
In the example above, you can see three conditions that have formed for a potential trade:
1. Clear overbought condition with a formed reversal point.
2. Decreasing Money Flow Index diverging from the rising price.
3. Formed classic divergence.
The entry point could be the formed divergence, while the exit point could be the overbought condition at the bottom of the oscillator along with the reversal points.
Here's another example of using hidden divergence, where you can see three conditions for a potential trade:
1. Overbought zone
2. Formed hidden divergence
3. Start of bearish movement indicated by the signal line
You can enter the trade either when the hidden divergence forms or wait for confirmation of the trend change by the signal line and enter the trade when the corresponding signal forms on the signal line. The exit point could be the opposite reversal point or the formation of a new hidden divergence.
We have demonstrated a few examples of how you can use our indicator, but we are confident that you will find many more applications in your own strategies.
Oscillator offers a variety of customizable parameters to tailor the indicator to your trading preferences. Here’s what our settings include:
Signal Line
Turn On/Off: Enable or disable the signal line.
Length: Set the length period for the signal line calculation.
Smooth: Adjust the smoothing level of the signal line for more accurate display.
Histogram
Turn On/Off: Enable or disable the histogram.
Length: Set the length period for the histogram calculation.
Smooth: Adjust the smoothing level of the histogram.
Other
Show Divergence Line: Display divergence lines on the chart.
Show Hidden Divergence: Display hidden divergences.
Show Status Line: Show the status line indicating overbought or oversold conditions.
Show TP Signal: Display signals for take profit.
Show Reversal Points: Display potential trend reversal points.
Delete Broken Divergence Lines: Remove broken divergence lines from the chart.
Alerts Customization
Signal Line Bull/Bear: Set alerts for bullish or bearish signals from the signal line.
TP Bull/Bear: Set alerts for take profit signals.
Status Bull/Bear: Set alerts for bullish or bearish status conditions.
Status Bull+/Bear+: Set enhanced alerts for stronger bullish or bearish status conditions.
Divergence Bull/Bear: Set alerts for bullish or bearish divergences.
Hidden Divergence Bull/Bear: Set alerts for hidden bullish or bearish divergences.
With these comprehensive settings, you can fine-tune the Oscillator to perfectly fit your trading strategy and preferences.
Our indicator utilizes technologies such as RSI, Stochastic, and Money Flow Index, with numerous enhancements from our team. It includes exclusive features such as real-time detection of hidden and classic divergences, identification of reversal points using our unique methodology, and much more.
Disclaimer:
While we consider our Turbo Oscillator to be an excellent tool, it is important to understand that past performance is not indicative of future results. We recommend approaching market analysis comprehensively, using a combination of tools and techniques to make well-informed trading decisions. Always consider the full range of market data and risks when using any trading indicator.

Volume-Supported Linear Regression Trend Modified StrategyHi everyone, this will be my first published script on Tradingview, maybe more to come.
For quite some time I have been looking for a script that performs no matter if price goes up or down or sideways. I believe this strategy comes pretty close to that. Although nowhere near the so called "buy&hold equity" of BTC, it has produced consistent profits even when price goes down.
It is a strategy which seems to work best on the 1H timeframe for cryptocurrencies.
Just by testing different settings for SL and TP you can customize it for each pair.
THE STRATEGY:
Basically, I used the Volume Supported Linear Regression Trend Model that LonesomeTheBlue has created and modified a few things such as entry and exit conditions. So all credits go to him!
LONG ENTRY: When there is a bullish cross of the short term trend (the histogram/columns), while the long term trend is above 0 and rising.
SHORT ENTRY: When there is a bearish cross (green to red) of the short-term trend (the histogram/columns), while the long term trend is beneath 0 and decreasing.
LONG EXIT: Bearish crossover of short-term trend while long term trend is below 0
SHORT EXIT: Bullish crossover of short-term trend while long term trend is above 0
Combining this with e.g. a SL of 2% and a TP of 20% (as used in my backtesting), combined with pyramiding and correct risk management, it gives pretty consistent results.
Be aware, this is only for educational purpose and in no means financial advise. Past results do not guarantee future results. This strategy can lose money!
Enjoy :)
PS: It works not only on BTC of course, works even better on some other major crypto pairs. I'll leave it to you to find out which ones ;)
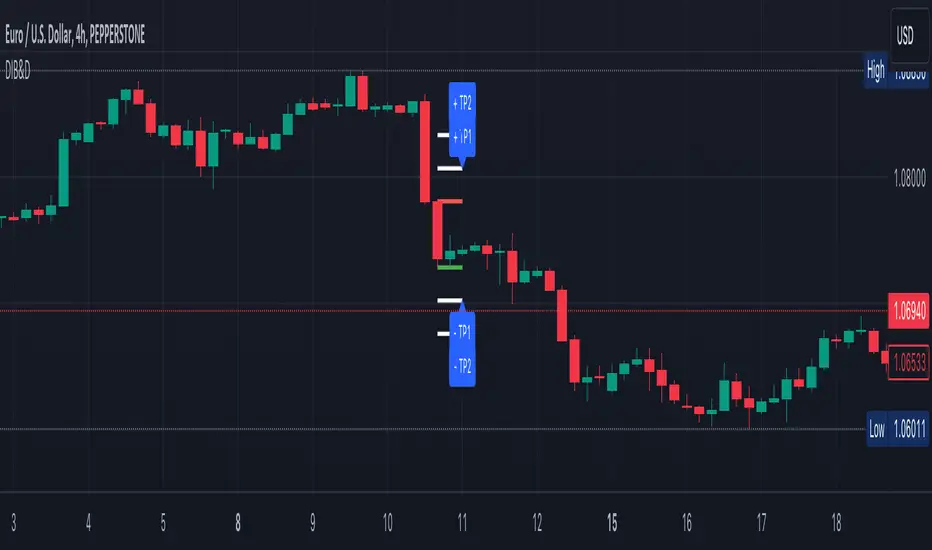
Double Inside bar with drift - by Yasser Mahmoud (YWMAAAWORLD)This is a new indicator that detects double inside bars with the condition that their base bar is either shifted above or below (i.e. both base bar's high and low are higher or lower than the mother bar's high and low respectively)
it plots lines at the top and bottom of the mother bar and 2 TPs above and 2 TPs below.
Strategy / Connectable [Azullian]The connectable strategy serves as a foundational component in our indicator system on TradingView, designed for intuitive testing, visualization, and construction of trading strategies. In concert with the connectable signal filter , it forms a cohesive unit that allows for efficient signal processing and strategy implementation. This integration enables the strategy to receive and act on weighted signals from various connectable indicators, making it a versatile tool for both novice and experienced traders.
Let's review the separate parts of this indicator.
█ STRATEGY INPUTS
We've provided an input to connect a signal filter or indicators or chains (→) which is set to 'Close' by default.
An input has several controls:
• Input: Connect indicators or signal filter here, choose indicators with a compatible : Signal connector.
• SM - Signal Mode: Choose a trading direction compatible with the settings in your signal filter
█ POSITION INVESTMENT
Determine the percentage of your trading budget you would like to use in each position based on the strategy's profit or loss.
• LINVB - Loss Investment Base: Choose which base to use to determine the investment percentage when the strategy is in a loss.
○ Equity: Use the equity as the base for percentage calculation.
○ Initial capital: Use the initial capital as the base for percentage calculation.
• LINV% - Loss Investment Percentage: Set a percentage of the chosen investment base as the investment for a new position.
○ For example, when 10% in loss, and a initial capital of $100, and the investment base is set to equity with a percentage of 50%, your investment will be 50% of $90, $45.
• PINVB - Profit Investment Base: Choose which base to use to determine the investment percentage when the strategy is in profit.
○ Equity: Use the equity as the base for percentage calculation.
○ Initial capital: Use the initial capital as the base for percentage calculation.
• PINV% - Profit Investment Percentage: Set a percentage of the chosen investment base as the investment for a new position.
○ For example, when 10% in profit, and an initial capital of $100, and the investment base is set to equity with a percentage of 100%, your investment will be 100% of $110, $110.
• RISK% - Risk Percentage:
○ Determine how much of the calculated position investment is at risk when the stop-loss is hit.
- For example, 1% of $45 represents a maximum loss of $0.45.
○ Risk percentage works together with the stop loss and the max leverage.
• MXLVG - Maximum Leverage:
○ Investigate the trading rules for your trading pair and use the maximum allowed amount of leverage.
○ To determine the number of contracts to be bought or sold, considering the stop loss and the specified risk percentage, the maximum leverage available will constrain the amount of leverage utilized to ensure that the maximum risk threshold is not exceeded. For instance, suppose the stop loss is set at 1%, and the risk percentage is defined as 10%. Initially, the calculated leverage to be used would be 10. However, if there is a maximum leverage cap set at 5, it would constrain the calculated leverage of 10 to adhere to the maximum limit of 5.
█ EXIT STOP LOSS
Determine the Stop Loss price based on your selected configuration.
As the stop loss is an integral part of the ordered contracts calculation used in conjunction with the Risk and Max leverage, you'll always need to provide a stop loss price.
• SLB - Stop Loss Base: Choose a stop loss mode for calculating stop loss prices.
○ Risk: Determines the price using the Risk parameter (RISK%) and maximum leverage (MXLVG). In this case, SLB% will not have any impact.
○ Price Entry + Offset: Calculates the stop loss price based on a offset percentage (SLB%) from the entry price of the position.
• SLB% - Stop Loss Base Percentage: Define an offset percentage that will be applied in the price entry + offset stop loss mode.
• SLT - Stop Loss Trailing:
○ Fixed: The initial stop loss will be kept and no trailing stop loss will be applied.
○ Trail Price: Computes the trailing stop loss price based on an offset percentage (SLT%) from the closing price of the current candle.
- If a better stop loss price is calculated, it will be set as the new stop loss price.
○ Trail Incr: Adapts the trailing stop loss price based on the offset percentage (SLT%).
- Each price change in favor of your position will incrementally adapt the trailing stop loss with SLT%.
• SLT% - Stop Loss Trailing Percentage: This percentage serves as an offset or increment depending on your chosen trailing mode.
█ EXIT TAKE PROFIT
Determine the Take Profit price based on your selected configuration.
• TPB - Take Profit Base: Choose a take profit mode for calculating take profit prices.
○ Reward: Determines the take profit price using the Risk parameter (RISK%) and the calculated Stop Loss price and the set reward percentage (TPB%).
- For example: Risk 1%, Calculated Stop loss price: $90, Entry price: $100, Reward (TPB%): 2%, will result in a take profit price on $120.
○ Price Entry + Offset: Calculates the take profit price based on a offset percentage (TPB%) from the entry price of the position.
- For example: Entry price: $100, Offset (TPB%): 2%, will result in a take profit price on $102.
• TPB% - Take Profit Base Percentage: Define an offset percentage that will be applied in the price entry + offset take profit mode.
• TPT - Take Profit Trailing:
○ Fixed: The initial take profit will be kept and no trailing take profit will be applied.
○ Trail Price: Computes the trailing take profit price based on an offset percentage (TPT%) from the closing price of the current candle.
- If an applicable take profit price is calculated, it will be set as the new take profit price.
○ Trail Incr: Adapts the trailing take profit price based on the offset percentage (TPT%). Each price change against your position will incrementally adapt the trailing take profit with TPT%.
• TPT% - Take Profit Trailing Percentage: This percentage serves as an offset or increment depending on your chosen trailing mode.
█ STRATEGY CONDITIONS
Specify when the strategy is permitted to execute trades.
• DATE: Enable the Date Range filter to restrict entries to a specific date range.
○ START: Set a start date and hour to commence trading.
○ END: Set an end date and hour to conclude trading within the defined range.
■ VISUALS
• LINE: Activate a colored dashed diagonal line to visually connect the entry and exit points of positions.
• SLTP: Enable visualization of stop loss, take profit, and break-even levels.
• PNL: Enable Break-Even and Close Lines along with a colored area in between to visualize profit and loss.
• ☼: Brightness % : Adjust the opacity of the plotted trading visuals.
• P - Profit Color : Choose the color for profit-related elements.
• L - Loss Color: Choose the color for loss-related elements.
• B - Breakeven Color : Select the color for break-even points.
• EL - Long Color: Specify the color for long positions.
• ES - Short Color: Specify the color for short positions.
• TRADE LABELING: For better analysis we've labeled all entries and exits conform with the type of order your strategy has executed, some examples:
○ XL-TP-150: Exit Long - Take Profit - Position 150
○ XS-TP-154: Exit Short - Take Profit - Position 154
○ XL-SL-160: Exit Long - Stop Loss - Position 160
○ XS-SL-164: Exit Short - Stop Loss - Position 164
█ USAGE OF CONNECTABLE INDICATORS
■ Connectable chaining mechanism
Connectable indicators can be connected directly to the signal monitor, signal filter or strategy , or they can be daisy chained to each other while the last indicator in the chain connects to the signal monitor, signal filter or strategy. When using a signal filter you can chain the filter to the strategy input to make your chain complete.
• Direct chaining: Connect an indicator directly to the signal monitor, signal filter or strategy through the provided inputs (→).
• Daisy chaining: Connect indicators using the indicator input (→). The first in a daisy chain should have a flow (⌥) set to 'Indicator only'. Subsequent indicators use 'Both' to pass the previous weight. The final indicator connects to the signal monitor, signal filter, or strategy.
■ Set up the strategy with a signal filter and an RSI indicator
Let's connect the Strategy to a connectable signal filter and a connectable RSI indicator :
1. Load all relevant indicators
• Load RSI / Connectable
• Load Signal filter / Connectable
• Load Strategy / Connectable
2. Signal Filter: Connect the RSI to the Signal Filter
• Open the signal filter settings
• Choose one of the three input dropdowns (1→, 2→, 3→) and choose : RSI / Connectable: Signal Connector
• Toggle the enable box before the connected input to enable the incoming signal
3. Signal Filter: Update the filter signals settings if needed
• The default settings of the filter enable EL (Enter Long), XL (Exit Long), ES (Enter Short) and XS (Exit Short).
4. Signal Filter: Update the weight threshold settings if needed
• All connectable indicators load by default with a score of 6 for each direction (EL, XL, ES, XS)
• By default, weight threshold (TH) is set at 5. This allows each occurrence to score, as the default score in each connectable indicator is 1 point above the threshold. Adjust to your liking.
5. Strategy: Connect the strategy to the signal filter in the strategy settings
• Select the strategy input → and select the Signal filter: Signal connector
6. Strategy: Enable filter compatible directions
• Set the signal mode of the strategy to a compatible direction with the signal filter.
Now that everything is connected, you'll notice green spikes in the signal filter representing long signals, and red spikes indicating short signals. Trades will also appear on the chart, complemented by a performance overview. Your journey is just beginning: delve into different scoring mechanisms, merge diverse connectable indicators, and craft unique chains. Instantly test your results and discover the potential of your configurations. Dive deep and enjoy the process!
█ BENEFITS
• Adaptable Modular Design: Arrange indicators in diverse structures via direct or daisy chaining, allowing tailored configurations to align with your analysis approach.
• Streamlined Backtesting: Simplify the iterative process of testing and adjusting combinations, facilitating a smoother exploration of potential setups.
• Intuitive Interface: Navigate TradingView with added ease. Integrate desired indicators, adjust settings, and establish alerts without delving into complex code.
• Signal Weight Precision: Leverage granular weight allocation among signals, offering a deeper layer of customization in strategy formulation.
• Advanced Signal Filtering: Define entry and exit conditions with more clarity, granting an added layer of strategy precision.
• Clear Visual Feedback: Distinct visual signals and cues enhance the readability of charts, promoting informed decision-making.
• Standardized Defaults: Indicators are equipped with universally recognized preset settings, ensuring consistency in initial setups across different types like momentum or volatility.
• Reliability: Our indicators are meticulously developed to prevent repainting. We strictly adhere to TradingView's coding conventions, ensuring our code is both performant and clean.
█ COMPATIBLE INDICATORS
Each indicator that incorporates our open-source 'azLibConnector' library and adheres to our conventions can be effortlessly integrated and used as detailed above.
For clarity and recognition within the TradingView platform, we append the suffix ' / Connectable' to every compatible indicator.
█ COMMON MISTAKES AND CLARIFICATIONS
• Removing an indicator from a chain: Deleting a linked indicator and confirming the "remove study tree" alert will also remove all underlying indicators in the object tree. Before removing one, disconnect the adjacent indicators and move it to the object stack's bottom.
• Point systems: The azLibConnector provides 500 points for each direction (EL: Enter long, XL: Exit long, ES: Enter short, XS: Exit short) Remember this cap when devising a point structure.
• Flow misconfiguration: In daisy chains the first indicator should always have a flow (⌥) setting of 'indicator only' while other indicator should have a flow (⌥) setting of 'both'.
• Recalculate: While this strategy has undergone extensive testing, enabling recalculation options like 'After order is filled' or 'On every tick' may lead to unexpected behavior.
• Fill orders: The strategy is thoroughly tested, yet enabling fill order options such as 'Using bar magnifier', 'On bar close', or 'Using standard OHLC' might result in unexpected outcomes.
• Layout and abbreviations: To maintain a consistent structure, we use abbreviations for each input. While this may initially seem complex, you'll quickly become familiar with them. Each abbreviation is also explained in the inline tooltips.
• Optimized for crypto trading: While many principles are common across markets, this strategy is specifically optimized and tested for crypto trading.
• Inputs: Connecting a connectable indicator directly to the strategy delivers the raw signal without a weight threshold, meaning every signal will trigger a trade.
█ A NOTE OF GRATITUDE
Through years of exploring TradingView and Pine Script, we've drawn immense inspiration from the community's knowledge and innovation. Thank you for being a constant source of motivation and insight.
█ RISK DISCLAIMER
Azullian's content, tools, scripts, articles, and educational offerings are presented purely for educational and informational uses. Please be aware that past performance should not be considered a predictor of future results.

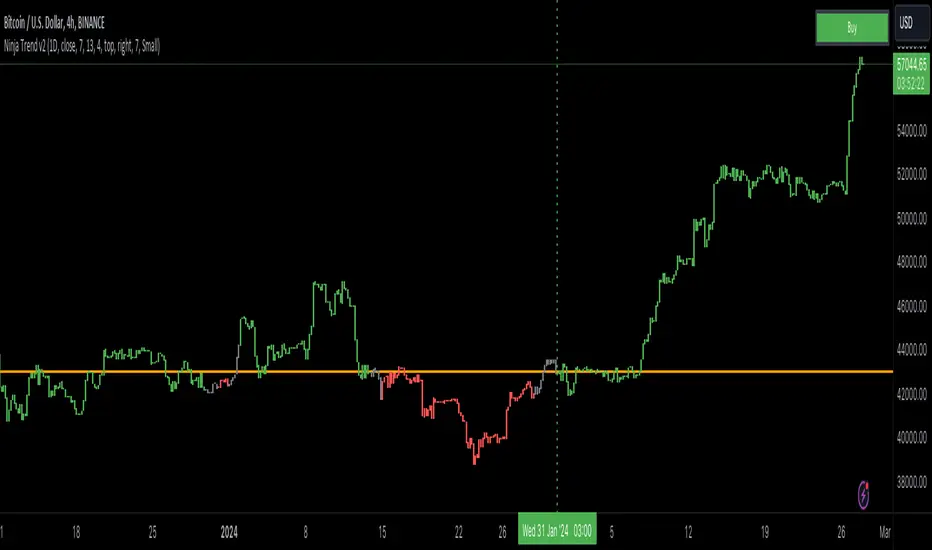
Ninja Trend v2Ninja Trend V2 is best for swing, day trading and scalping using higher timeframe bias and executing in the lower timeframes. Uses MACD for the overall bias and paints a Heikin-Ashi chart.
Settings:
Firstly, go to chart settings, check (tick) the body, uncheck borders and wicks.
Secondly, go to the script settings and input the following;
Source close
Fast moving average 7
Slow moving average 13
Signal length 4
For day trading and scalping, change the script settings timeframe to 15 minutes and use a smaller chart timeframe (M5 or M1)
For swinging change the script settings timeframe to Daily and use H4 chart timeframe.
Behind the code:
When the higher timeframe MACD histogram crosses and closes above zero line, script goes to neutral and paints grey bars waiting for the signal line to cross and close above the zero line and then paints green bars and a buy signal is generated.
When the higher timeframe MACD histogram crosses and closes below zero line, script goes to neutral and paints grey bars waiting for the signal line to cross and close below the zero line and then paints red bars.
Advantage of this is to filter out the chart noise by painting Heikin Ashi charts.
Signals:
Grey means neutral. No entries should be made.
Red means sells only. And then hold until the trend changes to green or use your desired TP and SL.
Green means buys only. And then hold until the trend changes to red or use your desired TP and SL.
Session Sweeps [LuxAlgo]The Session Sweeps indicator combines ICT-based features for a complete trading methodology involving market sessions, market structure, and fair value gaps to find optimal entry conditions for trading price action.
Traders frequently tend to place stop/limit orders at the high and low points of major trading sessions such as Asian (Tokyo), European (London), and North American (New York), resulting in the establishment of liquidity pools at those particular levels. The Session Sweeps indicator is crafted to recognize and underscore occurrences of session sweeps or liquidity sweeps during these major trading sessions.
🔶 USAGE
Default settings utilize major forex trading sessions, yet users can select their preferred opening and closing times, rename the sessions, or adjust the colors. It's important to note that the specified times for each session align with the respective local timezones: Asian (Tokyo) UTC+9, European (London) UTC, and North American (New York) UTC-5.
If the price briefly crosses either the highest or lowest point of a market session. These movements, aiming at triggering stop losses, suggest potential shifts in the market direction. Detecting such movements is the fundamental purpose and core functionality of the script.
🔹Market Structure Shifts
A Market Structure Shift refers to a change in market direction, either from an uptrend to a downtrend or vice versa. A part of a common entry model when using session sweeps is waiting for the formation of a CHoCH after a session sweep.
🔹Fair Value Gaps
A Fair Value Gap (FVG) holds particular appeal for price action traders, emerging when there are inefficiencies or imbalances in the market, often a result of uneven buying and selling activity. The underlying concept of FVGs is that the market tends to revisit these inefficiencies before resuming its trajectory in alignment with the initial impulsive move.
After the formation of a CHoCH traders can enter a position when the price enters the area of a Fair Value Gap (FVG).
🔹Setup Examples
This entry setup is commonly used by ICT traders and is shared for informational & educational purposes only.
Long Positions (5-Minute Timeframe):
Wait for the previous session's low to be swept.
Look for a Bullish Choch.
Find a Bullish FVG formed by or before the Choch.
Entry Point: At the FVG.
Take Profit (TP): At the session high or aim for a 1:2 Risk-Reward Ratio.
Stop Loss (SL): At the session low or nearest Swing Low.
Take partial profits at intermediate swings, but don’t shift SL prematurely.
Short Positions (5-Minute Timeframe):
Wait for the previous session's high to be swept.
Look for a Bearish Choch.
Find a FVG formed by or before the Choch.
Entry Point: At the FVG.
Take Profit (TP): At the previous session's low or aim for a 1:2 RR.
Stop Loss (SL): At the session high or nearest Swing High.
Take partial profits at intermediate swings, but don’t shift SL prematurely.
🔶 SETTINGS
🔹Session Sweeps
Buyside Sweep Zones, Color, and Margin: toggles the visibility of bullside sweep zones, customizes the associated color, and sets the margin value defining the range of a bullside sweep zone.
Sellside Sweep Zones, Color, and Margin: toggles the visibility of sell-side sweep zones, customizes the associated color, and sets the margin value defining the range of a sell-side sweep zone.
Sweep Margin Length: specifies the maximum allowed length of a sweep zone invalidation, the length over which the price slightly invalidated the margin range.
Detect Sweeps Once per Session: if enabled will detect only once a sweep zone within a session.
Hide Fake Sweep Zones, and Color: controls the visibility and color of the fake sweep zones.
🔹Sessions
Session (Asia, London, New York AM, and New York PM), Start Time, and End Time: enables or disables the visibility of the named market session range, and customization of the session hours.
Color: color customization option of the named session.
Extend Max/Min: extends the highest and lowest price levels of the named session until the end of the next enabled session. This option is recommended to be enabled when sweep zone detection is activated to observe the relationship between the sweep zone and previous session extreme levels.
Extend Mid: extends the mean price levels of the named session until the end of the next enabled session. The extended line may serve as potential support and resistance levels.
Fill: enables/disables background coloring of the named session.
New York DST | London DST: enabling this option initiates Daylight Saving Time (DST) for New York or London. Note: Daylight Saving Time is not applied to the Asian (Tokyo) session.
Sessions Extreme Lines | Sessions Names: toggles the visibility of the highest and lowest price levels, as well as the names, for all market sessions.
Session Lines Width: sets the width of the lines for all sessions.
Session Fill Transparency: sets the background color transparency of the range for all sessions.
🔹Market Structure Shifts
Market Structure Shifts: toggles the visibility of market structure shifts, also known as change of character (CHoCH).
Detection Length: specifies the detection length.
Market Structure Shifts; Bull & Bear: color customization options.
🔹Fair Value Gaps
Fair Value Gaps: toggles the visibility of the fair value gaps.
Fair Value Gap Width Filter: specifies the filtering multiplier; additional details can be found in the tooltip of the respective input option.
Bullish & Bearish Imbalance: color customization options.
🔹Sessions Tabular View
Sessions Tabular View: toggles the visibility of the tabular view of the sessions, displaying date &time, status, and countdown counter.
Hide if not Forex Market Instrument: checks the market and automatically enables/disables the option based on the market instrument.
Table Text Size & Position: size and placement customization options
🔶 LIMITATIONS
Please be aware that fair value gap filtering cannot be applied to the initial 144 candles (with a fixed-length ATR) as the ATR value necessary for filtering won't be available during this period.
🔶 RELATED SCRIPTS
Buyside-Sellside-Liquidity
Sessions
Liquidity-Voids-FVG
Thank you to our community for the recommendation of this script. To explore additional conceptual scripts and related content, we invite you to visit >>> LuxAlgo-Scripts .

EUR/USD 45 MIN Strategy - FinexBOTThis strategy uses three indicators:
RSI (Relative Strength Index) - It indicates if a stock is potentially overbought or oversold.
CCI (Commodity Channel Index) - It measures the current price level relative to an average price level over a certain period of time.
Williams %R - It is a momentum indicator that shows whether a stock is at the high or low end of its trading range.
Long (Buy) Trades Open:
When all three indicators suggest that the stock is oversold (RSI is below 25, CCI is below -130, and Williams %R is below -85), the strategy will open a buy position, assuming there is no current open trade.
Short (Sell) Trades Open:
When all three indicators suggest the stock is overbought (RSI is above 75, CCI is above 130, and Williams %R is above -15), the strategy will open a sell position, assuming there is no current open trade.
SL (Stop Loss) and TP (Take Profit):
SL (Stop Loss) is 0.45%.
TP (Take Profit) is 1.2%.
The strategy automatically sets these exit points as a percentage of the entry price for both long and short positions to manage risks and secure profits. You can easily adopt these inputs according to your strategy. However, default settings are recommended.

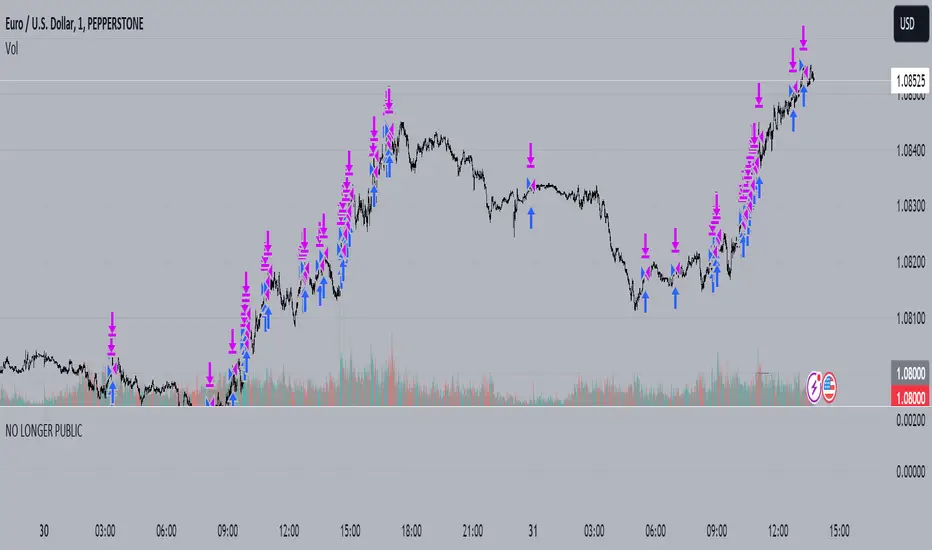
Strong Pullback Indicator [Rami_LB]Strong Pullback Indicator
Description:
The Strong Pullback Indicator is designed to identify potential pullbacks or even trend reversals by utilizing a specific candlestick pattern in conjunction with the Relative Strength Index (RSI). It is advised to employ this indicator in chart intervals of 15 minutes or higher, as intervals below 15 minutes may generate excessive false signals.
Working Mechanism:
Upon detecting the designated candlestick pattern, the indicator examines whether any of the last five candles exhibit RSI values below 30 or above 70 across at least four distinct time intervals, depending on whether the pattern is bullish or bearish. The RSI calculations incorporate eight different intervals: 1 minute (1m), 5 minutes (5m), 15 minutes (15m), 30 minutes (30m), 1 hour (1h), 2 hours (2h), 4 hours (4h), and 1 day (1d). An arrow is rendered above or below the current candle only when these conditions are met.
Users have the option to adjust the number of overbought or oversold intervals, as well as the general settings for the RSI.
SL/TP Lines:
The indicator can also serve as a trade signal to initiate trades in the opposite direction. To evaluate the potential success of a trade in a backtesting scenario, SL (Stop Loss) and TP (Take Profit) lines can be displayed on the chart. The SL is calculated by taking the distance from the close of the current candle to the high/low of the previous candle and multiplying it by 2.
In the settings, you can alter the Risk Reward Ratio (RRR) of the trade. Given the pullback nature of this indicator, a RRR of 1:1 is deemed logical, thus set as the default value.
Bullish vs. Bearish Candle Counter:
An additional feature of this indicator is its ability to analyze the last 100 candles to ascertain the ratio of bullish to bearish candles. When a 60% threshold is reached, the chart background color alters accordingly. This feature was conceived after a thorough analysis of over 50,000 candles of a currency pair revealed nearly identical counts of bullish and bearish candles, suggesting a market tendency to maintain this balance.
Within the settings, you have the flexibility to modify the number of candles to be analyzed and the percentage threshold for each candle type.
Should you have any ideas on how to enhance the accuracy of this indicator, or suggestions for other indicators that could improve the signals, feel free to leave a comment.

Engulfing with TrendThe script above is a trading strategy with rules based on the Engulfing candlestick pattern within the context of the trend. Some key elements of this script include:
1. ATR (Average True Range) settings to measure market volatility.
2. Supertrend settings to identify the market trend.
3. Conditions for determining uptrend and downtrend.
4. Determination of Bullish (Engulfing pattern during uptrend) and Bearish (Engulfing pattern during downtrend).
5. Calculation of Stop Loss (SL) and Take Profit (TP) levels based on the Engulfing pattern.
6. Entry conditions based on the Engulfing pattern and the corresponding trend.
7. Exit conditions based on price crossovers with SL and TP levels.
8. Plotting of the Engulfing patterns on the chart.
This strategy is used to identify trading opportunities based on Engulfing candlestick patterns that align with the direction of the market trend. Additionally, stop loss and take profit levels are calculated based on the Engulfing pattern, and trading signals are displayed on the chart.
It's important to note that this script can be customized according to your trading preferences and strategy.

Risk Reward Optimiser [ChartPrime]█ CONCEPTS
In modern day strategy optimization there are few options when it comes to optimizing a risk reward ratio. Users frequently need to experiment and go through countless permutations in order to tweak, adjust and find optimal in their data.
Therefore we have created the Risk Reward Optimizer.
The Risk Reward Optimizer is a technical tool designed to provide traders with comprehensive insights into their trading strategies.
It offers a range of features and functionalities aimed at enhancing traders' decision-making process.
With a focus on comprehensive data, it is there to help traders quickly and efficiently locate Risk Reward optimums for inbuilt of custom strategies.
█ Internal and external Signals:
The script can optimize risk to reward ratio for any type of signals
You can utilize the following :
🔸Internal signals ➞ We have included a number of common indicators into the optimizer such as:
▫️ Aroon
▫️ AO (Awesome Oscillator)
▫️ RSI (Relative Strength Index)
▫️ MACD (Moving Average Convergence Divergence)
▫️ SuperTrend
▫️ Stochastic RSI
▫️ Stochastic
▫️ Moving averages
All these indicators have 3 conditions to generate signals :
Crossover
High Than
Less Than
🔸External signal
▫️ by incorporating your own indicators into the analysis. This flexibility enables you to tailor your strategy to your preferences.
◽️ How to link your signal with the optimizer:
In order to be able to analysis your signal we need to read it and to do so we would need to PLOT your signal with a defined value
plot( YOUR LONG Condition ? 100 : 0 , display = display.data_window)
█ Customizable Risk to Reward Ratios:
This tool allows you to test seven different customizable risk to reward ratios , helping you determine the most suitable risk-reward balance for your trading strategy. This data-driven approach takes the guesswork out of setting stop-loss and take-profit levels.
█ Comprehensive Data Analysis:
The tool provides a table displaying key metrics, including:
Total trades
Wins
Losses
Profit factor
Win rate
Profit and loss (PNL)
This data is essential for refining your trading strategy.
🔸 It includes a tooltip for each risk to reward ratio which gives data for the:
Most Profitable Trade USD value
Most Profitable Trade % value
Most Profitable Trade Bar Index
Most Profitable Trade Time (When it occurred)
Position and size is adjustable
█ Visual insights with histograms:
Visualize your trading performance with histograms displaying each risk to reward ratio trade space, showing total trades, wins, losses, and the ratio of profitable trades.
This visual representation helps you understand the strengths and weaknesses of your strategy.
It offers tooltips for each RR ratio with the average win and loss percentages for further analysis.
█ Dynamic Highlighting:
A drop-down menu allows you to highlight the maximum values of critical metrics such as:
Profit factor
Win rate
PNL
for quick identification of successful setups.
█ Stop Loss Flexibility:
You can adjust stop-loss levels using three different calculation methods:
ATR
Pivot
VWAP
This allows you to align risk-reward ratios with your preferred risk tolerance.
█ Chart Integration:
Visualize your trades directly on your price chart, with each trade displayed in a distinct color for easy tracking.
When your take-profit (TP) level is reached , the tool labels the corresponding risk-reward ratio for that specific TP, simplifying trade management.
█ Detailed Tooltips:
Tooltips provide deeper insights into your trading performance. They include information about the most profitable trade, such as the time it occurred, the bar index, and the percentage gain. Histogram tooltips also offer average win and loss percentages for further analysis.
█ Settings:
█ Code:
In summary, the Risk Reward Optimizer is a data-driven tool that offers traders the ability to optimize their risk-reward ratios, refine their strategies, and gain a deeper understanding of their trading performance. Whether you're a day trader, swing trader, or investor, this tool can help you make informed decisions and improve your trading outcomes.

Engulfing and emaThis is a Pine Script script that helps you see the Engulfing Candlestick and Inside Bar (Boring Candle) candle patterns on the TradingView chart, as well as drawing two Exponential Moving Averages (EMA). Here's a simple explanation:
1. **Candle Pattern**:
- This script identifies the Engulfing Candlestick pattern, which indicates potential changes to the price. If this pattern is detected, the script will show a green (for buy) or red (for sell) arrow above or below that candle.
- The script also identifies the Inside Bar (Boring Candle), which indicates the period area in the market. This candle will be the color you choose (default is orange).
2. **Moving Average (EMA)**:
- This script also plots two Exponential Moving Averages (EMA) on the chart. EMA is a tool that helps you see price trends more clearly.
3. **Risk Management**:
- This script calculates the Stop Loss (SL) and Take Profit (TP) levels for each Engulfing pattern. This helps you manage your trading risks.
- Labels are displayed on the charts for SL and TP, so you know where to place them.
With the help of this script, you can easily identify important patterns in the market and manage your risks better. Make sure to choose a demo account before using it in real trading.

TradeLibrary "Trade"
A Trade Tracking Library
Monitor conditions with less code by using Arrays. When your conditions are met in chronologically, a signal is returned and the scanning starts again.
Create trades automatically with Stop Loss, Take Profit and Entry. The trades will automatically track based on the market movement and update when the targets are hit.
Sample Usage
Enter a buy trade when RSI crosses below 70 then crosses above 80 before it crosses 40.
Note: If RSI crosses 40 before 80, No trade will be entered.
rsi = ta.rsi(close, 21)
buyConditions = array.new_bool()
buyConditions.push(ta.crossunder(rsi, 70))
buyConditions.push(ta.crossover(rsi, 80))
buy = Trade.signal(buyConditions, ta.crossunder(rsi, 40))
trade = Trade.new(close-(100*syminfo.mintick), close +(200*syminfo.mintick), condition=buy)
plot(trade.takeprofit, "TP", style=plot.style_circles, linewidth=4, color=color.lime)
alertcondition(trade.tp_hit, "TP Hit")
method signal(conditions, reset)
Signal Conditions
Namespace types: bool
Parameters:
conditions (bool )
reset (bool)
Returns: Boolean: True when all the conditions have occured
method update(this, stoploss, takeprofit, entry)
Update Trade Parameters
Namespace types: Trade
Parameters:
this (Trade)
stoploss (float)
takeprofit (float)
entry (float)
Returns: nothing
method clear(this)
Clear Trade Parameters
Namespace types: Trade
Parameters:
this (Trade)
Returns: nothing
method track(this, _high, _low)
Track Trade Parameters
Namespace types: Trade
Parameters:
this (Trade)
_high (float)
_low (float)
Returns: nothing
new(stoploss, takeprofit, entry, _high, _low, condition, update)
New Trade with tracking
Parameters:
stoploss (float)
takeprofit (float)
entry (float)
_high (float)
_low (float)
condition (bool)
update (bool)
Returns: a Trade with targets and updates if stoploss or takeprofit is hit
new()
New Empty Trade
Returns: an empty trade
Trade
Fields:
stoploss (series__float)
takeprofit (series__float)
entry (series__float)
sl_hit (series__bool)
tp_hit (series__bool)
open (series__integer)

Impulse MACD buy OwlPixelDescription:
The Impulse MACD Buy Indicator, developed by OwlPixel, is a powerful trading tool for traders using TradingView's Pine Script version 5. This indicator aims to provide valuable insights for identifying potential buy signals in the market using the popular MACD (Moving Average Convergence Divergence) oscillator.
Key Features:
MACD Analysis: The indicator displays the MACD line (blue) and the signal line (orange) on the chart, helping traders assess the momentum and trend direction of an asset.
Impulse Histo: The Impulse Histo (blue histogram) visualizes the difference between the MACD line and the signal line, making it easier to spot changes in market strength and potential trend reversals.
Impulse MACD CD Signal: This histogram (maroon color) highlights the divergence between the Impulse Histo and the signal line, providing further insights into trend shifts.
Background Boxes: The indicator features three rows of different colored background boxes that represent distinct market conditions - an uptrend (light green), a downtrend (light red), and a neutral trend (light yellow).
Crossover Points: Buy signals are marked with green circles when the MACD line crosses above the signal line, suggesting potential entry points for long positions.
Demand and Supply Bars: The demand (lime/green) and supply (red/orange) bars are intensified, aiding traders in identifying possible reversal areas.
Stop Loss and Take Profit:
The Impulse MACD Buy Indicator automatically calculates Stop Loss (SL) and Take Profit (TP) levels for buy signals. The SL level is set at the highest of the last three candles, while the TP level is determined by a user-defined percentage of the closing price. This information helps traders manage risk and optimize their profit potential.
Usage:
Apply the Impulse MACD Buy Indicator to your TradingView chart by copying the provided Pine Script into the Pine Editor.
Configure the input parameters, such as the MA Length and Signal Length, to suit your trading preferences.
Observe the MACD line, signal line, and histograms to gain insights into market momentum and trends.
Identify buy signals when the MACD line crosses above the signal line, signaled by green circles.
Utilize the provided Stop Loss and Take Profit levels for risk management and exit strategies.
Please note that this indicator is for informational purposes only and should be used in conjunction with other analysis techniques to make well-informed trading decisions. Happy trading!
Risk to Reward - FIXED SL BacktesterDon't know how to code? No problem! TradingView is an excellent platform for you. ✅ ✅
If you have an indicator that you want to backtest using a risk-to-reward ratio or fixed take profit/stop loss levels, then the Risk to Reward - FIXED SL Backtester script is the perfect solution for you.
introducing Risk to Reward - FIXED SL Backtester Script which will allow you to test any indicator / Signal with RR or Fixed SL system
How does it work ?!
Once you connect the script to your indicator, it will analyze your entry points and perform calculations based on them. It will then open trades for you according to the specified inputs in the script settings.
HOW TO CONNECT IT to your indicator?
simply open your indicator code and add the below line of code to it
plot(Signal ? 100 : 0,"Signal",display = display.data_window)
Replace Signal with the long condition from your own indicator. You can also modify the value 100 to any number you prefer. After that, open the settings.
Once the script is connected to your indicator, you can choose from two options:
Risk To Reward Ratio System
Fixed TP/ SL System
🔸if you select the Risk to Reward System ⤵️
The Risk-to-Reward System requires the calculation of a stop loss. That's why I have included three different types of stop-loss calculations for you to choose from:
ATR Based SL
Pivot Low SL
VWAP Based SL
Your stop loss and take profit levels will be automatically calculated based on the selected stop loss method and your risk-to-reward ratio.
You can also adjust their values to match your desired risk level. The trades will be displayed on the chart.
with the ability to change their values to match your risk.
once this is done, trades will be displayed on the chart
🔸if you select the Fixed system ⤵️
You have 2 inputs, which are FIXED TP & Fixed SL
input the values you want, and trades will be on your chart...
I have also added a Breakeven feature for you.
with this Breakeven feature the trade will not just move SL to Entry ?! NO NO, it will place it above entry by a % you input yourself, so you always win! 🚀
Here is an example
Enjoy, and have fun, if you have any questions do not hesitate to ask

ATR GOD Strategy by TradeSmart (PineConnector-compatible)This is a highly-customizable trading strategy made by TradeSmart, focusing mainly on ATR-based indicators and filters. The strategy is mainly intended for trading forex , and has been optimized using the Deep Backtest feature on the 2018.01.01 - 2023.06.01 interval on the EUR/USD (FXCM) 15M chart, with a Slippage value of 3, and a Commission set to 0.00004 USD per contract. The strategy is also made compatible with PineConnector , to provide an easy option to automate the strategy using a connection to MetaTrader. See tooltips for details on how to set up the bot, and check out our website for a detailed guide with images on how to automate the strategy.
The strategy was implemented using the following logic:
Entry strategy:
A total of 4 Supertrend values can be used to determine the entry logic. There is option to set up all 4 Supertrend parameters individually, as well as their potential to be used as an entry signal/or a trend filter. Long/Short entry signals will be determined based on the selected potential Supertrend entry signals, and filtered based on them being in an uptrend/downtrend (also available for setup). Please use the provided tooltips for each setup to see every detail.
Exit strategy:
4 different types of Stop Losses are available: ATR-based/Candle Low/High Based/Percentage Based/Pip Based. Additionally, Force exiting can also be applied, where there is option to set up 4 custom sessions, and exits will happen after the session has closed.
Parameters of every indicator used in the strategy can be tuned in the strategy settings as follows:
Plot settings:
Plot Signals: true by default, Show all Long and Short signals on the signal candle
Plot SL/TP lines: false by default, Checking this option will result in the TP and SL lines to be plotted on the chart.
Supertrend 1-4:
All the parameters of the Supertrends can be set up here, as well as their individual role in the entry logic.
Exit Strategy:
ATR Based Stop Loss: true by default
ATR Length (of the SL): 100 by default
ATR Smoothing (of the SL): RMA/SMMA by default
Candle Low/High Based Stop Loss: false by default, recent lowest or highest point (depending on long/short position) will be used to calculate stop loss value. Set 'Base Risk Multiplier' to 1 if you would like to use the calculated value as is. Setting it to a different value will count as an additional multiplier.
Candle Lookback (of the SL): 50 by default
Percentage Based Stop Loss: false by default, Set the stop loss to current price - % of current price (long) or price + % of current price (short).
Percentage (of the SL): 0.3 by default
Pip Based Stop Loss: Set the stop loss to current price - x pips (long) or price + x pips (short). Set 'Base Risk Multiplier' to 1 if you would like to use the calculated value as is. Setting it to a different value will count as an additional multiplier.
Pip (of the SL): 10 by default
Base Risk Multiplier: 4.5 by default, the stop loss will be placed at this risk level (meaning in case of ATR SL that the ATR value will be multiplied by this factor and the SL will be placed that value away from the entry level)
Risk to Reward Ratio: 1.5 by default, the take profit level will be placed such as this Risk/Reward ratio is met
Force Exiting:
4 total Force exit on custom session close options: none applied by default. If enabled, trades will close automatically after the set session is closed (on next candle's open).
Base Setups:
Allow Long Entries: true by default
Allow Short Entries: true by default
Order Size: 10 by default
Order Type: Capital Percentage by default, allows adjustment on how the position size is calculated: Cash: only the set cash amount will be used for each trade Contract(s): the adjusted number of contracts will be used for each trade Capital Percentage: a % of the current available capital will be used for each trade
ATR Limiter:
Use ATR Limiter: true by default, Only enter into any position (long/short) if ATR value is higher than the Low Boundary and lower than the High Boundary.
ATR Limiter Length: 50 by default
ATR Limiter Smoothing: RMA/SMMA by default
High Boundary: 1000 by default
Low Boundary: 0.0003 by default
MA based calculation: ATR value under MA by default, If not Unspecified, an MA is calculated with the ATR value as source. Only enter into position (long/short) if ATR value is higher/lower than the MA.
MA Type: RMA/SMMA by default
MA Length: 400 by default
Waddah Attar Filter:
Explosion/Deadzone relation: Not specified by default, Explosion over Deadzone: trades will only happen if the explosion line is over the deadzone line; Explosion under Deadzone: trades will only happen if the explosion line is under the deadzone line; Not specified: the opening of trades will not be based on the relation between the explosion and deadzone lines.
Limit trades based on trends: Not specified by default, Strong Trends: only enter long if the WA bar is colored green (there is an uptrend and the current bar is higher then the previous); only enter short if the WA bar is colored red (there is a downtrend and the current bar is higher then the previous); Soft Trends: only enter long if the WA bar is colored lime (there is an uptrend and the current bar is lower then the previous); only enter short if the WA bar is colored orange (there is a downtrend and the current bar is lower then the previous); All Trends: only enter long if the WA bar is colored green or lime (there is an uptrend); only enter short if the WA bar is colored red or orange (there is a downtrend); Not specified: the color of the WA bar (trend) is not relevant when considering entries.
WA bar value: Not specified by default, Over Explosion and Deadzone: only enter trades when the WA bar value is over the Explosion and Deadzone lines; Not specified: the relation between the explosion/deadzone lines to the value of the WA bar will not be used to filter opening trades.
Sensitivity: 150 by default
Fast MA Type: SMA by default
Fast MA Length: 10 by default
Slow MA Type: SMA
Slow MA Length: 20 by default
Channel MA Type: EMA by default
BB Channel Length: 20 by default
BB Stdev Multiplier: 2 by default
Trend Filter:
Use long trend filter 1: false by default, Only enter long if price is above Long MA.
Show long trend filter 1: false by default, Plot the selected MA on the chart.
TF1 - MA Type: EMA by default
TF1 - MA Length: 120 by default
TF1 - MA Source: close by default
Use short trend filter 1: false by default, Only enter long if price is above Long MA.
Show short trend filter 1: false by default, Plot the selected MA on the chart.
TF2 - MA Type: EMA by default
TF2 - MA Length: 120 by default
TF2 - MA Source: close by default
Volume Filter:
Only enter trades where volume is higher then the volume-based MA: true by default, a set type of MA will be calculated with the volume as source, and set length
MA Type: RMA/SMMA by default
MA Length: 200 by default
Date Range Limiter:
Limit Between Dates: false by default
Start Date: Jan 01 2023 00:00:00 by default
End Date: Jun 24 2023 00:00:00 by default
Session Limiter:
Show session plots: false by default, show market sessions on chart: Sidney (red), Tokyo (orange), London (yellow), New York (green)
Use session limiter: false by default, if enabled, trades will only happen in the ticked sessions below.
Sidney session: false by default, session between: 15:00 - 00:00 (EST)
Tokyo session: false by default, session between: 19:00 - 04:00 (EST)
London session: false by default, session between: 03:00 - 11:00 (EST)
New York session: false by default, session between: 08:00 - 17:00 (EST)
Trading Time:
Limit Trading Time: true by default, tick this together with the options below to enable limiting based on day and time
Valid Trading Days Global: 123567 by default, if the Limit Trading Time is on, trades will only happen on days that are present in this field. If any of the not global Valid Trading Days is used, this field will be neglected. Values represent days: Sunday (1), Monday (2), ..., Friday (6), Saturday(7) To trade on all days use: 123457
(1) Valid Trading Days: false, 123456 by default, values represent days: Sunday (1), Monday (2), ..., Friday (6), Saturday(7) The script will trade on days that are present in this field. Please make sure that this field and also (1) Valid Trading Hours Between is checked
(1) Valid Trading Hours Between: false, 1800-2000 by default, hours between which the trades can happen. The time is always in the exchange's timezone
All other options are also disabled by default
PineConnector Automation:
Use PineConnector Automation: false by default, In order for the connection to MetaTrader to work, you will need do perform prerequisite steps, you can follow our full guide at our website, or refer to the official PineConnector Documentation. To set up PineConnector Automation on the TradingView side, you will need to do the following:
1. Fill out the License ID field with your PineConnector License ID;
2. Fill out the Risk (trading volume) with the desired volume to be traded in each trade (the meaning of this value depends on the EA settings in Metatrader. Follow the detailed guide for additional information);
3. After filling out the fields, you need to enable the 'Use PineConnector Automation' option (check the box in the strategy settings);
4. Check if the chart has updated and you can see the appropriate order comments on your chart;
5. Create an alert with the strategy selected as Condition, and the Message as {{strategy.order.comment}} (should be there by default);
6. Enable the Webhook URL in the Notifications section, set it as the official PineConnector webhook address and enjoy your connection with MetaTrader.
License ID: 60123456789 by default
Risk (trading volume): 1 by default
NOTE! Fine-tuning/re-optimization is highly recommended when using other asset/timeframe combinations.

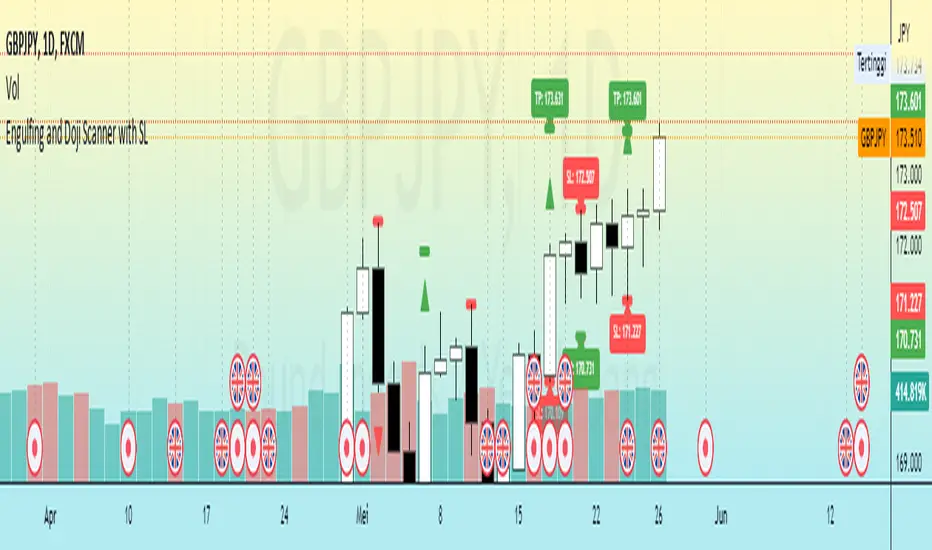
Engulfing and Doji Scanner with SLThe Bullish Engulfing pattern occurs when the close is higher than the open, and scripts will look for this pattern by checking the difference in the close and open prices sufficiently in pips. Likewise, the Bearish Engulfing pattern occurs when the close is lower than the open, and scripts will look for this pattern by checking for sufficient difference in the open and close in pips.
The Doji pattern occurs when the absolute difference between the open and close prices is very small compared to the price range for that period. The script will look for these patterns by comparing the difference between the open and close prices by a certain percentage of the price range.
After the patterns are detected, the script will calculate the Stop Loss (SL) and Take Profit (TP) levels based on the parameters set. The SL level will be determined based on the lowest price range with certain adjustments, while the TP level is calculated using a 1:1 ratio to the SL distance.
This script will display arrows and Stop Loss and Take Profit labels on the chart to assist traders in identifying relevant patterns and levels. However, it is important to remember that these scripts only assist in the analysis of patterns and levels, and a more complete trading strategy and decision-making remains the responsibility of the trader.
Swing BoxesHey, folks!
Sorry for not posting anything for such a long time. Don't have enough ideas and resources to get inspiration, so trying to brainstorm good stuff in my free time from university studies.
But despite my absence more I now have 300+ people subscribed to me! Thanks, guys, for keeping interest for my work, as I still do value each boost on my script, for real :)
So here is new script , enjoy!
Swing Boxes is pretty simple indicator, which plots signals with "boxes", that help you determine price targets.
What is the idea behind?
I wanted to make indicator, that could help me make swing trades with nice accuracy (as all we want, lol), and for signal criteria I decided to use highs and lows of the price . Then I started coding some ideas to see which of them could be worthy. And, actually, Swing Boxes appeared to be good. But the thing is, that I didn't intend to build them, they appeared as an anomaly from my code :)
I started to explore this anomaly (it looked super cool, but was repainting hard) to fix it and I succeeded, now Swng Boxes don't repaint.
The main idea is that when price goes above it's highest value of p-bars back or below it's lowest value p-bars back, then there is a some god probability, that price will continue to follow current direction.
And the things about Swing Boxes is that when there is a good trend movement, the boxes become super small to track price movement and when price breaks out in the counter-trend direction, then you will be able to almost perfectly catch a top or a bottom! But most of the signals won't be so high-quality, so don't think that is this some holy grail to trade swing-trading, because it is not.
Signal logic
Quick hint:
- epsilon(variable e ) = ATR * ATR_Factor . It is used to determine box's sensitivity to price changes.
If previous close is higher than variable, which contains previous HIGHEST value (variable h in the code), then update the this variable by taking up-to-date highest value and add epsilon( e ) to it;
If previous close is lower than variable, which contains previous LOWEST value (variable l in the code), then update the this variable by taking up-to-date lowest value and substract epsilon( e ) from it.
Variables decribed above ( h and l ) are box's top and bottom respectively, so if price cross them, it is logical to update it is value.
Settings and what is what
Swing Box Period - numbers fo bars in the past to find highest and lowest price from. The bigger the input, the bigger the boxes will be;
ATR Period;
ATR Factor - multiplier for ATR, determines sensitivity for price changes. The bigger this input, the more accurate signals will be, but less the probability that the signal will be on the top or a bottom.
Show Boxes? - when chosen, plots box's top and bottom. Used to determine price targets.
Show Baseline? - when chosen, plot's baseline, which midline between box's top and bottom.
How to use?
This indicator plots green and red triangles by default.
- Green triangle --> Buy ;
- Red triangle --> Sell ;
As I've said before, many signals from indicator will probably be garbage, so you need to tune settings for youself, so it could satisfy you .
You can enable showing boxes to see box's top and bottom. Box's bottom --> your entry, top --> your profit target.
If you find a way to sort bad signals, you will be able to trade with super cool RR, because the signal from Swing Boxes appear to be a good one, there is almost 95% probability, that price will not even come close to your stop loss, so you can trade with super small stop-losses! Smaller stop-loss --> smaller risk --> smaller loss --> bigger profit, it is that easy.
Also you can enable baseline to use at as your 1st TP, and box's top/bottom as 2nd TP, closing 25% on TP1 and the rest on TP2 (but that is just mine recommendation, you can use different RM (risk-management), if you want).
Also you can use baseline as your S/R (Support/Resistance) line, test it out on your charts.
And please, hear me out: as all other indicators out here on the TradingView, Swing Boxes ARE NOT meant to be traded in solo! Many bad signal can go in a row, so PLEASE find your way to filter out bad signals with other indicators.
You can see here the example of a garabge-class signal in a row, so be don't be deluded!
I do hope that somebody will suggest and idea to improve this thing, as I personally don't have enough time to think about it because of my university studies, but I will probably try it make this thing better throughout the time.
And that's it for now, folks! If you have any ideas for scripts, strategies or anything else, feel free to DM me or leave a comment, I will check it.
Hope you will find this script useful.
Take your profits!
- Tarasenko Fyodor

HS,HH,LL,and EMA by: rpalconitHello everyone,
HS,HH,LL, and EMA stands for Hull Suite, Higher High, Lower Low and Exponential Moving Average.
Signal Features:
• Long Position: If the Higher High and Lower Low signals are LL and LH at the SUPPORT LEVEL, plot the Fibonacci Retracement and get retracement from 0.382,0.5 and 0.618 for EP. and your SL should be at 1.1 level of the Fibonacci, target TP should be 1.5 ratio. For confirmations the Hull Suite (HS) should be green color and on or below the Exponential Moving Average (EMA).
• Short Position: If the Higher High and Lower Low signals are HH and HL at the RESISTANCE LEVEL, plot the Fibonacci Retracement and get retracement from 0.382,0.5 and 0.618 for EP. and your SL should be at 1.1 level of the Fibonacci, target TP should be 1.5 ratio. For confirmations the Hull Suite (HS) should be red color and on or above the Exponential Moving Average (EMA).
You can change EMA length in any of your preference. The Default is 50.
Details about the indicator
INPUTS
Time Frame
• Time Frames Chart: You can select your preferred timeframe at the dropdown list. Default is 4H. Aside from Time Fame, I advice not to change anything at input default for better result.
STYLE
• Note: For effective signals results and to minimize noise, you need to uncheck first on the style tab: MHULL, BAR COLOR AND LINES.
Best regards,
ruelpalconit

Channels Strategy [Dimkud]Channels trading Strategy. Based on "Channels Strategy" by JoseMetal.
To the original strategy added additional options and filters : Static SL/TP in percents (%), time delay between orders, ATR Filter, second Keltner Channel (Multi TimeFrame).
Interface translated to English.
Were good backtest results on many crypto tokens on 15m - 45m - 1h periods.
Mostly with configuration: Keltner Channel (optimise parameters for every token) + Static SL/TP (optimise values for every token) + "Enter Condition" = "Wick out of band".
The better is to optimise paramaters separately for Short and Long trading. And run two separate bots (in settings enable only Long or only Short.)
Tested on real automated trading on few online bot platforms. (3comm, revenuebot, veles).
Later I will make tutorial how to connect strategy to these platforms or contact me if you need help.

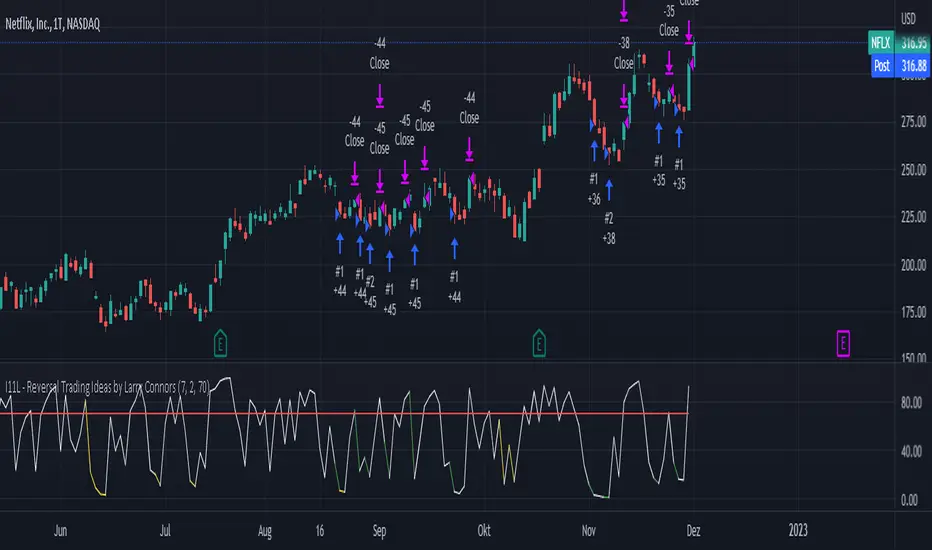
I11L - Reversal Trading Ideas by Larry ConnorsThis is my own Twist on Larry Connors Simple Tradingideas.
It Combines the RSI, Averaging In and the Lowest Bars in a Single System.
The current Configuration is designed for the Daily Timeframe.
Feel free to play with the Parameters and keep in mind that Larry Intended to buy fear and sell the greed!
The Rules are the following:
---Buy---
Buy, if the lowest Bar of your Configuration has been hit (default is set to 7).
---Average Down--
Buy, if the lowest Bar of your Configuration * Your open trades has been hit AND only if the buyin is atleast 1% cheaper.
---Close---
Close, if the RSI closes above a certain level (default is set to 70).
---TP---
There is no TP
---SL---
There is no SL, so be cautions of your tail Risk!
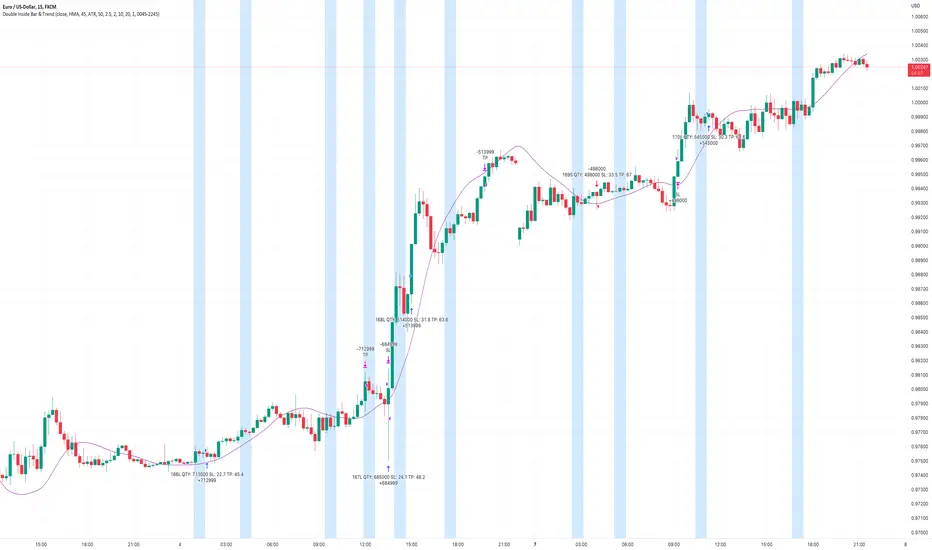
Double Inside Bar & Trend Strategy - KaspricciDouble Inside Bar & Trend Strategy - Kaspricci
This strategy combines the Double Inside Bar candlestick pattern with a trend filter. Once the second inside bar closes and price is above trend moving average, a buy stop order is placed at high of the candle. If price is below trend moving average, a sell stop order is placed at the low of the candle.
This strategy is for educational purposes only! It is not meant to be a financial advice.
Settings
Trend source, type of moving average and length for calculating trend
Stop Loss Type - default: ATR. You can switch between stop loss calculation based on Average True Range value or fixed value.
ATR Length / Factor / TP Ratio - default: 14 / 2.0 / 2.0. Used to calculate the Stop Loss as ATR * Factor and Take Profit as Stop Loss * TP Ratio.
FIX Stop Loss / Take Profit - default: 10 pips / 20 pips. In case you select Stop Loss Type = FIX, these value swill be used.
Risk in % - default: 1%, option to adjust the quantity of a trade based on a defined risk percentage. If enabled, it will overwrite the quantity parameter of the strategy settings.
On top you can filter trades by start and end date as well as time of the day.
The Only EURUSD Trading Strategy You Need - KaspricciThe Only EURUSD Trading Strategy You Need
I got the idea to this strategy from a youtube video uploaded by Trade Beta. It is designed to capture the early market move of major forex pair EURUSD at beginning of New York Stock Exchange (13:30 GMT). Trade Beta tested his strategy on the 5 minute chart. I have set all parameters to same values as shown in the video.
The strategy creates two pending orders at the recent swing high and low. Once the first pending order entered, the remaining one is cancelled. Latest at the end of market session all pending orders are cancelled and all open trade are closed as well.
In rare case that price at session opening is above swing high, only a pending sell stop order is created at swing high price. And in case price is below swing low, a pending buy stop order is created.
Settings
Trading Time - default: New York Stock Exchange opening hours. Pending orders are created at the close of the first candle within the session.
Swing High Source / Bars - default: High / 5 bars. Used to find the latest swing high within a range of 5 bars left and right. Price is used for buy stop order.
Swing Low Source / Bars - default: Low / 5 bars. Used to find the latest swing low within a range of 5 bars left and right. Price is used for sell stop order.
Stop Loss Type - default: ATR. You can switch between stop loss calculation based on Average True Range value or fixed value.
ATR Length / Factor / TP Ratio - default: 14 / 2.0 / 2.0. Used to calculate the Stop Loss as ATR * Factor and Take Profit as Stop Loss * TP Ratio.
FIX Stop Loss / Take Profit - default: 10 pips / 20 pips. In case you select Stop Loss Type = FIX, these value swill be used.
This strategy is for educational purposes only! It is not meant to be a financial advice.
