Volume Delta with Custom Colors and Min Delta Input### Indicator Description: **Volume Delta with Custom Colors and Min Delta Input**
---
Volume Delta with Custom Colors and Min Delta Input is a powerful and flexible indicator for analyzing volume delta (the difference between buying and selling volume) on TradingView charts. This indicator visualizes volume delta with customizable colors and allows filtering based on a minimum delta value. It is an ideal tool for traders who want to gain deeper insights into market activity and identify significant volume changes.
---
### Key Features:
Volume Delta Visualization:
- The indicator displays volume delta as candlesticks, where:
- Green candles indicate positive delta (buying volume dominance).
- Red candles indicate negative delta (selling volume dominance).
Customizable Colors:
- Users can choose their preferred colors for positive and negative delta to tailor the indicator to their preferences.
Minimum Delta Volume Filter:
- Added functionality to set a minimum delta volume threshold. This helps ignore insignificant volume changes and focus on important movements.
Flexible Timeframe Selection:
- The indicator supports analyzing volume delta on a different timeframe than the current chart. For example, you can analyze hourly volume delta on a daily chart.
Adaptive Settings:
- Users can configure the moving average (SMA) period and standard deviation multiplier to calculate the delta threshold.
---
### How to Use the Indicator:
Add the Indicator to Your Chart:
- Search for the indicator in the TradingView library and add it to your chart.
Configure the Settings:
- Positive Delta Bar Color: Choose the color for bars with positive delta.
- Negative Delta Bar Color: Choose the color for bars with negative delta.
- Minimum Delta Volume: Set the minimum delta volume value to be displayed.
- Use Custom Timeframe: Enable if you want to analyze volume on a different timeframe.
- Timeframe: Specify the desired timeframe for volume analysis (e.g., "1H" for hourly).
- SMA Period: Set the moving average period for delta calculation.
- Delta Multiplier: Adjust the standard deviation multiplier to fine-tune the delta threshold.
Analyze the Chart:
- Green candles indicate buying volume dominance, while red candles indicate selling volume dominance.
- Use the minimum delta volume filter to focus on significant movements.
---
### Benefits of the Indicator:
Flexibility: Customizable colors, timeframe selection, and filtering make the indicator versatile for various trading strategies.
Clarity: Volume delta visualization as candlesticks allows for quick assessment of market activity.
Noise Reduction: The minimum delta volume filter helps ignore insignificant changes and focus on important movements.
---
### Example Use Cases:
For Scalping: Use a minute timeframe and set a minimum delta volume filter to identify short-term volume anomalies.
For Long-Term Trading: Analyze volume delta on daily or weekly timeframes to identify key support and resistance levels.
---
### Recommendations:
Use the indicator in combination with other technical analysis tools (e.g., support/resistance levels or trendlines) to improve signal accuracy.
Experiment with the settings to adapt the indicator to your trading strategies.
---
Volume Delta with Custom Colors and Min Delta Input is an essential tool for traders who want to gain a deeper understanding of market dynamics and make more informed trading decisions. Try it out today and see its effectiveness for yourself!
"volume"に関するスクリプトを検索

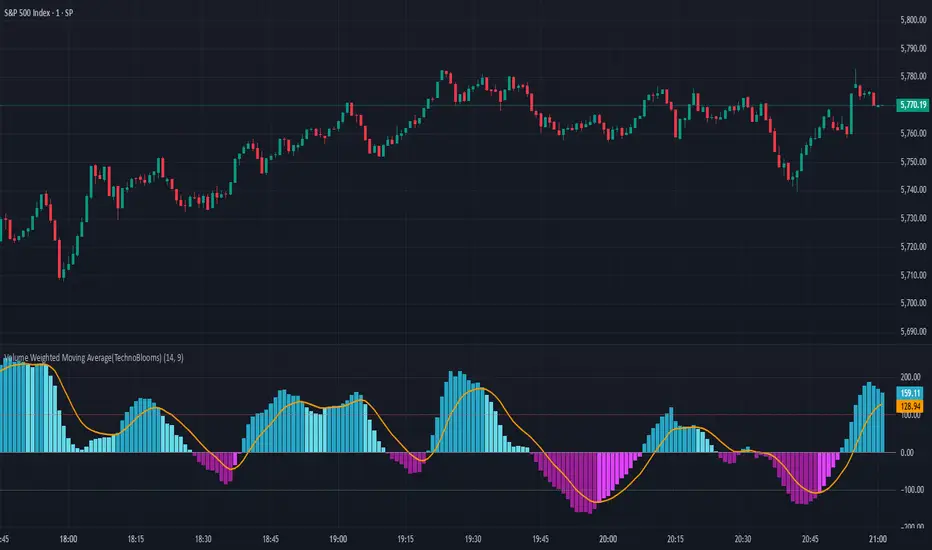
Volume Weighted Moving Average (TechnoBlooms)The Volume Weighted Moving Average Oscillator (VWMO) is a custom technical indicator designed to measure market momentum while accounting for volume. It helps traders assess whether price movements are supported by strong or weak trading volumes. The VWMO provides insights into potential trends by comparing current momentum with historical averages.
Indicator Overview:
The VWMO is based on a combination of price and volume data, highlighting the relationship between these two components to generate a clear oscillation value. The oscillator displays dynamic insights into market strength, capturing price directionality and volume alignment.
Key Features:
1. Dynamic Visualization of Momentum:
o The oscillator displays positive and negative momentum by analyzing the relationship between price movements and trading volume over a specified period.
o Positive momentum typically represents a bullish market, while negative momentum reflects bearish conditions.
2. Volume-Weighted Analysis:
o Volume is incorporated to give an adjusted price perspective, where price movements on high-volume days have more influence on the resulting oscillator values.
3. Trend Confirmation via EMA:
o An Exponential Moving Average (EMA) of the oscillator is plotted to smooth the raw oscillator values and provide trend confirmation.
o The EMA is essential for identifying whether the oscillator is in an upward or downward trend. It also serves as a support for evaluating when momentum might reverse.
4. Visual Indicators and Color Coding:
o The indicator uses varying color intensities to differentiate between strong and weak momentum.
o Bullish and bearish momentum is visually reflected by colors, offering at-a-glance guidance on potential trade opportunities.
5. Overbought and Oversold Thresholds:
o Horizontal lines at predefined levels (e.g., +100 and -100) help to define overbought and oversold areas, which assist in identifying overextended price movements that may signal reversals.
6. Scalability & Adaptability:
o The indicator allows for adjustment of the period, EMA length, and other key parameters to tailor its usage according to different asset classes or timeframe preferences.
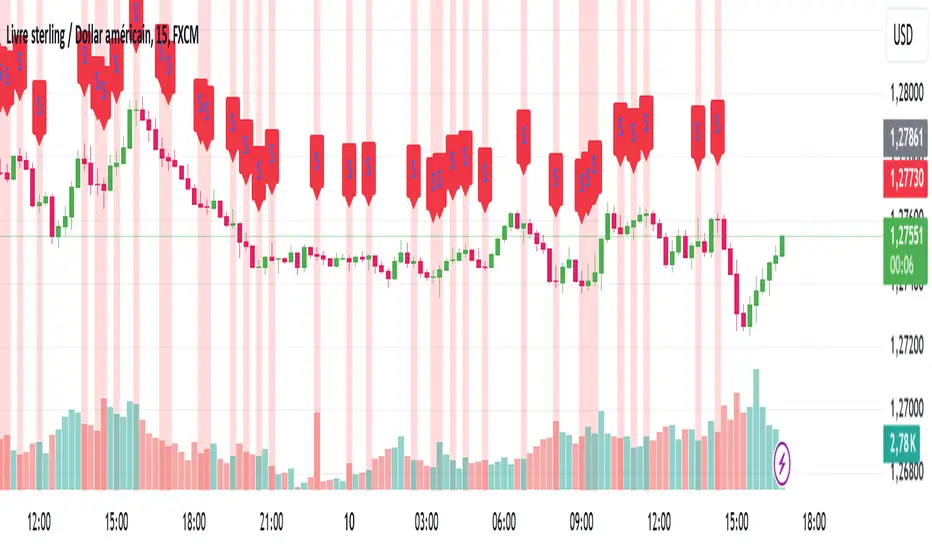
squeeze candles with volume Function :
This indicator was designed to detect specific candles called “squeeze”. These candles are characterized by a relatively small body (the difference between the opening and closing price) and long shadows (the distance between the high and low prices), accompanied by significant volume. They often indicate a period of increased volatility or a potential trend reversal.
Use :
Visual detection:
Candles identified as "squeeze" are highlighted in red on the chart.
An “S” icon appears above each detected squeeze candle.
Alerts:
The indicator emits an audible and visual alert when a squeeze candle with high volume is detected (if alerts are enabled).
Market analysis:
This indicator is particularly useful for identifying trading opportunities during periods when the market is showing signs of compression or impending volatility.
Customizable settings:
Minimum volume: Defines the threshold at which the volume is considered high.
Maximum body/shadow ratio: Allows you to adjust the sensitivity to detect squeeze candles (the lower the ratio, the smaller the detected candles will have in relation to their shadows).
Benefits :
Provides accurate alerts on key market candles.
Helps anticipate large movements through analysis of volume and candle characteristics.
Adaptable to different strategies thanks to adjustable parameters.
Ideal for:
Traders who want to identify areas of potential volatility or reversal signals in the market, regardless of the asset or time frame used.
Dix$on's Weighted Volume FlowDixson's Weighted Volume Flow
Dixson's Weighted Volume Flow is a technical indicator designed to analyze and visualize the distribution of buy and sell volume within a given timeframe. It dynamically calculates the proportional allocation of volume based on price action within each bar, providing insights into market sentiment and activity. This indicator displays horizontal volume bars in a separate pane and annotates them with precise volume values.
How It Works
1. Volume Allocation:
- The indicator calculates buy and sell volume using the following formulas:
- Buy Volume = (Close - Low) / (High - Low) Total Volume
- Sell Volume = (High - Close) / (High - Low) Total Volume
- These formulas allocate volume proportionally based on the bar's price range, attributing more volume to buying or selling depending on the relationship between the close, high, and low prices.
2. Dynamic Scaling:
- The buy and sell volumes are scaled relative to their combined total for the period.
- The resulting values determine the length of the horizontal bars, providing a comparative view of buy and sell activity.
3. Bar Visualization:
- Buy Volume Bars: Displayed as green horizontal bars.
- Sell Volume Bars: Displayed as red horizontal bars.
- The lengths of the bars represent the dominance of buy or sell volume, scaled dynamically within the pane.
4. Labels:
- Each bar is annotated with a label showing its calculated buy or sell volume value.
5. Timeframe Adjustment:
- The indicator uses the request.security() function to fetch data from the selected timeframe, allowing users to customize their analysis for intraday, daily, or longer-term trends.
6. Customization Options:
- Enable or disable the indicator using a toggle.
- Adjust colors for the buy/sell bars and text labels to suit your chart theme.
How to Use It
1. Enable the Indicator:
- Activate the indicator using the "Enable/Disable" toggle in the settings.
2. Select a Timeframe:
- Choose the timeframe for analysis (e.g., 1-minute, 1-hour, daily). The indicator fetches volume data specific to the selected timeframe.
3. Interpret the Visualization:
- Compare Bar Lengths:
- Longer buy volume bars (green) indicate stronger buying activity.
- Longer sell volume bars (red) suggest dominant selling pressure.
- Labels:
- Use the labels to view the exact buy and sell volume values for precise analysis.
4. Combine with Other Tools:
- Use the indicator alongside price action analysis, support/resistance levels, or trend indicators to confirm market sentiment and detect potential reversals.
5. Monitor Imbalances:
- Significant disparities between buy and sell volume can signal shifts in market sentiment, such as the end of a trend or the start of a breakout.
Practical Applications
- Trend Confirmation:
- Align the dominance of buy or sell volume with price trends to confirm market direction.
- Reversal Signals:
- Watch for volume imbalances or a sudden shift in the dominance of buy or sell volume to identify potential reversals.
- High-Activity Zones:
- Identify areas with increased volume to anticipate significant price movements or key support/resistance interactions.
Dixson's Weighted Volume Flow provides a clear and systematic way to analyze market activity by visualizing the dynamics of buy and sell volume. It is particularly useful for traders looking to enhance their understanding of volume-based sentiment and its impact on price movements.

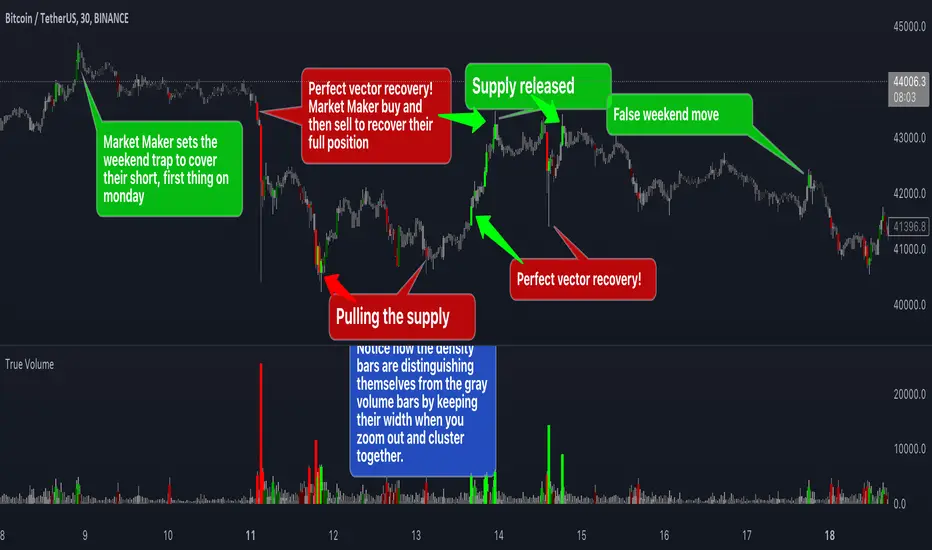
True VolumeThis indicator is designed to provide in-depth analysis of volume data from multiple sources and distinguish highly liquid candles by measuring the density of the volume. By focusing on the density and concentration of volume, rather than just the volume itself, it offers a more nuanced view of the market. This can be particularly beneficial in markets like cryptocurrencies, where understanding the role of market makers versus retail traders is crucial for strategic trading.
This is how it works:
Multiple Asset Integration:
Unlike standard volume indicators, True Volume allows the inclusion of up to four different assets (or the same asset from various exchanges) into its volume calculations. This feature provides a broader and more accurate total volume representation, essential in markets like cryptocurrencies where volume is dispersed across multiple exchanges.
Adjustable Time Anchors:
It offers various time anchor options, allowing traders to analyze volume data over different time periods or a specific amount of lookback candles. This flexibility helps in understanding volume trends over both short and long-term time frames.
Volume Density Analysis:
The core of this indicator is the innovative concept of Volume Density. It's calculated using a sigmoid function that normalizes the volume-to-price movement ratio in a unique way without needing a max cap or having the density column spike off the chart. This method helps in distinguishing between normal volume fluctuations and those that are unusually dense for the given price movement. This distinction is key in identifying potential market maker activities.
The Visuals:
The Volume Density is displayed in a unique way without compromising the original volume bars or cap the density. Infinite density can essentially be represented without having an infinitely large bar or caping out the density data. There's also two different color themes, optional bar color, and an option to flip the density bars up-side down for a different representation. Each of the original volume sources can be displayed separately as well. All colors as customizable as well for your own preference.
Price Volume Trend (PVT):
Included in this indicator is also the Price Volume Trend, which cumulatively measures the density delta, offering insights into the longer-term momentum of the market.
How do I trade it?
This indicator aims to give you insight into 'the other side of the trade', the Market Makers. When you buy, they provide liquidity by selling to you. That drives the Volume Density up.
Consider whether the market maker is currently long or short and might need to cover their position by wicking price back, or "adjust inventory". Especially towards the end of a market session.
Consider dense candles during market gaps or weekends to be market manipulation moves.
The density also goes up when stop losses are hit. If price makes a higher high or lower low, high density could indicate a liquidation event.
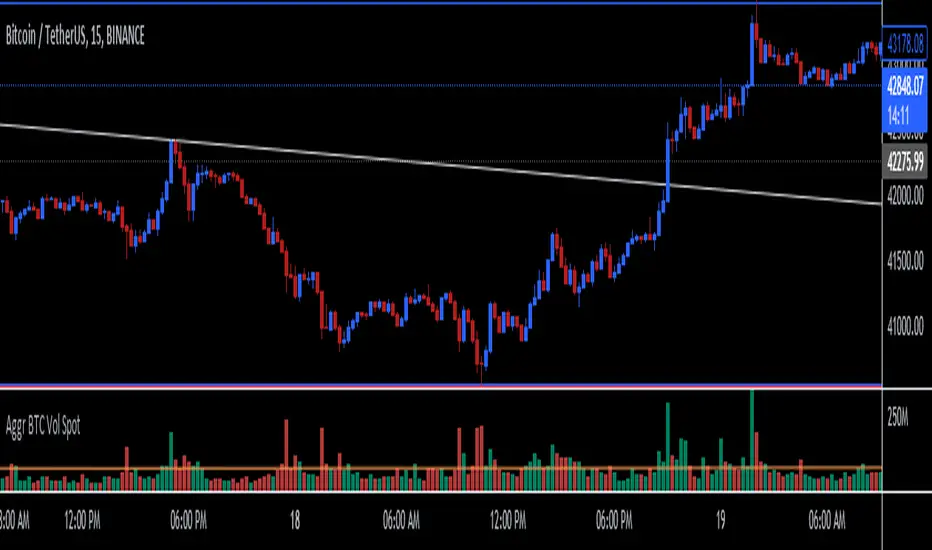
Aggregate BTC Volume Spot - Ma78erAggregate BTC Volume indicator show aggregates trading volumes of Bitcoin from multiple trading platforms.
Exchange Include:
1: Binance - BTC(USDT, USDC, FDUSD, TUSD)
2: Coinbase - BTC(USD, EUR, USDT, GBP)
3: OKX - BTC(USDT, USDC)
4: BYBIT - BTC(USDT, USDC)
5: KUCOIN - BTC(USDT, USDC)
6: KRAKEN - BTC(USD, EUR, USDT, GBP, USDC)
7: Bitfinex - BTC(USD, EUR, GBP)
8: Bitstamp - BTC(USD, EUR, USDT, GBP, USDC)
9: GATEIO - BTC(USDT)
You can also add other exchange in script manually.
ETH Volume*Close Top Exchanges in millions $The script is designed to create a custom indicator that calculates the total volume of Ethereum traded on various exchanges, calculated in millions of dollars, and then plots a histogram of that volume along with a Simple Moving Average (SMA) of the volume.
The script starts by setting some input parameters such as the length of the SMA and the range period. It then requests data on the volume of Ethereum traded on several exchanges such as Binance, Coinbase, Kraken, and others. It calculates the combined total volume across all these exchanges and multiplies it by the close price of Ethereum to get a value in millions of dollars.
The script then checks if the volume is rising while the price is lower than the previous 5 bars high and higher than the previous 5 bars low, and if so, it sets the color of the histogram bars to white. It then plots the histogram bars and the SMA on the chart.

BTC Volume*Close from Top ExchangesThe script is designed to create a custom indicator that calculates the total volume of Bitcoin traded on various exchanges, calculated in millions of dollars, and then plots a histogram of that volume along with a Simple Moving Average (SMA) of the volume.
The script starts by setting some input parameters such as the length of the SMA and the range period. It then requests data on the volume of Bitcoin traded on several exchanges such as Binance, Coinbase, Kraken, and others. It calculates the combined total volume across all these exchanges and multiplies it by the close price of Bitcoin to get a value in millions of dollars.
The script then checks if the volume is rising while the price is lower than the previous 5 bars high and higher than the previous 5 bars low, and if so, it sets the color of the histogram bars to white. It then plots the histogram bars and the SMA on the chart.

Volume Trend AnalysisThe VTA indicator is a trend analysis indicator based on trading volume and candlestick charts, used to determine the states of bullish strength, bearish strength, and market balance. When the bullish volume gradually increases while the bearish volume gradually decreases or remains steady, the market is in a state of bullish strength; when the bearish volume gradually increases while the bullish volume gradually decreases or remains steady, the market is in a state of bearish strength; when both the bullish and bearish volumes remain steady, the market is in a state of market balance.
The VTA indicator can help traders better determine market trends, select appropriate entry and exit points.

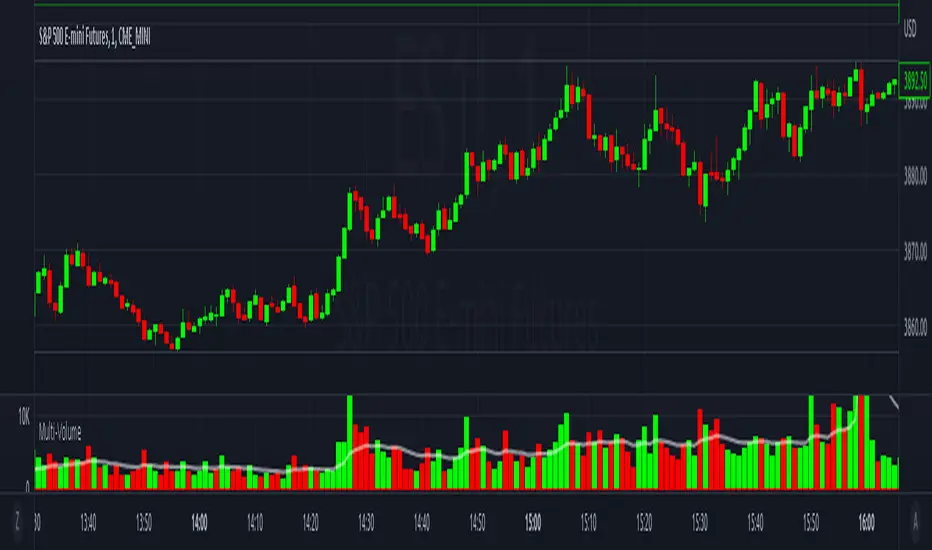
Multi-VolumeThis indicator displays volume in several formats:
Volume Bar Format:
Normal Volume: Shows the normal volume bar colors based on each candle's price direction
Up/Down Volume: Breaks down each volume bar into buying volume (volume added when price goes up) and selling volume (volume added when price goes down)
Volume Pressure: Breaks down each volume bar based on the length of the candle and its "pressure wick". See below for more information.
Flip Down Volume:
The down volume bar will be displayed below the center line.
Show Delta:
When selected with "Up/Down Volume" or "Volume Pressure", a small line will be displayed at the net volume (difference between up and down volume).
Projected Volume:
Instead of current volume, it will show expected volume at end of candle based on volume per second.
Volume Pressure:
On a green candle:
The red part represents the upper wick, the volume as the price comes back down from its high
The green part represents the rest of the candle, the volume as the price goes up from its low to the close
On a red candle:
The green part represents the lower wick, the volume as the price comes back up from its low
The red part represents the rest of the candle, the volume as the price goes down from its high to the close
To Update to Latest Version:
To update to the latest version, just close the indicator and add it again.
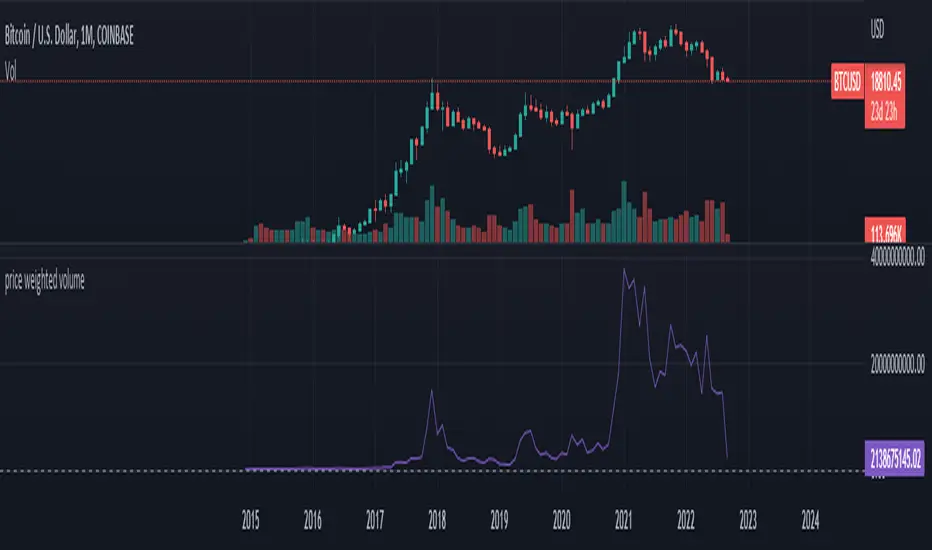
PWV - Price Weighted VolumeThis indicator charts
PWV = volume * close
in order to better visualize exchange volume.
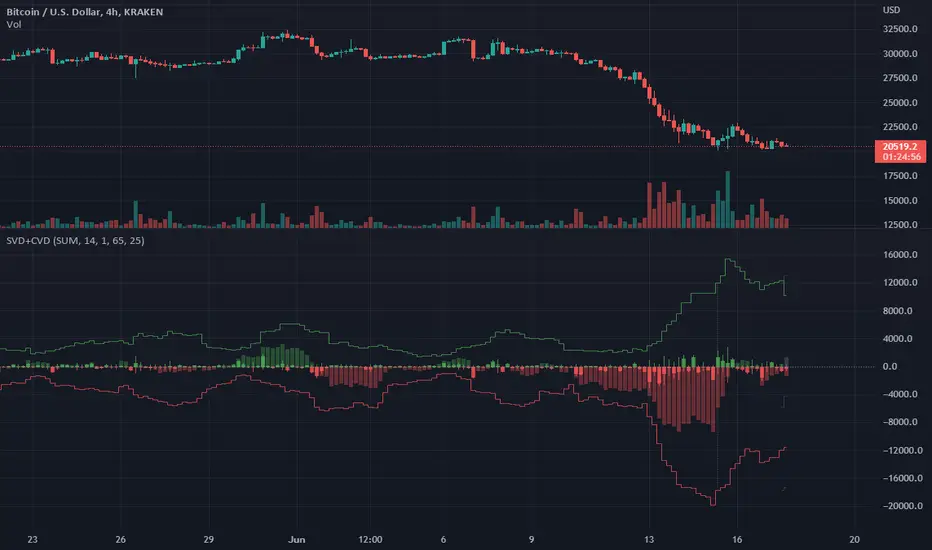
Singular and Cumulative Volume Delta (SVD+CVD)This a Volume Delta indicator with Cumulative Volume Delta.
I have been studying Volume Delta and CVD trading strategies and indicator styles.
This implementation was developed to test a basic trailing window / oscillator approach.
Script has been republished as public and searchable.
Changelog from private era follows.
Jun 9 (2022)
Release Notes:
Added option to use EMA/SMA based cumulation. This will not scale well with singular data, so default view is still SUM.
Jun 9 (2022)
Release Notes:
Outdated comment correction.
Jun 9 (2022)
Release Notes:
Added default option to normalilze visual scale of MA cumulation types. The averaging creates a singular value sized results, instead of a range-sums. This multiples that candle result by the range length to get a range-sum sized result.
Added option to scale the cumulation size relative to the volume size. 1-to-1 scaling creates singular deltas that can be hard to see with all options on. This allows you to beef them up for visual or weighting purposes.
Jun 15 (2022)
Release Notes: * Added break even level for current delta. Tells where current delta must land for cumulative delta to stay flat.
* Added comparison of historical cumulative levels to current level. The historical levels are the initial values going into current accumulation window.
* Changed title of indicator to be more generic, clear, and searchable.
Jun 15 (2022)
Release Notes: * Added option to have the cumulation cutoff line AFTER or OVER the end of the cumulation window. This change is to ensure the indicator clearly documents it's behavior and avoids confusion on this / last cumulation window semantics.
* Bugfix: Initial levels were pulled from cumulation line which was AFTER end of window. This has been changed to the initial values INSIDE the cumulation window.
* Code cleanup.
June 17th (2022)
Release Notes: Marked as beta because TV confirmed they no longer allow private scripts to be changed to public. (Despite lingering documentation that says otherwise.
June 17th (2022)
Re-published as public.
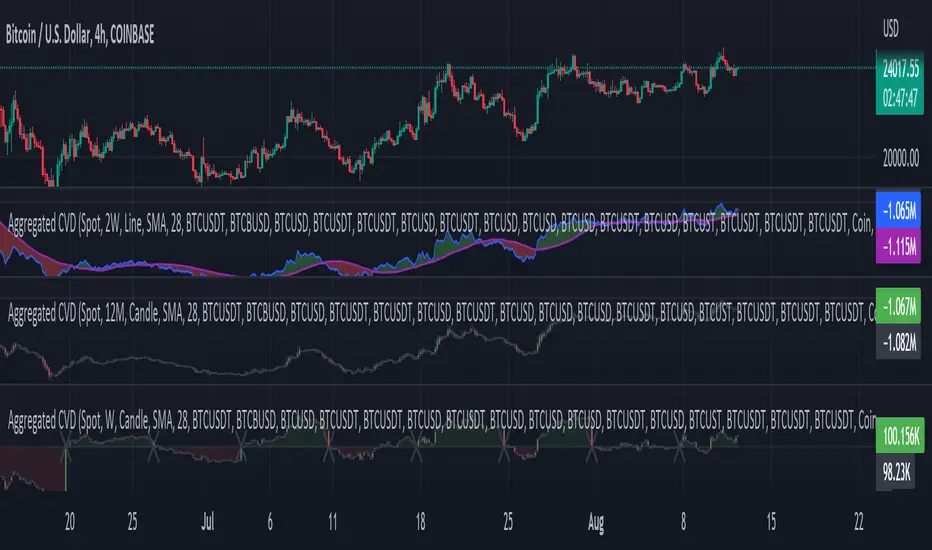
Aggr. CDV / Delta Volume - InFinitoModified & Updated script from MARKET VOLUME by Ricardo M Arjona @XeL_Arjona that Includes Aggregated Volume, Delta Volume, Volume by Side
Aggregation code originally from Crypt0rus
Candle Plotting code from LonesomeTheBlue
***The indicator can be used for any coin/symbol to aggregate volume , but it has to be set up manually***
***The indicator can be used with specific symbol data only by disabling the aggregation option, which allows for it to be used on any symbol***
- Calculated based on Aggregated Volume instead of by symbol volume . Using aggregated data makes it more accurate and allows to compare volume flow between different kinds of markets (Spot, Futures , Perpetuals, Futures+Perpetuals and All Volume ).
- As well, in order to make the data as accurate as possible, the data from each exchange aggregated is normalized to report always in terms of 1 BTC . In case this indicator is used for another symbol, the calculations can be adjusted manually to make it always report data in terms of 1 contract/coin.
All Aggregated Volume By Side: Based of Xel_Arjona's calculation, buy and sell volume is estimated each period. This indicators can display both Buy Volume and Sell Volume for each period.
Aggregated Delta Volume By Side: Displays the difference between Buy & Sell Volume as Delta (Down if Sell Vol - Up if Buy Vol)
Aggregated Cumulative Delta Volume: Displays the sum of Delta Volume as a line, candles or Heiken Aishi Candles. Great for observing Volume Flow and spotting divergences
- It is Possible to add an MA to the CVD and to color fill in between the indicator and the MA
- It is possible to reset the indicators basis to 0 periodically
Range Volume ChangeI was looking for a way to see if today's premarket volume is higher or lower than the previous day's premarket, but did not find any, hence, I made my own which I share with you now.
I call it 'Range Volume Change' or just RVC.
RVC will show the percentage of change between the selected time range and the previous day for the same time range.
This will allow us to see if the volume is increasing or decreasing today compared to the previous day by a specific time range that we set in PVC settings. It can do more than just premarket, you can use it for any time range of your interest which will work on 24hours assets like crypto and forex.
RVC visualizes the incremental of the volume using increasing size columns giving you a better view of how the volume changes compared to the past. The column shows the accumulated volume from when the time range started.
As an extra feature, it will also show the volume percentage of change outside the time range (can be disabled from settings).
In addition, RVC is also designed to work on real-time data.
Example of BTCUSDT (24-hour asset) with volume 'outside the time range', enabled (purple columns):
Follow for more awesome indicators/strategies: www.tradingview.com

Forex Session Volume ExplorerFigure out the best time to trade your favorite Currency Pair, Commodity, or Crypto!
This indicator is an exploration of how Forex Sessions affect volume. The colored plots below represent the accumulative volume during each of the four major trading sessions: London, New York, Tokyo, and Sydney.
Plots have been normalized as a percentage of total volume, i.e. London = 34.2 signifies that 34.2% of all volume occurs during the London Session.
Trading the session with the highest volume will greatly benefit your Win Rate, especially when using "typical" indicators and strategies.
Use in conjunction with my previous tool for a clean & customizable visual representation of Forex Sesssions:
Forex Trading Sessions
Cheers,
EFX (@DasanC)

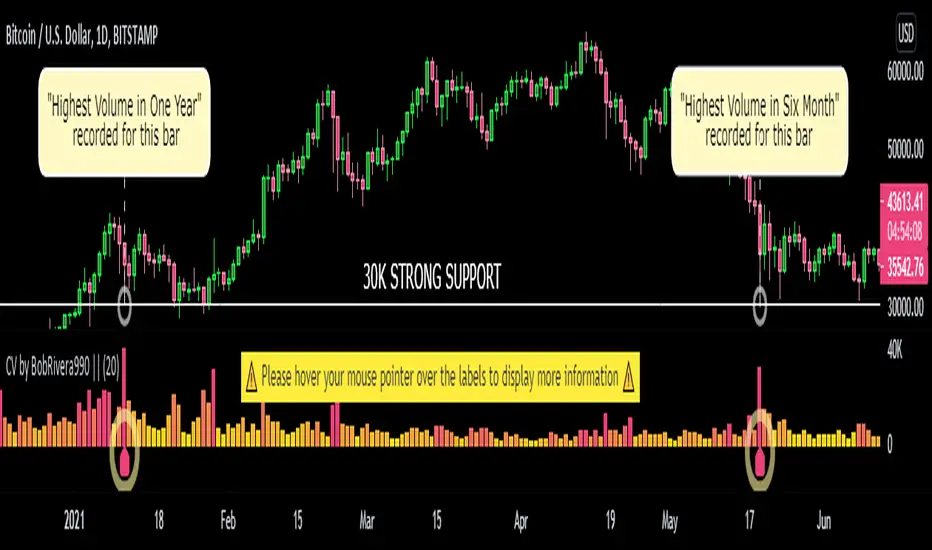
Custom Volume - Periodic Peaks & Troughs + AlertThis script is a custom volume indicator with additional features.
But why is this useful?
The minimum and maximum volumes, in different time periods, are displayed by labels below the bars. I call them "Peaks" and "Troughs".
Hover your mouse cursor over the labels to see more details.
These parameters are widely used in technical analysis.
If traders want to confirm a reversal on a level of support–or floor–they look for high buying volume. Conversely, if traders are looking to confirm a break in the level of support, they look for low volume from buyers.
If traders want to confirm a reversal on a level of resistance–or ceiling– they look for high selling volume. Conversely, if traders are looking to confirm a break in the level of resistance, they look for high volume from buyers.
For example, take a look at the chart.
Settings menu parameters
{Dialog Box} =>
Parameter to show / hide the dialog box.
{Visual Parameters} =>
Parameters to personalize the appearance of the indicator.
{ Alert Conditions Part 01: Peaks ⏰ "} =>
Parameters to customize the alert.
{ Alert Conditions Part 02: Troughs ⏰ "} =>
Parameters to customize the alert.
{Volume MA} =>
Moving average settings
How to use alerts
Note that by creating an alert, an instance of the indicator, with all your settings, will be activated on the site's server and alerts will be triggered by it.
After that, changing the indicator settings on the chart will no longer affect the alert.
Open the settings window and select the alert conditions as you wish
Click the Create Alert button (or press the A key while holding down the ALT key)
In the Condition section, select the name of the indicator.
Make the rest of the settings as you wish.
Finally, click on the Create button.
It's finished. After a few moments, your alert will be added to the Alerts menu.
Limits
The labels are displayed after the bars close.
Labels are displayed for the last 10,000 bars.
References: Investopedia
Angled Volume Profile [feeble]BETA VERSION
this indicator maps volume as brightness over an SMA. the brightness then fades over time.
It draws 30 bands, so you will need to load multiple instances to get a large picture.
Configure the settings, then copy and paste the indicator, modifying only the vertOffset attribute each time
Patience, bruh. This takes a long time load. Chrome runs it faster than Firefox. ¯\_(ツ)_/¯
Please let me know if you can think of how to optimize it.
Feedback is appreciated is you use it :)
sample with 6 instances:
settings:
useLog: enable if you are using a log graph
rowHeight: resolution of rows.
vertOffset: normally if you have 5 instances, the values will be -2,-1,0,1,2
fadeAmt: how long it takes for volume to fade once it is picked up
volumeMin and Max: the volume range displayed.
volumeResolution: time resolution at which volume data is collected - this is why the fadeAmt is so high, and why the graph runs out of data after a period back
EMA length: its Actually SMA but I wrote it wrong. eg. for a 20 day period on a 15min chart you go ( 20 days x 24 hrs x 4 quarter hours = 1920) - I hope to automate this in a future version :p

cooltoyz: Volume Delta RealTime v1.0This is a tool, shows the volume variation % strength related to the X past candles.
The current candle is shown in real time, until candle closes.
The visualization of the candle time to close is a thin line, that is 100% for all past candles and slowly goes up for the current candle.
Best with an example:
with a 4h candle, 1 hour has wasted already. This is 25% of all the candle time. So, if volume is also at 25% of the last candles traded, we can expect(yeah, you wish) that by candle close, around 100% of the last volumes average will be traded.
Or two:
in a 4h candle, we're at 10mins., around 8% of total candle time. If volume traded is already at 57% of average past volumes, something big is going on.
Note 1: in the indicator's "Format" pop-up there is a "candle minutes" field, it MUST match the chart timeframe in minutes (ex: 4h=240min)
Note 2: the back volume function check can be switched between the methods "highest value" or "average", in the Format->inputs
Note 3: when a new candle opens, it will go craaayeeezeee!!, because the extreme small values introduce a lot of rounding errors. just let it go, it calms it self after ~0.5% of candle time has passed.
There are more examples and details in the early version of this indicator, check my published scripts.

Relative Volume EMA (RVOL)Relative Volume EMA (RVOL) measures the current bar’s volume relative to its typical volume over a selected lookback period.
It helps traders identify whether a price move is supported by real participation or if it’s occurring on weak, low-quality volume.
This version uses:
RVOL = Current Volume ÷ Volume EMA
Volume EMA Length: adjustable
Signal Threshold: a customizable horizontal line (default = 1.2)
How to Use
1. RVOL > 1.2 → High-Quality Momentum
A value above 1.2 indicates that the current bar has at least 20% more volume than normal, suggesting:
Strong conviction
Algorithmic activity
Momentum-backed breakout or breakdown
Higher probability trend continuation
These bars are ideal for confirming entries after a technical setup (e.g., pullback, engulfing pattern, Ichimoku trend confirmation, etc.).
2. RVOL < 1.0 → Weak or Low-Quality Move
When RVOL is below 1.0:
Volume is below average
Moves are more likely to fail or reverse
Breakouts are unreliable
Triggers lack institutional participation
These bars are best avoided for trade entries.
Why This Indicator Is Useful
In many strategies, price alone is not enough.
RVOL acts as a filter to ensure that your signals occur during times when the market is actually active and committed.
Typical use cases:
Confirm trend-following entries
Validate pullbacks and breakout candles
Filter out low-volume chop
Identify session-based volume surges
Improve risk-to-reward quality by entering only during true momentum
Recommended Settings
EMA Length: 20
Threshold Line: 1.2
Works well on Forex, Crypto, and Indices
Best used on 15m, 30m, 1H, and 4H charts

Volume Percentile Supertrend [BackQuant]Volume Percentile Supertrend
A volatility and participation aware Supertrend that automatically widens or tightens its bands based on where current volume sits inside its recent distribution. The goal is simple: fewer whipsaws when activity surges, faster reaction when the tape is quiet.
What it does
Calculates a standard Supertrend framework from an ATR on a volume weighted price source.
Measures current volume against its recent percentile and converts that context into a dynamic ATR multiplier.
Widens bands when volume is unusually high to reduce chop. Tightens bands when volume is unusually low to catch turns earlier.
Paints candles, draws the active Supertrend line and optional bands, and prints clear Long and Short signal markers.
Why volume percentile
Fixed ATR multipliers assume all bars are equal. They are not. When participation spikes, price swings expand and a static band gets sliced.
Percentiles place the current bar inside a recent distribution. If volume is in the top slice, the Supertrend allows more room. If volume is in the bottom slice, it expects smaller noise and tightens.
This keeps the same playbook usable across busy sessions and sleepy ones without constant manual retuning.
How it works
Volume distribution - A rolling window computes the Pth percentile of volume. Above that is flagged as high volume. A lower reference percentile marks quiet bars.
Dynamic multiplier - Start from a Base Multiplier. If bar is high volume, scale it up by a function of volume-to-average and a Sensitivity knob. If bar is low volume, scale it down. Smooth the result with an EMA to avoid jitter.
VWMA source - The price input for bands is a short volume weighted moving average of close. Heavy prints matter more.
ATR envelope - Compute ATR on your length. UpperBasic = VWMA + Multiplier x ATR. LowerBasic = VWMA - Multiplier x ATR.
Trailing logic - The final lines trail price so they only move in a direction that preserves Supertrend behavior. This prevents sudden flips from transient pokes.
Direction and signals - Direction flips when price crosses through the relevant trailing line. SupertrendLong and SupertrendShort mark those flips. The plotted Supertrend is the active trailing side.
Inputs and what they change
Volume Lookback - Window for percentile and average. Larger window = stabler percentile, smaller = snappier.
Volume Percentile Level - Threshold that defines high volume. Example 70 means top 30 percent of recent bars are treated as high activity.
Volume Sensitivity - Gain from volume ratio to the dynamic multiplier. Higher = bands expand more when volume spikes.
VWMA Source Length - Smoothing of the volume weighted price source for the bands.
ATR Length - Standard ATR window. Larger = slower, smaller = quicker.
Base Multiplier - Core band width before volume adjustment. Think of this as your neutral volatility setting.
Multiplier Smoothing - EMA on the dynamic multiplier. Reduces back and forth changes when volume oscillates around the threshold.
Show Supertrend on chart - Toggles the active line.
Show Upper Lower Bands - Draws both sides even when inactive. Good for context.
Paint candles according to Trend - Colors bars by trend direction.
Show Long and Short Signals - Prints 𝕃 and 𝕊 markers at flips.
Colors - Choose your long and short palette.
Reading the plot
Supertrend line - Thick line that hugs price from above in downtrends and from below in uptrends. Its distance breathes with volume.
Bands - Optional upper and lower rails. Useful to see the inactive side and judge how wide the envelope is right now.
Signals - 𝕃 prints when the trend flips long. 𝕊 prints when the trend flips short.
Candle colors - Quick bias read at a glance when painting is enabled.
Typical workflows
Trend following - Use 𝕃 flips to initiate longs and ride while bars remain colored long and price respects the lower trailing line. Mirror for shorts with 𝕊 and the upper trailing line. During high volume phases the line will give more room, which helps stay in the move.
Pullback adds - In an established trend, shallow tags toward the active line after a high volume expansion can be add points. The dynamic envelope adjusts to the session so your add distance is not fixed to a stale volatility regime.
Mean reversion filter - In quiet tape the multiplier contracts and flips come earlier. If you prefer fading, watch for quick toggles around the bands when volume percentile remains low. In high volume, avoid fading into the widened line unless you have other strong reasons.
Notes on behavior
High volume bar: the percentile gate opens, volRatio > 1 powers up the multiplier through the Sensitivity lever, bands widen, fewer false flips.
Low volume bar: multiplier contracts, bands tighten, flips can happen earlier which is useful when you want to catch regime changes in quiet conditions.
Smoothing matters: both the price source (VWMA) and the multiplier are smoothed to keep structure readable while still adapting.
Quick checklist
If you see frequent chop and today feels busy: check that volume is above your percentile. Wider bands are expected. Consider letting the trend prove itself against the expanded line before acting.
If everything feels slow and you want earlier entries: percentile likely marks low volume, so bands tighten and 𝕃 or 𝕊 can appear sooner.
If you want more or fewer flips overall: adjust Base Multiplier first. If you want more reaction specifically tied to volume surges: raise Volume Sensitivity. If the envelope breathes too fast: raise Multiplier Smoothing.
What the signals mean
SupertrendLong - Direction changed from non-long to long. 𝕃 marker prints. The active line switches to support below price.
SupertrendShort - Direction changed from non-short to short. 𝕊 marker prints. The active line switches to resistance above price.
Trend color - Bars painted long or short help validate context for entries and management.
Summary
Volume Percentile Supertrend adapts the classic Supertrend to the day you are trading. Volume percentile sets the mood, sensitivity translates it into dynamic band width, and smoothing keeps it clean. The result is a single plot that aims to stay conservative when the tape is loud and act decisively when it is quiet, without you having to constantly retune settings.

Trailing Cumulative Volume DeltaShort Description:
A dynamic volume delta indicator that calculates a trailing sum of net buying/selling pressure over a user-defined number of recent bars, offering a more adaptive view of order flow momentum compared to fixed-anchor CVD.
Overview:
The Trailing Cumulative Volume Delta (TCVD) indicator provides a powerful way to analyze market sentiment by tracking the net difference between buying and selling volume. Unlike traditional Cumulative Volume Delta (CVD) indicators that typically reset at fixed intervals (e.g., daily, weekly), the TCVD calculates a rolling sum of volume delta over a specified number of recent bars. This "trailing" approach offers a more fluid and responsive measure of recent order flow dynamics.
How it Works:
Per-Bar Delta Calculation: For each bar on your chart, the indicator first calculates the net Volume Delta. This is done by looking at a finer, user-configurable Lower Timeframe (e.g., 1-minute data for a 15-minute chart bar) to determine the aggressive buying vs. selling volume within that bar.
Trailing Sum: The indicator then sums these individual per-bar net deltas over a user-defined Trailing Bars lookback period. For example, if "Trailing Bars" is set to 20, the TCVD value will represent the cumulative net delta of the last 20 bars.
Visualization:
The TCVD is plotted in a "MACD-Columns-Style" in a separate pane.
Teal: When the TCVD value is increasing (suggesting growing net buying pressure or diminishing net selling pressure over the trailing period).
Red: When the TCVD value is decreasing (suggesting growing net selling pressure or diminishing net buying pressure over the trailing period).
White: When it is returning to the mean.
How to Interpret and Use TCVD:
Trend Strength & Momentum:
A rising TCVD suggests that, on average over the trailing period, buying pressure is dominant or strengthening. This can confirm bullish price action or indicate underlying strength.
A falling TCVD suggests that selling pressure is dominant or strengthening, potentially confirming bearish price action or indicating weakness.
Divergences:
Unlike other Divergences, the CVD has two different types of Divergences: a) Absorption and b) Exhaustion. You only want to trade the Absorption pattern.
Zero Line Crossovers:
TCVD crossing above the zero line can indicate a shift towards net positive buying pressure over the lookback period.
TCVD crossing below the zero line can indicate a shift towards net positive selling pressure.
Confirmation: Use TCVD to confirm breakouts or breakdowns. A price breakout accompanied by a strongly rising TCVD is generally more reliable.
Key Settings:
Trailing Bars: (Default: 10)
Determines the number of recent bars to include in the cumulative delta sum.
Shorter periods make the TCVD more responsive to immediate changes.
Longer periods provide a smoother, longer-term view of order flow.
Use custom timeframe: (Checkbox, Default: false)
Allows you to override the automatic selection of the lower timeframe for delta calculation.
Timeframe for Delta Calculation: (Default: "1" - 1 minute)
Specifies the lower timeframe data used to calculate the volume delta for each individual chart bar.
Choosing a very fine timeframe (e.g., seconds) can provide high precision but may be limited by data availability or processing load.
If "Use custom timeframe" is unchecked, the script attempts to choose a sensible default based on your chart's timeframe (e.g., "1S" for second charts, "1" for intraday, "5" for daily, "60" for weekly+).
Examples:
Confirming Breakout Strength:
Price breaks out above a significant resistance level.
If the TCVD is also sharply rising and has perhaps crossed above its zero line, it provides confirmation that strong buying interest is fueling the breakout, increasing confidence in its validity.
Important Notes:
This indicator requires reliable volume data from your broker/data feed to function correctly. If your chart does not have volume, or if the volume data is unreliable, the TCVD will not be accurate.
Like all indicators, TCVD is best used as part of a comprehensive trading strategy, in conjunction with price action analysis and other indicators or tools.
Experiment with the Trailing Bars and Timeframe for Delta Calculation settings to find what best suits your trading style, the asset you are analyzing, and the chart timeframe you are using.
Feel free to modify this, add your personal touch, or include specific screenshots when you publish!

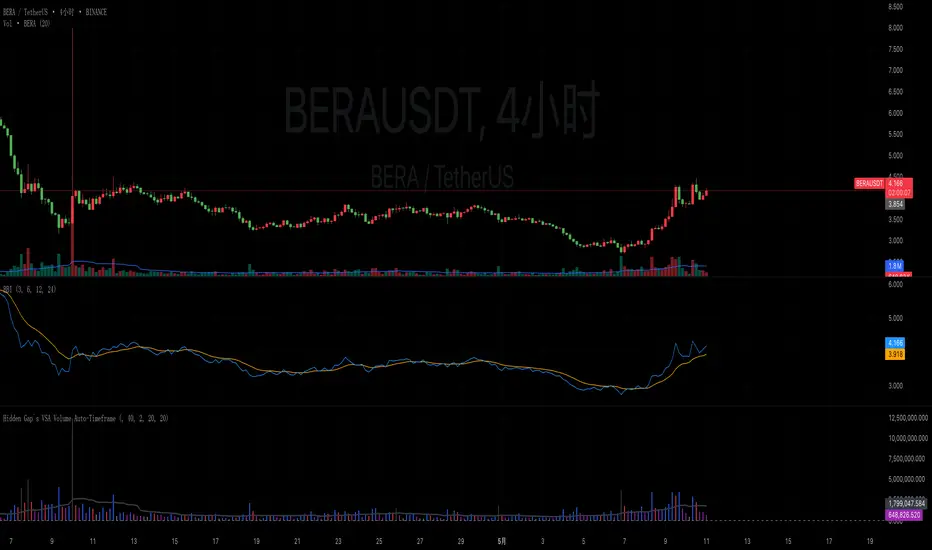
Hidden Gap`s VSA Volume Auto-TimeframeHidden Gap's VSA Volume with Auto-Timeframe Adaptation
Enhanced Version of Classic Volume Spread Analysis Indicator
Description:
This evolved version of the original "Hidden Gap's VSA Volume" indicator introduces intelligent timeframe adaptation while preserving its core Volume Spread Analysis (VSA) logic. The key enhancement automatically synchronizes volume calculations with your chart's current timeframe, eliminating manual resolution adjustments.
New Features:
✅ Auto-Timeframe Detection
Dynamically adjusts to any chart timeframe (1M/5M/1H/4H/D/W/M)
✅ Smart Resolution Switching
Seamlessly works across multiple timeframes without parameter changes
✅ Manual Override Option
Retains custom resolution input for multi-timeframe analysis (e.g., view weekly volume on daily charts)
✅ Modernized Engine
Upgraded to Pine Script v6 for optimal TradingView performance
Core Functionality Preserved:
• Multi-layer volume analysis using 40/20/2-period comparisons
• Color-coded histogram detecting:
Black: 40-period high volume
Gray: 20-period low volume
Purple: 2-period volume contraction
Blue/Red: Immediate volume changes
• Integrated 20-period SMA reference line
Usage Scenarios:
Intraday Trading: Auto-adjusts from 1-minute to 4-hour charts
Multi-Timeframe Analysis: Compare current volume against higher timeframe patterns
Swing Trading: Maintain consistent analysis across D/W/M timeframes
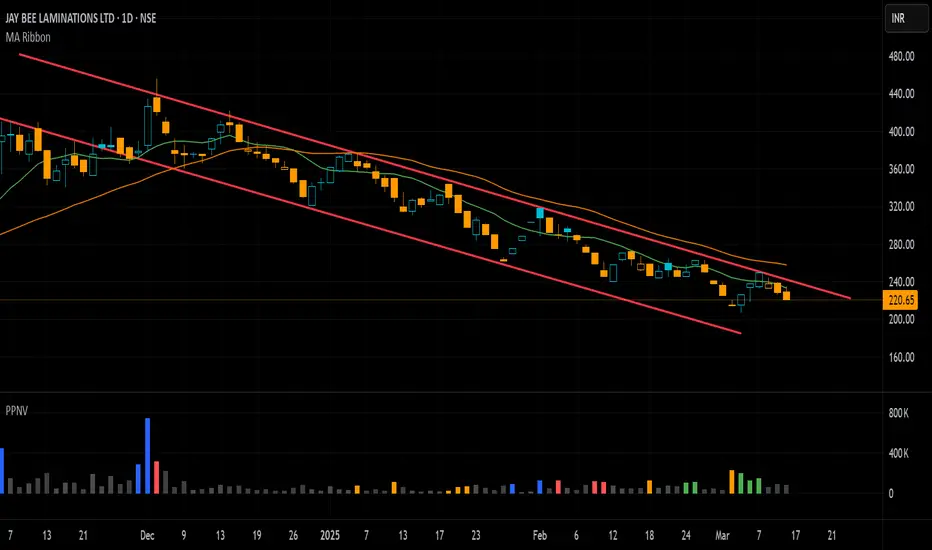
Pivot P/N VolumesTitle: Pivot P/N Volumes
Short Title: PPNV
Description:
The "Pivot P/N Volumes" indicator is a minimalistic volume analysis tool designed to cut through market noise and highlight key volume events in a separate pane. It strips away conventional volume clutter, focusing on four distinct volume types with clear visual cues, making it ideal for traders seeking actionable insights without distractions.
Key Features:
Blue Bars: Pocket Pivot Volumes (PPV) - Up-day volumes exceeding the highest down-day volume of the last 10 down-days, signaling potential bullish strength.
Orange Bars: Pivot Negative Volumes - Down-day volumes greater than the highest up-day volume of the last 10 up-days, indicating significant bearish pressure.
Red Bars: Down-day volumes above the 50-period EMA of volume, highlighting above-average selling activity.
Green Bars: Up-day volumes above the 50-period EMA of volume, showing above-average buying interest.
Noise: All other volumes are muted as dark grey (down-days) or light grey (up-days) for easy filtering.