Waves + XABCD v.1.0Advanced harmonic patterns scanner optimazed for Wave theory for Low or Medium wave rules.
It finds on the candle chart:
- Existing pattern with realized target in historic data.
- Potencial patterns with realized and potencial targets.
- Estimated patterns that may become potencial with their potencial targets (it updates instantly with the price change (before closing the bar). Such estimation can be confirmed or invalidated in minutes, but can give an advantage and be usefull on higher intervals.
Supports modified traiding patterns:
B.38
B.50
B.618
B.786
B.886
Shark
Cypher
Formation 5-0
Script with limited access, contact author to get authorization
Existing patterns visualization:
Potencial pattern visualization:
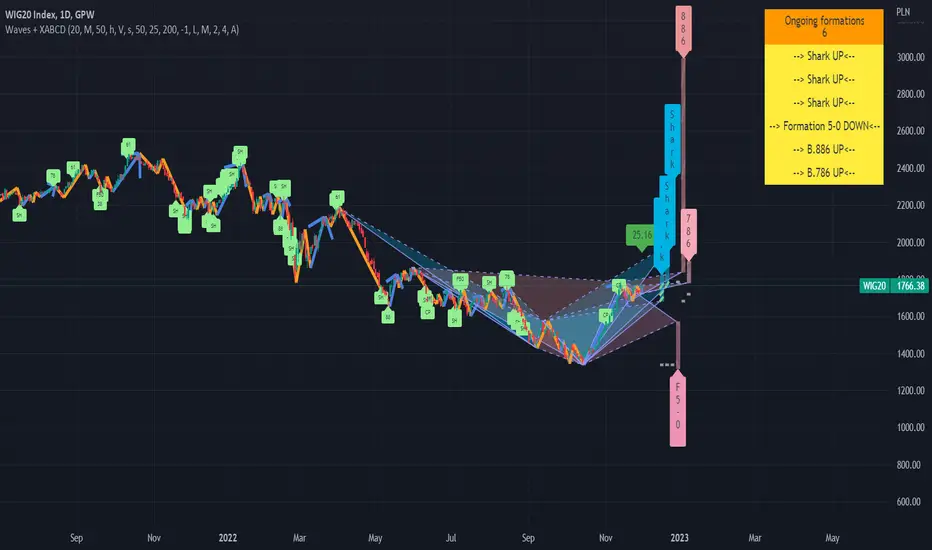
On the chart we can see few potencial patterns ( Sharks & Cyphers ). First target of first formation was realized and trend was changed. Chances of reaching targets in each pattern kind we can check by moving mouse over the label. tooltip will show:
- how many patterns are in historical data on this chart
- targets with % of cases in historical data on this chart when target was reached.
WARNING !!!
For each scanner configration and "D point limit" we can get different values. Also numbers of bars (traidingView account type) will change results. You can contact us for details how to optimaze settings for better performance.
Estimated patterns visualization:
On the chart we can see 2 estimated patterns based on current up trend. We can see that trend was already confirmed and will not change in this bar, but "if he had changed" the patterns will be accepted as potencial giving more arguments for move down.
Patterns performance data:
Below we can see chart with stats params set to "%". In the table on right we can see how many patterns were detected on the chart for the current configuration and how many of them reached particular level within the current D limit.
For each scanner configration and "D point limit" we can get different values. Also numbers of bars (traidingView account type) will change results. You can contact us for details how to optimaze settings for better performance.
Script settings:
| XABCD Scanner |
XABC dist limit - Specifies the maximum distance between successive pattern vertex .
Trend type - Specify which wave type should be used.
precision ‰ - It determines the maximum deviations from the conditions that must be met by the patterns. It also causes enlarge / blur of targets.
B.38, B.50, B.618, B.786, B.886, Shark, Cypher, Formation 5-0 - Filter specifying which patterns should be detected and allowing to set pattern color.
| XABCD Scanner Visualization |
You can configure visualziation for each pattern type separatelu:
Existing - Patterns in the historic data
Potencial - Patterns with known XABC vertrex, but without confirmed D.
Estimated - Dynamic patterns with not confirmed C vertex . After extreme formed they can be confirmed or invalidated.
Shape - Check if you want to see pattern shape.
Target - Check if you want to see posibble targets (In case of high precision value, lines become diagonal).
Label - Decide what format should have label. You can pick from: Fullname, shortname, vertical, hidden.
Targets: Filled/Not filled - Allow to change colors used for targets visualization.
Fill: targets/shape - Transparency param of the drawings.
| XABCD Scanner Statistics |
D point limit - A treshold for filter that counts statistics. If D will be reach after passing treshold it will not count as success in the statistics.
over limit color - Color used for patterns line visualization if D is over limit set in previous point.
pattern filter checkbox - Showing dialog with list of potencial patterns.
pattern filter - Field allowing to pick potencial pattern to show.
stats - Shows/hides stats table.
| Trend visualization |
Type - Specify switch what kind of wave should be drawn.
Confirmation - Draw "C" label if wave was confirmed and will not change in this bar. If wave is changing on this bar shows distance from the treshold.
Shadow - Draws second trendline based on the wave extremes.
Low/Mid line width and color - Wave drawing configuration.
| Impuls visualization |
Impuls - Picking graphical reprezentation of first bullish arrow.
Impuls color - Color of the first bullish arrow.
Draw arrow - Drawing arrow on the end of impuls wave.
Troubleshooting:
In case of any problems, please contact the author of the script. To improve speed of solving problem first check if script is drawn, and if there is a "!" character after script params. If you can see "!" character, move cursor over it for detail. Send message with error details, ticker and interval to us. The more precise will be your description the faster we will be able to help you.
"wave"に関するスクリプトを検索
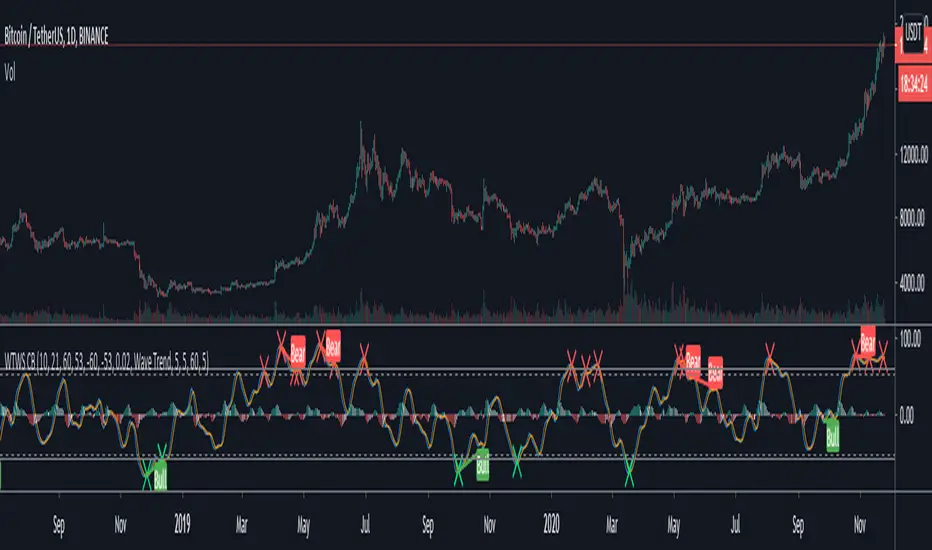
WaveTrend [LazyBear] vX by DGTDGT interpreted version of LazyBear's WaveTrend, visualizing on Price Chart
Original Author : LazyBear
Crosses above or below threshold are emphasized with bigger labels
- crosses above threshold : probable short indications with a bigger label and relativly small label for probable long indications
- crosses below threshold : probable long indications with a bigger label and relativly small label for probable short indications
All rest crosses within threshold boundaries with relatively small labels for both long and short probable indications

Wave Trend With Signals [ChuckBanger]A wave trend script based on LazyBears script but with added signals and a histogram...
WaveTrend - Market Cipher BHey guys,
Just releasing a quick copy of LazyBear's wavetrend indicator slightly modified to be more reactive and contains a few other extras for people who don't have pro like a stochastic and RSI indicator above the wave to find more confluence.
The indicator will show crosses but shows them below the indicator as well if they are stronger removing some noise.

WaveTrend Oscillator V2Version 2 of the Wave Trend Indicator now includes a test strategy feature.
Same Entry and Exit Conditions as before. These values can be adjusted to pick up higher bottoms if needed. This strategy appears to work well with Cannabis stocks and has been tested out with TSX:ACB , TSX:HEXO , TSX:CRON , TSXV:OGI just to name a few.
Entry and Exits:
Entry when Wave cross occurs below or within the bottom band
Exit when Wave cross occurs above or within the top band
Alert Settings:
"Buy" is less than "Over Sold Top"
"Sell" is greater than "Over Bought Bottom"
As always, trade at your own risk. Recommended to confirm entry and exits with other oscillators such as Stochastic, RSI or MACD.

WaveTrend OscillatorSimilar to other Wave Trend Oscillators out there but I added "Buy" & "Sell" signals and alerts can set as well.
Entry and Exits:
Entry when Wave cross occurs below or within the bottom band
Exit when Wave cross occurs above or within the top band
Alert Settings:
"Buy" is less than "Over Sold Top"
"Sell" is greater than "Over Bought Bottom"


Elliott Wave + SMC Fusion # Elliott Wave + SMC Fusion
## TITLE:
Elliott Wave + Smart Money Concepts Fusion
---
## SHORT DESCRIPTION:
Automated Elliott Wave pattern detection with Smart Money Concepts confirmation, EWO oscillator integration, and confluence scoring system.
---
## FULL DESCRIPTION:
### 📊 OVERVIEW
This indicator combines three powerful trading methodologies into a unified system:
- **Elliott Wave Theory** - Automated detection of Wave 1-2 impulse patterns
- **Smart Money Concepts (SMC)** - Order Blocks and Fair Value Gaps for institutional confirmation
- **Elliott Wave Oscillator (EWO)** - Momentum-based signal validation
The core concept is to identify high-probability Wave 3 entries by detecting completed Wave 1-2 structures and validating them with SMC and momentum indicators.
---
### 🔧 HOW IT WORKS
**1. Pattern Detection (ZigZag Method)**
- Uses pivot high/low detection to identify swing points
- Validates Wave 2 retracement using Fibonacci ratios (default: 38.2% - 88.6%)
- Requires minimum wave size to filter noise
- Applies confirmation bars to avoid premature signals
**2. Wave Projections**
- Wave 3 target: Fibonacci extension of Wave 1 (default: 1.618)
- Wave 4 retracement: Percentage of Wave 3 (default: 38.2%)
- Wave 5 projection: Extension of Wave 1 from Wave 4
**3. Smart Money Validation**
- **Order Blocks**: Identifies last opposing candle before breakout (institutional footprint)
- **Fair Value Gaps**: Detects price imbalances for potential support/resistance
**4. EWO Confirmation**
- Calculates momentum: (EMA5 / EMA34 - 1) × 100
- Signal line crossovers confirm trend direction
- Strong signals occur at extremes (< -13 or > 13 threshold)
**5. Confluence Scoring (0-100%)**
Points awarded for:
- Fibonacci quality of Wave 2 retracement (10-30 pts)
- Order Block presence (15 pts)
- Fair Value Gap presence (10 pts)
- Volume confirmation (10-15 pts)
- Trend alignment with EMA50 (10 pts)
- EWO confirmation (10-20 pts)
---
### 🎯 UNIQUE FEATURES
**Pattern Locking System**
- Once a valid pattern is detected, it locks until:
- Pattern invalidates (price breaks Wave 0)
- Pattern completes (Wave 5 reached)
- Auto-timeout (configurable bars)
- Prevents rapid signal flipping and false alerts
**Signal Stability Controls**
- Adjustable cooldown between signals (default: 20 bars)
- Minimum bar distance between wave points
- Direction change requirement option
- Confirmation bars after Wave 2 formation
**Visual Wave Tracking**
- Solid lines for impulse waves (0→1, 2→3, 4→5)
- Dashed lines for corrective waves (1→2, 3→4)
- Numbered labels on each wave point
- Real-time projection lines to targets
**Comprehensive Dashboard**
- Current wave status and lock state
- Pattern grade (A+ to D based on confluence)
- Projected vs actual wave levels (✓ when completed)
- SMC confirmation status
- Risk/Reward ratio calculation
- EWO trend direction
---
### 📈 TRADING APPLICATION
**Entry Strategy**
- Wait for Wave 1-2 pattern detection (diamond signal)
- Check confluence score (>65% = higher probability)
- Verify EWO alignment with pattern direction
- Enter after 30% retracement of Wave 2 (customizable)
**Risk Management**
- Stop Loss: Below Wave 0 (with buffer)
- Take Profit 1: Wave 3 projection
- Take Profit 2: Wave 5 projection
- R:R displayed in dashboard
**Invalidation Rules**
- Price breaks below Wave 0 (bullish) or above (bearish)
- Wave 2 level violated before Wave 3 forms
- Pattern timeout exceeded
---
### ⚙️ KEY SETTINGS
**Elliott Wave**
- ZigZag Length: Pivot detection sensitivity
- Fib Tolerance: Acceptable retracement range
- Min Wave Size: Filter small movements
**Signal Stability**
- Signal Cooldown: Minimum bars between signals
- Lock Pattern Until Invalid: Prevent signal changes
- Confirmation Bars: Wait after Wave 2
**Wave Projection**
- Wave 3/4/5 Fibonacci extensions
- Projection display distance
**EWO Settings**
- Fast/Slow EMA lengths
- Signal smoothing
- Strength threshold
**SMC Settings**
- Order Block lookback period
- FVG minimum size percentage
---
### 🔔 ALERTS
- New bullish/bearish pattern detected
- High confluence setup (>75%)
- Pattern invalidation
- Wave completion
---
### ⚠️ IMPORTANT NOTES
- This indicator identifies **potential** Elliott Wave patterns based on mathematical rules
- Elliott Wave analysis is subjective - patterns may be interpreted differently
- Always combine with other analysis methods and proper risk management
- Past pattern performance does not guarantee future results
- Pattern locking prevents repainting but delays new pattern detection
- Best used on higher timeframes (1H+) for cleaner wave structures
---
### 📚 METHODOLOGY REFERENCES
**Elliott Wave Theory**
- Wave 2 typically retraces 38.2% - 88.6% of Wave 1
- Wave 3 is often the strongest, extending 161.8% of Wave 1
- Wave 4 usually retraces 38.2% of Wave 3
- Wave 5 completes the impulse structure
**Smart Money Concepts**
- Order Blocks represent institutional supply/demand zones
- FVGs indicate price inefficiencies that may act as magnets
**Elliott Wave Oscillator**
- Developed to identify wave momentum
- Crossovers signal potential wave transitions
- Extreme readings often coincide with wave completions
---
### 🎨 VISUAL ELEMENTS
- **Green**: Bullish patterns and projections
- **Red**: Bearish patterns and projections
- **Orange**: Wave projection levels
- **Purple**: Order Block zones
- **Yellow**: Fair Value Gaps
- **Blue**: Entry levels
- **Diamond shapes**: New pattern signals
- **Triangle shapes**: EWO crossover signals
---
### 💡 TIPS FOR BEST RESULTS
1. Use on liquid markets with clear trend behavior
2. Higher timeframes produce more reliable patterns
3. Look for confluence scores above 65%
4. Verify EWO alignment before entry
5. Consider market context (overall trend, key levels)
6. Adjust ZigZag length based on your trading style
7. Increase cooldown period for longer-term signals
---
**Indicator Type**: Overlay
**Markets**: All (Crypto, Forex, Stocks, Commodities)
**Timeframes**: All (1H+ recommended)
**Style**: Pattern Recognition + Momentum + Price Action

Wave Surge [UAlgo]The "Wave Surge " is a comprehensive indicator designed to provide advanced wave pattern analysis for market trends and price movements. Built with customizable parameters, it caters to both beginner and advanced traders looking to improve their decision-making process.
This indicator utilizes wave-based calculations, adaptive thresholds, and volume analysis to detect and visualize key market signals. By integrating multiple analysis techniques.
It calculates waves for high, low, and close prices using a configurable moving average (EMA) technique and pairs it with volume and baseline analysis to confirm patterns. The result is a robust framework for identifying potential entry and exit points in the market.
🔶 Key Features
Wave-Based Analysis: This indicator computes waves using exponential moving averages (EMA) of high, low, and close prices, with an adjustable wave period to suit different market conditions.
Customizable Baseline: Traders can select from multiple baseline types, including VWMA (Volume-Weighted Moving Average), EMA, SMA (Simple Moving Average), and HMA (Hull Moving Average), for trend confirmation.
Adaptive Thresholds: The adaptive threshold feature dynamically adjusts sensitivity based on a chosen period, ensuring the indicator remains responsive to varying market volatility.
Volume Analysis: The integrated volume analysis calculates volume ratios and allows traders to enable or disable this feature to refine signal accuracy.
Pattern Recognition: The indicator identifies specific wave patterns (Wave 1, Wave 3, Wave 4, Wave 5, Wave 6) and visually plots them on the chart for easy interpretation.
Visual and Color-Coded Signals: Clear visual signals (upward and downward arrows) are plotted on the chart to highlight potential bullish or bearish patterns. The baseline is color-coded for an intuitive understanding of market trends.
Configuration: Parameters for wave period, baseline length, volume factors, and sensitivity can be tailored to align with the trader’s strategy and market environment.
🔶 Interpreting the Indicator
Wave Patterns
The indicator detects and plots six unique wave patterns based on price changes that exceed an adaptive threshold. These patterns are validated by the direction of the baseline:
Wave 1 (Bullish): Triggered when the price increases above the threshold while the baseline is falling.
Wave 3, 4, and 6 (Bearish): Indicate potential downtrends validated by a rising baseline.
Wave 5 (Bullish): Suggests upward momentum when prices exceed the threshold with a falling baseline.
Baseline Trend
The baseline serves as a trend confirmation tool, dynamically changing color to reflect market direction:
Aqua (Rising): Indicates an upward trend.
Red (Falling): Indicates a downward trend.
Volume Confirmation
When enabled, the volume analysis feature ensures that signals are supported by significant volume movements. Patterns with high volume are considered more reliable.
Signal Visualization
Upward Arrows (🡹): Highlight potential bullish opportunities.
Downward Arrows (🡻): Highlight potential bearish opportunities.
Alerts
Alerts are triggered when key wave patterns are identified, providing traders with timely notifications to take action without being tied to the screen.
🔶 Disclaimer
Use with Caution: This indicator is provided for educational and informational purposes only and should not be considered as financial advice. Users should exercise caution and perform their own analysis before making trading decisions based on the indicator's signals.
Not Financial Advice: The information provided by this indicator does not constitute financial advice, and the creator (UAlgo) shall not be held responsible for any trading losses incurred as a result of using this indicator.
Backtesting Recommended: Traders are encouraged to backtest the indicator thoroughly on historical data before using it in live trading to assess its performance and suitability for their trading strategies.
Risk Management: Trading involves inherent risks, and users should implement proper risk management strategies, including but not limited to stop-loss orders and position sizing, to mitigate potential losses.
No Guarantees: The accuracy and reliability of the indicator's signals cannot be guaranteed, as they are based on historical price data and past performance may not be indicative of future results.

RSI Momentum Waves [Quantigenics]RSI Momentum Waves Indicator
The RSI Momentum Waves Indicator is your intuitive tool for visualizing market strength and trend persistence. It refines the classic RSI by smoothing the data with Exponential Moving Averages (EMAs), which help clear out the noise to give you a more accurate picture of where the market’s heading. The parameters - RSI Period, Smoothing Period, Overbought, Oversold, Upper Neutral Zone, and Lower Neutral Zone - are all adjustable, so you can tailor the indicator to different market conditions or your trading style.
How It Works:
RSI Period (RsiPer): Adjusts how far back the RSI looks to calculate its value, affecting its sensitivity.
Smoothing Period (SmoothPer): Dictates how smooth the EMA lines are, balancing between sensitivity and noise reduction.
Overbought (OBLevel) / Oversold (OSLevel) Levels: Set the thresholds where the market might be too stretched in either direction and due for a reversal.
Neutral Zones (UpperNZ / LowerNZ): Define the areas where the market is considered neutral, and trend strength is less clear.
Trading Instructions:
Use the RSI Momentum Waves to gain insights into the market’s momentum and make informed decisions:
For Trend Identification: If the waves are consistently above the 50 line and climbing, the market may be bullish; if below and declining, bearish signals are suggested.
Overbought and Oversold Regions: Entering these areas might indicate a potential reversal. A peak and downturn in the overbought region can signal a sell, while a trough and upturn in the oversold region can indicate a buy.
Neutral Zone Caution: In the neutral zones, exercise caution and wait for a breakout in either direction for stronger signals.
Confirm with Other Analysis: Never rely solely on one indicator. Confirm the RSI Momentum Waves signals with other technical indicators or fundamental analysis for best practices.
Remember, the goal is to detect the rhythm of the market’s momentum and act accordingly. Happy trading!

Wave Pendulum Trend [QuantraSystems]Wave Pendulum Trend
Introduction
The Wave Pendulum Trend (𝓟𝓮𝓷𝓭𝓾𝓵𝓾𝓶 𝓣𝓻𝓮𝓷𝓭) extrapolates market trends using physical principles derived from waves and pendulums. This indicator is a bespoke build, and its performance and behavior cannot be compared to existing indicators.
It is designed for trend following but is also effective for identifying mean reversions, momentum strength, and shows range-bound market periods within the dynamic bands.
In order to ascertain a smooth yet rapid trend direction of the market, the 𝓟𝓮𝓷𝓭𝓾𝓵𝓾𝓶 𝓣𝓻𝓮𝓷𝓭 combines several factors. A bespoke set of functions captures the momentum of price movements and dynamically weighs it over time. The indicator then extrapolates acceleration from the change in delta of price movements.
Legend
With bar coloring enabled, the price section mirrors current trend conditions. Please keep this feature disabled if you intend to use multiple indicators to avoid confusion.
The 𝓟𝓮𝓷𝓭𝓾𝓵𝓾𝓶 𝓣𝓻𝓮𝓷𝓭 presents extensive market insights. The purple and green bands around the oscillator signal the selected standard deviation (default σ = 2), for the trader to calculate how common the trending movements are in relation to the selected asset’s history.
The inner, dynamic thresholds, indicated by the blue “Range-bound market” label in the graphic above, border the area that signals a ranging market if both 𝓐𝓬𝓬𝓮𝓵𝓮𝓻𝓪𝓽𝓲𝓸𝓷 and 𝓜𝓸𝓶𝓮𝓷𝓽𝓾𝓶 signals remain inside. If either line exceeds these thresholds, care is advised as a shift in market behavior is underway.
“Trend strength” in the graphic provides a good estimate for the trending movements strength.
If the signal lines exceed the set standard deviation in non-classic mode, a reversal is very likely.
Case Study
As shown in the above case study we see two profitable swing trades on the 4H chart of Ethereum. Please note the display variant here is set to “Heikin-Ashi”.
We always recommend using a multitude of indicators to attain multiple signals on the likelihood of opening the correct position. However, this standalone scenario serves as an example on how the 𝓟𝓮𝓷𝓭𝓾𝓵𝓾𝓶 𝓣𝓻𝓮𝓷𝓭 added two profitable swing trades.
The first short trade was opened after the 𝓐𝓬𝓬𝓮𝓵𝓮𝓻𝓪𝓽𝓲𝓸𝓷 and 𝓜𝓸𝓶𝓮𝓷𝓽𝓾𝓶 reversed after crossing the threshold of standard deviation. This trade offered a late entry only, these two factors were followed late by the third signal in this case – the trend reversal. Such a trade would require additional indicators to signal at the same time, so the trader can get more confirmations. The trade was closed after 6D with an 8% gain on a 1x short position.
The second trade is a long position that enters in the same manner. The trader takes the reversal beyond the select standard deviation as a likely entry. After 7D a triple confirmation was received, as indicated by the triangle, that a reversal or at least a plateau is extremely likely. The trade was closed after 7D with a 17.23% gain on a 1x long position.
Recommended Settings
Trend Following / Investing (1D chart)
Please use the default settings!
Swing Trading (4H chart)
Wave MA - Type: TEMA
Wave MA – Length: 30
Display Variant: Heikin-Ashi
Bar Coloring: Off
Choose Mode for Coloring: Signal
Notes
Quantra Standard Value Contents:
The Heikin-Ashi (HA) candle visualization smoothes out the signal line to provide more informative insights into momentum and trends. This allows earlier entries and exits by observing the indicator values transformed by the HA.
Various visualization options are available to adjust the indicator to the user’s preference: Aside from HA, a classic line, or a hybrid of both.
A special feature of Quantra’s indicators is that they are probabilistically built - therefore they work well as confluence and can easily be stacked to increase signal accuracy.
To add to Quantra's indicators’ utility we have added the option to change the price bars colors based on different signals:
Settings: TEMA and DEMA length settings should be longer compared to other Moving Averages (MAs). Due to its complex calculations, the indicator requires a larger amount of historical data for accurate computation.
Sensitivity to Divergences: The Wave Pendulum Trend is particularly sensitive to divergences, making it a useful tool in spotting potential trend reversals or continuations.
Trend Following and Reversions: While it is primarily used for trend following, it also excels in identifying market reversions.
Momentum and Acceleration: The interaction between momentum and acceleration is a key feature of this indicator.
Visualization: The indicator offers various visualization options, including bar coloring based on HA Candles and extremes and trends. It also introduces a novel approach to visualizing the oscillator in the "Classic" mode and provides an adjustable Standard Deviation (SD) measure for reversal signals in non-classic modes.
Choose Mode for Coloring
Trend Following (Indicator above mid line counts as uptrend, below is downtrend)
Extremes (Everything beyond the SD bands is highlighted to signal mean reversion)
Candles (Color of HA candles as barcolor)
Reversions (Only for HA) (Reversion Signals via the triangles if HA candles change trend while beyond the SD bands, high probability entries/exits)
Methodology
The methodology behind the Wave Pendulum Trend is inspired by wave and pendulum theories to extrapolate market moves. By calculating the momentum and its acceleration from price data, it provides a nuanced view of the market trend.
Traders should observe the color coding, which reflects the interplay between momentum, acceleration, and set thresholds for acceleration. The Signal Mode is particularly useful for quickly identifying trend, momentum, and acceleration exhaustions.
Additionally, the indicator can help filter out ranges with insufficient momentum acceleration. Traders are encouraged to experiment with this mode and adjust the threshold settings to suit their strategies.

Tom Joseph MACD 5-35 for Elliot WavesThis oscillator for the Elliott Theory has been invented by Tom Joseph and it's useful to correctly count the impulsive and corrective waves.
Its difference compared to a simple MACD is the peculiarity to use the ratio between the Fast SMA (default period set to 5) and the Slow SMA (default period se to 35).
The used formula is as below:
( (fast_SMA / slow_SMA) -1 ) * 100
Hope you could find it useful! 😉

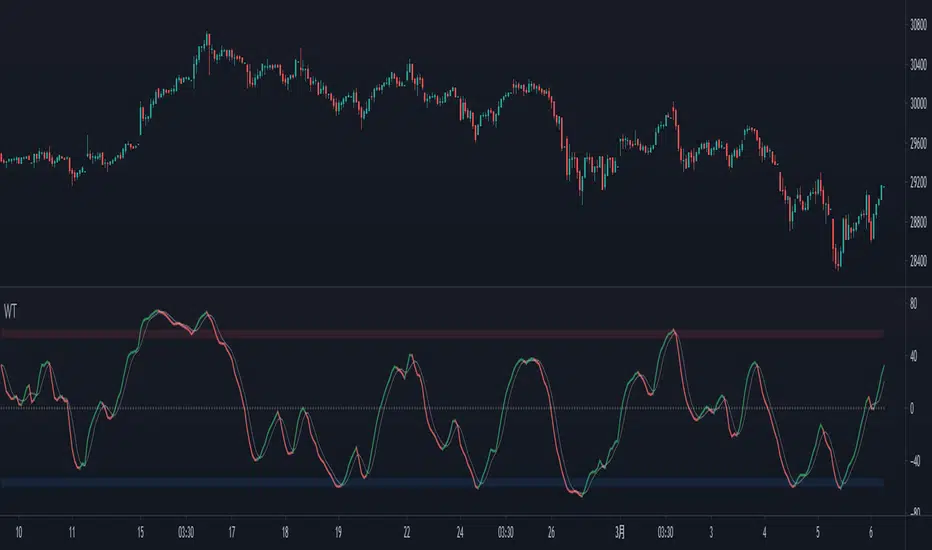
Wave Trend OscillatorThis is a very standard version of the Wave Trend Oscillator.
The Channel and Average values are displayed as lines, most people display them as areas.
The Channel and Average difference is displayed as a histogram, most people display it as a tiny noisy area.
I was unable to find a standard version of the Wave Trend Oscillator.
The colorful hyped up versions of this indicator made me feel like a clown while using them.
I have essentially copied the style of the MACD with this indicator, to keep things professional.
With this WTO, you can change the timeframe and source.
You can also change the histogram average length and multiplier, making it usable.
The typical way that people display the histogram is completely unusable and just for appearance.
Now it does a decent job showing when the momentum of the WTO's downward movement is slowing down, just like how the MACD histogram works.
This indicator is essentially a normalized MACD, though they are calculated differently.
The Wave Trend Oscillator is useful for spotting/monitoring changed in mid-trend momentum.
In my experience, divergence in this indicator is a strong signal.
If the MACD is too slow for you, then this is a great alternative; without all the extra fluff people usually add to it.

Wave MasterThis indicator is built on Stochastics and pulls data from multiple timeframes to give you a birds eye view on where your asset is at a point in time. There are several factors that go into this indicator:
OVERBOUGHT
When all waves have all migrated to the overbought area, this is a high probability area to go short or take profit off the table.
OVERSOLD
When all waves have migrated to the oversold area, typically this indicates a high probability place to take a long position or purchase some equity.
VISUAL AIDS
Several visual aids have been included in this indicator to assist you, as a trader, to help you easily see what is going on.
Upper/Lower Dots - Green/Yellow/Red dots indicate a cross has occurred. Each color corresponding with the wave in the indicator
Color Coded Background - Red indicates green/yellow wave have gone into overbought territory and green background indicates green/yellow wave have gone into oversold territory. White slices in the background indicate the green has crossed (while in overbought/oversold)
12h/daily candle confirmation - When the 12hr (crypto) or daily (stocks) have crossed, a bright green or bright red candle will appear in the chart to help you indicate a potential for a change in trend
Simple Wave Trend Wave Trend Oscillator with minimal functionality.
- Change color by crossing
- Overboughtr and Oversold band
- Zero line
WaveTrend Oscillator v2 [Aspenforest]This is your regular WaveTrend Oscillator, which was originally scripted by LazyBear, but I updated the source code to Pine Script version 4, refactored the logic, and made the indicator more aesthetically pleasing.

WaveTrend+ Strategy [SystemAlpha]This is a WaveTrend strategy based on WaveTrend Oscillator. In addition to using the normal crossovers, we use trend filters, trailing stop loss and take profit targets. WT+ Strategy was developed for crypto, forex and stocks for 15 minutes to daily timeframe. The main goal was to catch long term trends and ride them.
In this strategy you have a choice of:
Trend Filters:
- Average Directional Index (ADX) – buy when price is trend is up and sell when trend is down.
- Moving Average (MA) – buy when price close above the defined moving average and sell when price close below moving average
- Parabolic SAR – buy when SAR is above price is above price and sell when SAR is below price.
- All - Use ADX, MA and SAR as filters
For MA Filter , you can use the “TF MA Type” and "TF MA Period" parameter to select Simple or Exponential Moving Average and length.
Stop Loss:
- Average True Range (ATR) – ATR % stop as trailing stop loss.
- Parabolic SAR (SAR) – Parabolic SAR adapted as trailing stop loss.
For ATR , you can use the “ATR Trailing Stop Multiplier” parameter to set an initial offset for trailing stop loss.
Take Profit Target:
- Average True Range (ATR) – ATR % stop as trailing stop loss.
- Standard % – Percent as target profit
For ATR , you can use the “ATR Take Profit Multiplier” parameter to set an initial offset for trailing stop loss.
Additional feature include:
- Regular and Hidden Divergence display and alerts
- Filter Overbought and Oversold
- Use WT Cross for Exit
STRATEGY ONLY:
- Set backtest dates
- Set Trade direction - Long, Short or Both
- Use timed exit - Select method and bars
- Method 1: Exit after specified number of bars.
- Method 2: Exit after specified number of bars, ONLY if position is currently profitable.
- Method 3: Exit after specified number of bars, ONLY if position is currently losing.
TradingView Links:
WT+ Oscillator Companion:
WT+ Alerts:
How to use:
1. Apply the script by browsing through Indicators --> Invite-Only scripts and select the indicator
2. Once loaded, click the gear (settings) button to select/adjust the parameters based on your preference.
3. Wait for the next BUY or SELL signal to enter the trade!
Disclaimer:
The indicator and signals generated do not constitute investment advice; are provided solely for informational purposes and therefore is not an offer to buy or sell a security; are not warranted to be correct, complete or accurate; and are subject to change without notice.

WaveTrend+ Alerts [SystemAlpha]This is the alert companion of the WaveTrend+ Strategy . Instead of using just the normal crossovers, we use trend filters, trailing stop loss and take profit targets. WT+ Strategy was developed for crypto, forex and stocks for 15 minutes to daily timeframe. The main goal was to catch long term trends and ride them.
In this alert you have a choice of:
Trend Filters:
- Average Directional Index (ADX) – buy when price is trend is up and sell when trend is down.
- Moving Average (MA) – buy when price close above the defined moving average and sell when price close below moving average
- Parabolic SAR – buy when SAR is above price is above price and sell when SAR is below price.
- All - Use ADX, MA and SAR as filters
For MA Filter , you can use the “TF MA Type” and "TF MA Period" parameter to select Simple or Exponential Moving Average and length.
Stop Loss:
- Average True Range (ATR) – ATR % stop as trailing stop loss.
- Parabolic SAR (SAR) – Parabolic SAR adapted as trailing stop loss.
For ATR , you can use the “ATR Trailing Stop Multiplier” parameter to set an initial offset for trailing stop loss.
Take Profit Target:
- Average True Range (ATR) – ATR % stop as trailing stop loss.
- Standard % – Percent as target profit
For ATR , you can use the “ATR Take Profit Multiplier” parameter to set an initial offset for trailing stop loss.
Additional feature include:
- Regular and Hidden Divergence display and alerts
- Filter Overbought and Oversold
- Use WT Cross for Exit
TradingView Links:
WT+ Oscillator:
How to use:
1. Apply the script by browsing through Indicators --> Invite-Only scripts and select the indicator
2. Once loaded, click the gear (settings) button to select/adjust the parameters based on your preference.
3. Wait for the next BUY or SELL signal to enter the trade!
Disclaimer:
The indicator and signals generated do not constitute investment advice; are provided solely for informational purposes and therefore is not an offer to buy or sell a security; are not warranted to be correct, complete or accurate; and are subject to change without notice.

WaveTrend Oscillator w/ Short/Long/Close Alerts - WIPHigh TFs work best, but it works on any TF. I plan to continue releasing updates to it to improve overall form and function. Green Circles are Long Alerts, Red Circles are Short Alerts. Blue and Yellow Circles are Close Position Alerts. First Blue Circle After Red Circle would be Short Exit. First Yellow Circle After Green Circle would be Long Exit.
Original script was based on Lazybear Indicator-WaveTrend-Oscillator-WT Script. I have added and modified some code to my personal liking.

WaveTrend Simple Oscillator [NinjaDawgz]Building on my previous I've attempted to distill everything down into its simplest form. All you need is to understand what the oscillator is telling you!
Oscillator line crosses will trigger a signal and are colored in the respective direction for clarity.
At its very basic usage, you can sell signals once they're oversold/overbought. Anything above/below the double lines are considered extreme. Using money management and standard trading techniques, like waiting for price to break the high/low of the triggering bar, will yield significant risk:reward ratio's that are profitable.
More advanced usage are using pattern recognition for both reversal and continuation signals. Any pair of opposite signals within a few bar's are powerful continuation signals.
Highly advanced usage is to find Elliot Wave patterns (mainly corrective patterns like flats but any pattern) in the oscillator itself, as well as leveraging the oscillator to identify corrections on chart. Finally, the oscillator will give you the (sub)pattern completion by printing a signal on oscillator.
This works for any security on any timeframe.

WaveTrend Oscillator + Divergence + Direction Detection +AlertsMake this version of the famous WaveTrend indicator has the following characteristics:
- WaveTrend direction detection
- Customizable overbought and oversold level (set by default just like the original version)
- Possibility to modify the length of the channel (set by default same as the original version)
- Possibility of modifying mobile period (set by default same as the original version)
- Show ONLY overbought sales.
- Show all sales.
- Show ONLY purchases in oversold.
- Show all purchases.
- See histogram.
- See half signal.
- Paint Bars.
- Modification of colors.
Alerts:
The indicator has the following alerts:
- Sales in oversold
- All Sales
- Purchases in oversold
- All Purchases
- Purchases / Overbought sales / Sales
- All Sales / Purchases
- Change WT Direction
NOTE: This single indicator should not be taken as a trading strategy is only a tool for the trader that gives a sense of depth market and potential opportunities for purchase / sale which must be evaluated in the context generally used this indicator to look for positions in areas of overbought / sell, also for detecting differences, other aspects such as the direction of Wavetrend, levels, histogram, etc, also provide useful information.
Release Notes: Add a field to change reaction and color change direction WT, is set to 1 as fast (default), better greater number address filter but is slower.
Release Notes: Add a Hidden Divergences detector and Regulars (bulls and the bears), from setup can activate them, also can turn off the labels and leave only the lines, configure it to your liking.
NOTE: SCRIPT IN SPANISH

APEX - WaveTrend [v1]WaveTrend is a smoothed oscillator which enables it to detect true reversals in an extremely accurate manner. The beauty of this indicator is that does not generate signals during choppy sideways markets.
The basic settings are 10 / 3 / 4 these are very aggressive settings, that will generate a lot of signals in all even not so volatile markets. If you need high-quality signals you settings close to 10 / 3 /21. The strongest buy/sell signals are given when the cross occurs above or below the threshold. In the 10 / 3 / 4 you threshold for buy should be around -90 values. If you use the very smoothed variant the threshold will be around -45 to -50 values.
This indicator will be first available in APEX v1 currently being beta tested.

WaveTrend with Pump Candle Rejection [Reuter]This is my first script, a strategy I tested on the ADABTC pair, 30m Time Frame.
To made this strat I used the Wave Trend Oscillator from LazyBear and some calculations to measure the confirmation candle and the previous candle.
The idea for this strat is to enter the market on a lower level through the wt1-wt2, catching a possible bounce back. For us to not get so much in trouble, I made a candle meter, so we don`t enter on a pumped candle.
It`s a simple script, you can apply to other pair and markets, but you need to play around with the settings to match the best conditions. Still have to see if I can minimize the bear market buys with other indicator.
If you liked my idea and it helped you give this strat a like!
BTC: 3HDgosPC7s45D2nAC6pUfFuyt5ZS94wrBQ
Nano: xrb_3qr1aa4ey6odbxr1hrrthehg3oif58sgreopbj4i74d7wqs1bmbxmmuaicse
