RSI Bands Multi Time Frame [Jigga + LazyBear]This is a modified version of LazyBear's RSI Bands script. I added the possibility to display multiple RSI bands, so you can see the zones, where it is viable to enter a long or a short. You can also use different time frames, so you can visually see where any specific value of RSI is for your given time frame. This gives you a lot of possibilities. Default settings use 1h time frame and the most common reversal areas for RSI. Feel free to change the settings as you see fit. If the script makes your candles too small, you can go to style and turn off individual RSI bands. After that you will still be able to see the zones, but the scale of your chart won't be affected.
It also displays the middle line, which shows you the current trend and can prevent you from entering a long, when RSI is oversold during a strong downtrend or a short, when RSI is overbought during a strong uptrend.
Do not forget to use a proper stop loss and risk management.
Here you can see it in action in different markets:
BTC - BitMex
NASDAQ Composite - Stocks
EUR / USD - Forex
"zone"に関するスクリプトを検索


Better CME Margin Zones 25-200%Better indicator for CME Margin Zones
25%,50%,100%,200% zones included)

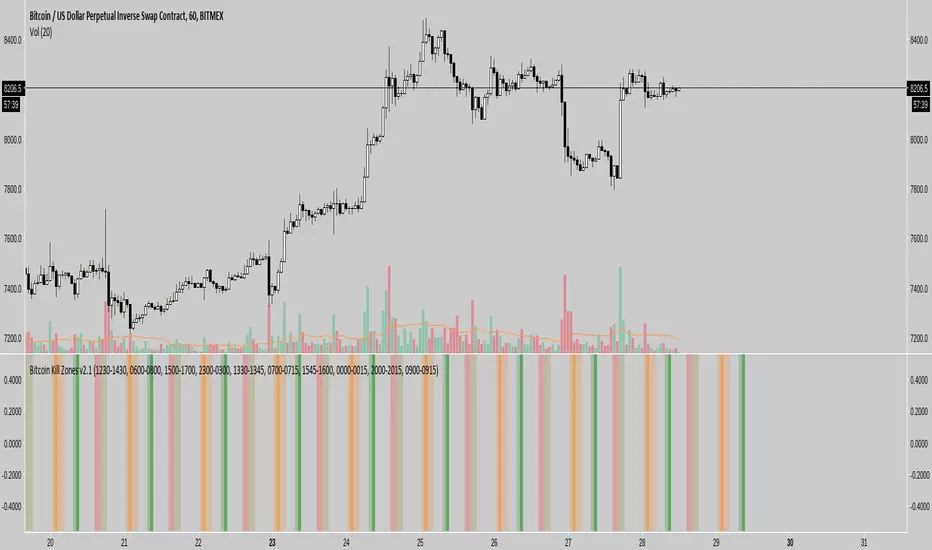
Bitcoin Kill Zones v2 [oscarvs] (UTC + 8)The Kill Zone script was modified to UTC + 8, Singapore to Beijing time.

Dynamic ZonesA port of the MT4 indicator of Mladen Rakic found at www.mql5.com
which is based on Dynamic Zones that was originally published in Stocks & Commodities 1996 issue.
Dynamic Zones is meant to be applied to oscillators to get dynamic overbought and oversold levels
quantified using statistical methods.

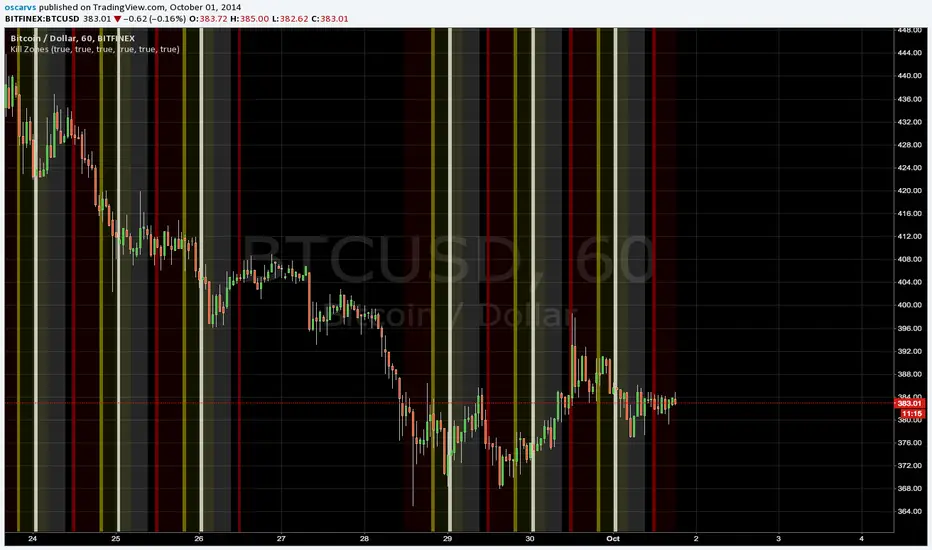
Kill Zones******* UPDATED VERSION *******
Use this one:
****************************************
>> OLD STUFF, please use the UPDATED version!!! <<
COPY & PASTE the code and change manually hours to reflect reality regardless selected TimeZone:
doNYOpen "1300-1310"
doNYSession "1300-0000"
doTokyoOpen "0030-0040"
doTokyoSession "0030-0930"
doLondonOpen "0800-0810"
doLondonSession "0800-1700"
MAJOR PA Zones + Structure + Targets (Gray/Purple)This script highlights major price-action structure (HH/HL/LH/LL), marks BOS/CHOCH events, and draws key supply/demand zones to help visualize trend shifts and potential targets.

Manual Zones SafeUse cases:
Support and resistance levels
Supply and demand zones
Price action areas for manual trading strategies

RBR/DBD Zones JaRBR and DBD zones with multiple timeframe. designed to identify support and resistance area on the chart

RSI + EMA Dynamic Zones + Volume + Divergence (with RSI 50 line)RSI + EMA Dynamic Zones + Volume + Divergence (with RSI 50 line)

V3 9-20 Smart EMA Cross + RSI + FVG Zones (Instant Signal)V3 9-20 Smart EMA Cross + RSI + FVG Zones (Instant Signal)

Weekly Zones +RSI ColorWeekly analysis of stocks, cryptos etc.
chart, you will see:
The Weekly levels (PWH, PWL, 4 quadrants).
The Weekly control zones (the red, green, or grey boxes).
The Weekly analysis in the table.
Your 1-Hour candles will be colored green (strong), red (weak), or grey (neutral) based on the 1-hour RSI.
This should give you a very effective trading system.

JKL HTF S/D Zones JKL HTF S/D Zones
A small tool offered by grace—a reminder that wisdom is given, not earned. May you use it wisely and humbly, and let its fruit lift others up.
Purpose: render HTF Supply/Demand, decision boxes, and clean retest edges.
Use: mark the box edge; wait for retest + confirming candle + volume; manage RR ≥ 1.5R.
Reminder: Anchors decide • Flow aligns • RR protects.
Not financial advice. Practice discipline, walk in truth, and pass the good on.
“To God be the glory—for His steadfast love.”
Disclaimer:
Educational only — not financial advice. Use at your own risk.
No guarantees. Trade responsibly; test before live.
For study, not signals. You are responsible for outcomes.
David

Smart 9-15 EMA Cross + RSI + FVG Zones (Instant Signal)Smart 9-15 EMA Cross + RSI + FVG Zones (Instant Signal)

MTF Liquidity Levels Pro (D/W/M) [SmartFoxy]✅ SCRIPT DESCRIPTION (Premium MTF High-Low Levels)
Overview
This indicator automatically plots key High/Low levels across three major timeframes:
Daily (D) , Weekly (W) , and Monthly (M) .
It includes:
• Current period highs/lows (DH/DL, WH/WL, MH/ML);
• Previous period highs/lows (PDH/PDL, PWH/PWL, PMH/PML);
• Open levels (Day Open, Day True Open, Week Open, Month Open);
• Visual elements such as separators, period boxes, labels, and price markers;
• A fully customizable breakout alert system .
The indicator is designed for precise market structure analysis with a focus on liquidity, MTF mechanics, and clean price action.
________________________________________
How It Works
The script tracks historical High/Low levels on each timeframe and displays:
✅ Current High/Low Levels :
Daily;
Weekly;
Monthly.
✅ Previous High/Low levels from the previous day, week, and month:
PDH / PDL;
PWH / PWL;
PMH / PML.
You can select how many previous levels to display (1, 2, 3…).
✅ Open Levels:
Day Open;
Week Open;
Month Open.
Includes optional True Day Open with time offset.
✅ Visual Period Boxes highlighting each session (Day Box, Week Box, Month Box) to help identify intraday and intraperiod structure.
✅ Vertical Separators for the start of each day, week, and month.
✅ Customizable Labels & Price Markers with positions, sizes, and optional price display.
________________________________________
Alerts
A flexible alert module is built in:
✅ Breakout of Any Previous Level (D/W/M) •➤ Triggers when price breaks any previous High/Low:
PDH/PDL;
PWH/PWL;
PMH/PML.
✅ Breakout of Previous Level 1 (D/W/M) •➤ Triggers only for the closest previous levels:
PDH1/PDL1;
PWH1/PWL1;
PMH1/PML1.
✅ Custom Breakout •➤ Choose a specific level:
PDH / PDL;
PWH / PWL;
PMH / PML.
and select which level number (1, 2, 3…) the alert should track.
________________________________________
How to Use
Select which timeframes (D/W/M) to display.
Choose how many previous levels to plot.
Enable Open, Boxes, Separators, or Labels as needed.
Enable True Day Open with offset if required.
Activate Alerts and choose the breakout logic:
• All previous levels;
• Only the nearest level;
• Custom level selection.
Create an alert in TradingView using “Any alert() function call”.
________________________________________
Why This Indicator Is Useful
✅ Instantly reveals key High/Low liquidity zones across multiple timeframes
✅ Helps synchronize market structure across D/W/M levels
✅ Useful for identifying impulses, breakouts, reversals, and liquidity runs
✅ Highlights levels price frequently revisits
✅ Eliminates the need for additional MTF tools
✅ Alerts automate breakout detection for both intraday and swing traders
Suitable for all markets : Forex, Crypto, Indices, Stocks, Futures.
