7EMA_5MA (G/D + Bias + 12/26 Signal)This script alow you to survey multiple crossing signals as Golden/Death cross (MA50/200), Institutional Bias (EMA9/18), or EMA 12/26 crossing. You can show/hide all EMAs/MAs and show/hide all signals. Default config displays EMA 50/100/200 and MA 20. Full script includes display of EMA 9/18/12/26/50/100/200 and MA 20/21/50/100/200.
"南方标普中国A股大盘红利低波50指数成分股行业分布及权重"に関するスクリプトを検索

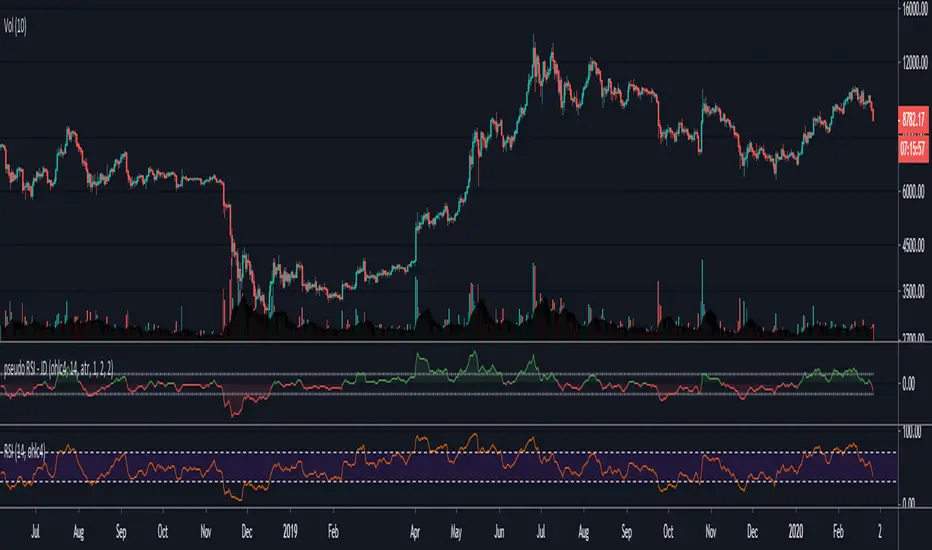
ema based pseudo RSI - JDIf you reverse engineer the "50-level" of the 14 period rsi, you end up with almost exactly the 27 period ema
So to calculate the rsi, you can 'reverse engineer' the 'reverse engineered rsi'.
This can be done by taking the distance between the current price and the "50-level ema"
you can then normalise this by dividing with the atr or the st dev to end up with a chart that's almost exactly like the rsi line
As OB/OS levele, a multiplier of the atr or st dev can be used
one application for this is to quickly refer to MTF rsi levels by multiplying th 27 ema value with the timeframe multiplier
as it turns out, I discovered that the ema's with multiples of 27 as a period align with the 50-level line of the rsi of all the corresponding timeframes.
Enjoy!
JD.
#NotTradingAdvice
#DYOR
RSI Oscillator by mattzabRSI-Oscillator is designed to be highly visual, based on strategies that recognize the RSI above 50 to be positive strength, and below 50 to be weakness.
Midpoint is 50, above is blue, below is red.
BTC 1D Alerts V1This script contains a variety of key indicator for bitcoin all-in-one and they can be activated individually in the menu. These are meant to be used on the 1D chart for Bitcoin.
1457 Day Moving Average: the bottom of the bitcoin price and arguably the rock bottom price target.
Ichimoku Cloud: a common useful indicator for bitcoin support and resistance.
350ma fibs (21 8 5 3 2 and 1.6) : Signify the tops of each logarthmic rise in bitcoin price. They are generally curving higher over the long term. For halvening #3, the predicted market crash would be after hitting the 350ma x3 fib. Also the 350 ma / 111 ma cross signifies bull market top within about 3 days as well. Using the combination of the 350ma fibs and the 350/111 crosses, reasonably identify when market top is about to occur.
50,120,200 ma: Common moving averages that bitcoin retests during bull market runs. Also, the 50/200 golden and death crosses.
1D EMA Superguppy Ribbons: green = bull market, gray is indeterminate, red = bear market. Very high specificity indicator of bull runs, especially for bitcoin. You can change to 3D candle for even more specificity for a bull market start. Use the 1W for even more specificity. 1D Superguppy is recommended for decisionmaking.
1W EMA21: a very good moving average programmed to be shown on both the daily and weekly candle time. Bitcoin commonly corrects to this repeatedly during past bull runs. Acts as support during bull run and resistance during a bear market.
Steps to identifying a bull market:
1. 50/200 golden cross
2. 1D EMA superguppy green
3. 3D EMA superguppy green (if you prefer more certainty than step 2).
4. Hitting the 1W EMA21 and bouncing off during the bull run signifies corrections.
Once a bull market is identified,
Additional recommended buying and selling techniques:
Indicators:
- Fiblines - to determine retracements from peaks (such as all time high or recent highs)
- Stochastic RSI - 1d, 3d, and 1W SRSI are great time to buy, especially the 1W SRSI which comes much less frequently.
- volumen consolidado - for multi exchange volumes compiled into a single line. I prefer buying on the lowest volume days which generally coincide with dips.
- MACD - somewhat dubious utility but many algorithms are programmed to buy or sell based on this.
Check out the Alerts for golden crosses and 350ma Fib crosses which are invaluable for long term buying planning.
I left this open source so that all the formulas can be understood and verified. Much of it hacked together from other sources but all indicators that are fundamental to bitcoin. I apologize in advance for not attributing all the articles and references... but then again I am making no money off of this anyway.

Fischy Bands (multiple periods)Just a quick way to have multiple periods. Coded at (14,50,100,200,400,600,800). Feel free to tweak it. Default is all on, obviously not as usable! Try just using 14, and 50.
This was generated with javascript for easy templating.
Source:
```
const periods = ;
const generate = (period) => {
const template = `
= bandFor(${period})
plot(b${period}, color=colorFor(${period}, b${period}), linewidth=${periods.indexOf(period)+1}, title="BB ${period} Basis", transp=show${period}TransparencyLine)
pb${period}Upper = plot(b${period}Upper, color=colorFor(${period}, b${period}), linewidth=${periods.indexOf(period)+1}, title="BB ${period} Upper", transp=show${period}TransparencyLine)
pb${period}Lower = plot(b${period}Lower, color=colorFor(${period}, b${period}), linewidth=${periods.indexOf(period)+1}, title="BB ${period} Lower", transp=show${period}TransparencyLine)
fill(pb${period}Upper, pb${period}Lower, color=colorFor(${period}, b${period}), transp=show${period}TransparencyFill)`
console.log(template);
}
console.log(`//@version=4
study(shorttitle="Fischy BB", title="Fischy Bands", overlay=true)
stdm = input(1.25, title="stdev")
bandFor(length) =>
src = hlc3
mult = stdm
basis = sma(src, length)
dev = mult * stdev(src, length)
upper = basis + dev
lower = basis - dev
`);
periods.forEach(e => console.log(`show${e} = input(title="Show ${e}?", type=input.bool, defval=true)`));
periods.forEach(e => console.log(`show${e}TransparencyLine = show${e} ? 20 : 100`));
periods.forEach(e => console.log(`show${e}TransparencyFill = show${e} ? 80 : 100`));
console.log('\n');
console.log(`colorFor(period, series) =>
c = period == 14 ? color.white :
period == 50 ? color.aqua :
period == 100 ? color.orange :
period == 200 ? color.purple :
period == 400 ? color.lime :
period == 600 ? color.yellow :
period == 800 ? color.orange :
color.black
c
`);
periods.forEach(e => generate(e))
```

Principe de NY - Rodrigo CohenIndicador criado baseado nas informações de fechamento de bollinger, seguindo o Setup Principe de NY sugerido pelo Analista Rodrigo Cohen, ainda em fase de testes para aprimorar a eficácia do setup
*Considerado apenas Fechamento fora e nesta condição + 50 pontos para entrada sendo assim
Fechamentos com Candles em Vermelho soma 50 pontos e entra vendido
Fechamentos com Candles em Verde soma 50 pontos e entra comprado
O setup pelo que percebi é composto de mais detalhes, aos quais quando tiver acesso realizarei as atualizações devidas
Também estão disponíveis versões de indicadores para Forex
Em breve posto a lista completa com os resultados no MQL5
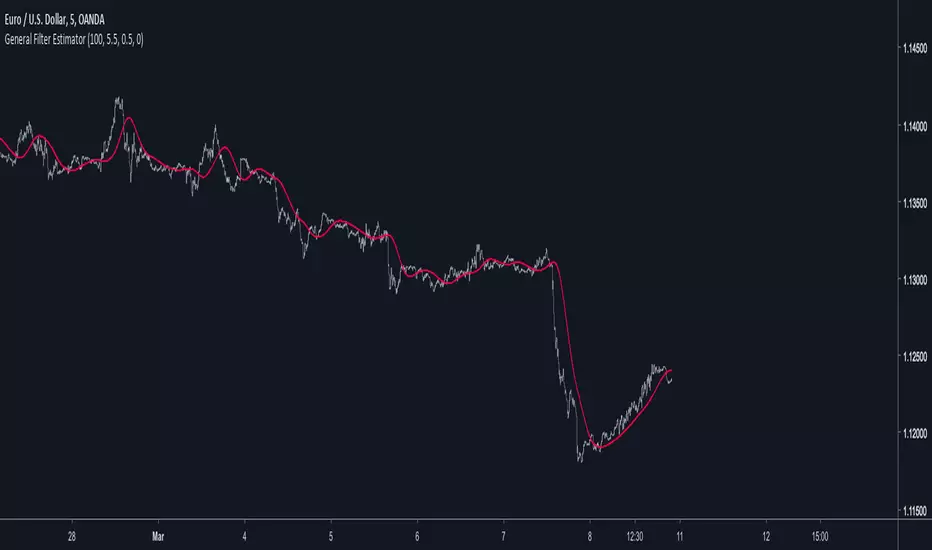
General Filter Estimator-An Experiment on Estimating EverythingIntroduction
The last indicators i posted where about estimating the least squares moving average, the task of estimating a filter is a funny one because its always a challenge and it require to be really creative. After the last publication of the 1LC-LSMA , who estimate the lsma with 1 line of code and only 3 functions i felt like i could maybe make something more flexible and less complex with the ability to approximate any filter output. Its possible, but the methods to do so are not something that pinescript can do, we have to use another base for our estimation using coefficients, so i inspired myself from the alpha-beta filter and i started writing the code.
Calculation and The Estimation Coefficients
Simplicity is the key word, its also my signature style, if i want something good it should be simple enough, so my code look like that :
p = length/beta
a = close - nz(b ,close)
b = nz(b ,close) + a/p*gamma
3 line, 2 function, its a good start, we could put everything in one line of code but its easier to see it this way. length control the smoothing amount of the filter, for any filter f(Period) Period should be equal to length and f(Period) = p , it would be inconvenient to have to use a different length period than the one used in the filter we want to estimate (imagine our estimation with length = 50 estimating an ema with period = 100) , this is where the first coefficients beta will be useful, it will allow us to leave length as it is. In general beta will be greater than 1, the greater it will be the less lag the filter will have, this coefficient will be useful to estimate low lagging filters, gamma however is the coefficient who will estimate lagging filters, in general it will range around .
We can get loose easily with those coefficients estimation but i will leave a coefficients table in the code for estimating popular filters, and some comparison below.
Estimating a Simple Moving Average
Of course, the boxcar filter, the running mean, the simple moving average, its an easy filter to use and calculate.
For an SMA use the following coefficients :
beta = 2
gamma = 0.5
Our filter is in red and the moving average in white with both length at 50 (This goes for every comparison we will do)
Its a bit imprecise but its a simple moving average, not the most interesting thing to estimate.
Estimating an Exponential Moving Average
The ema is a great filter because its length times more computing efficient than a simple moving average. For the EMA use the following coefficients :
beta = 3
gamma = 0.4
N.B : The EMA is rougher than the SMA, so it filter less, this is why its faster and closer to the price
Estimating The Hull Moving Average
Its a good filter for technical analysis with tons of use, lets try to estimate it ! For the HMA use the following coefficients :
beta = 4
gamma = 0.85
Looks ok, of course if you find better coefficients i will test them and actualize the coefficient table, i will also put a thank message.
Estimating a LSMA
Of course i was gonna estimate it, but this time this estimation does not have anything a lsma have, no moving average, no standard deviation, no correlation coefficient, lets do it.
For the LSMA use the following coefficients :
beta = 3.5
gamma = 0.9
Its far from being the best estimation, but its more efficient than any other i previously made.
Estimating the Quadratic Least Square Moving Average
I doubted about this one but it can be approximated as well. For the QLSMA use the following coefficients :
beta = 5.25
gamma = 1
Another ok estimate, the estimate filter a bit more than needed but its ok.
Jurik Moving Average
Its far from being a filter that i like and its a bit old. For the comparison i will use the JMA provided by @everget described in this article : c.mql5.com
For the JMA use the following coefficients :
for phase = 0
beta = pow*2 (pow is a parameter in the Jma)
gamma = 0.5
Here length = 50, phase = 0, pow = 5 so beta = 10
Looks pretty good considering the fact that the Jma use an adaptive architecture.
Discussion
I let you the task to judge if the estimation is good or not, my motivation was to estimate such filters using the less amount of calculations as possible, in itself i think that the code is quite elegant like all the codes of IIR filters (IIR Filters = Infinite Impulse Response : Filters using recursion) .
It could be possible to have a better estimate of the coefficients using optimization methods like the gradient descent. This is not feasible in pinescript but i could think about it using python or R.
Coefficients should be dependant of length but this would lead to a massive work, the variation of the estimation using fixed coefficients when using different length periods is just ok if we can allow some errors of precision.
I dont think it should be possible to estimate adaptive filter relying a lot on their adaptive parameter/smoothing constant except by making our coefficients adaptive (gamma could be)
So at the end ? What make a filter truly unique ? From my point of sight the architecture of a filter and the problem he is trying to solve is what make him unique rather than its output result. If you become a signal, hide yourself into noise, then look at the filters trying to find you, what a challenging game, this is why we need filters.
Conclusion
I wanted to give a simple filter estimator relying on two coefficients in order to estimate both lagging and low-lagging filters. I will try to give more precise estimate and update the indicator with new coefficients.
Thanks for reading !
BTC Volume Index [v2018-11-21] @ LekkerCryptisch.nlIndicates the volume trend:
~50 = short term volume is the same as long term volume
> 50 = short term volume is higher than long term volume (i.e. trend is rising volume)
< 50 = short term volume is lower than long term volume (i.e. trend is declining volume)

Reverse Engineered RSI - Key Levels + MTFThis indicator overlays 5 Reverse Engineered RSI (RERSI) levels on your main chart window.
The RERSI was first developed by Giorgos Siligardos in the June 2003 issue of Stocks and Commodities Magazine. HPotter provided the initial implementation - from which this script is derived - so all credit to them (see: ).
In simple terms, RERSI plots lines on the price chart that reflect levels of the RSI . E.g. if you set up a RERSI line at a level of 50, then price will touch that line when the standard RSI indicator reads 50. Hopefully that makes sense, but compare the two if it doesn't.
Why is the RERSI useful if it's just plotting RSI values? Well, it simplifies things, and enables you to get a clearer picture of trend direction, RSI support and resistance levels, RSI trading signals, and it keeps your chart window uncluttered.
I've set up 5 RERSI lines to be plotted: Overbought and Oversold Levels, a Middle Level (generally leave this at 50), and then Down/Up Trend Lines. The latter two are loosely based on the work of Constance Brown (and they in turn were influenced by Andrew Brown), who posited that RSI doesn't breach certain levels during trends (e.g. 40-50 is often a support level during an uptrend).
Play around with the levels, and the RSI Length, to see how your particular market reacts, and where key levels may lie. Remember, this isn't meant as a stand-alone system (although I think there's potential to use it as such, especially with price action trading - which I guess wouldn't make it stand-alone then!!), and works best with confirmation from other sources.
Oh, and there's MTF capability, because I think that's useful for all indicators.
Any queries, please let me know.
Cheers,
RJR

Better RSI with bullish / bearish market cycle indicator This script improves the default RSI. First. it identifies regions of the RSI which are oversold and overbought by changing the color of RSI from white to red. Second, it adds additional reference lines at 20,40,50,60, and 80 to better gauge the RSI value. Finally, the coolest feature, the middle 50 line is used to indicate which cycle the price is currently at. A green color at the 50 line indicates a bullish cycle, a red color indicators a bearish cycle, and a white color indicates a neutral cycle.
The cycles are determined using the RSI as follows:
if RSI is overbought, cycle switches to bullish until RSI falls below 40, at which point it becomes neutral
if RSI is oversold, cycle switches bearish until RSI rises above 60, at which point it becomes neutral
a neutral cycle is exited at either overbought or oversold conditions
Very useful, please give it a try and let me know what you think

ACM22 not repaintedДелал данный скрипт для FORTS.Идеально подойдет тем,кто использует трейлинг стопы.В основе стратегии лежит RSI.Как по мне,хорошая вещь для проверки стратегии и ее оптимизиации.На скрине 50 контрактов,так что не сильно радуйтесь,а просто делите на 50 и получите показатели на 1 контракт.
Script make for futures on MICEX.U can change paramets of RSI,traling stop and stop loss .On a ps 50 futures USDollar-russian ruble.Use for testing and optimisation.

Inertia Indicator The inertia indicator measures the market, stock or currency pair momentum and
trend by measuring the security smoothed RVI (Relative Volatility Index).
The RVI is a technical indicator that estimates the general direction of the
volatility of an asset.
The inertia indicator returns a value that is comprised between 0 and 100.
Positive inertia occurs when the indicator value is higher than 50. As long as
the inertia value is above 50, the long-term trend of the security is up. The inertia
is negative when its value is lower than 50, in this case the long-term trend is
down and should stay down if the inertia stays below 50

GC RSI Columns V2016This is a basic RSI indicator but in column format.I had been using this for a while and it gives a nice visual representation of trend change by changing color of the column.
Base line is 50 level. Anything above 50 is buy opportunity and below 50 is sell opportunity . Try it on higher time frames and see the results.
Example on chart above.
Note: i published it on demand. many folks were asking me for this ,since it(column rsi) was not available in public indicators

Golden Cross, SMA 200 Moving Average Strategy (by ChartArt)This famous moving average strategy is very easy to follow to decide when to buy (go long) and when to take profit.
The strategy goes long when the faster SMA 50 (the simple moving average of the last 50 bars) crosses above the slower SMA 200. Orders are closed when the SMA 50 crosses below the SMA 200. This simple strategy does not have any other stop loss or take profit money management logic. The strategy does not short and goes long only!
Here is an article explaining the "golden cross" strategy in more detail:
www.stockopedia.com
On the S&P 500 index (symbol "SPX") this strategy worked on the daily chart 81% since price data is available since 1982. And on the DOW Jones Industrial Average (symbol "DOWI") this strategy worked on the daily chart 55% since price data is available since 1916. The low number of trades is in both cases not statistically significant though.
All trading involves high risk; past performance is not necessarily indicative of future results. Hypothetical or simulated performance results have certain inherent limitations. Unlike an actual performance record, simulated results do not represent actual trading. Also, since the trades have not actually been executed, the results may have under- or over-compensated for the impact, if any, of certain market factors, such as lack of liquidity. Simulated trading programs in general are also subject to the fact that they are designed with the benefit of hindsight. No representation is being made that any account will or is likely to achieve profits or losses similar to those shown.

Forex Master v4.0 (EUR/USD Mean-Reversion Algorithm)DESCRIPTION
Forex Master v4.0 is a mean-reversion algorithm currently optimized for trading the EUR/USD pair on the 5M chart interval. All indicator inputs use the period's closing price and all trades are executed at the open of the period following the period where the trade signal was generated.
There are 3 main components that make up Forex Master v4.0:
I. Trend Filter
The algorithm uses a version of the ADX indicator as a trend filter to trade only in certain time periods where price is more likely to be range-bound (i.e., mean-reverting). This indicator is composed of a Fast ADX and a Slow ADX, both using the same look-back period of 50. However, the Fast ADX is smoothed with a 6-period EMA and the Slow ADX is smoothed with a 12-period EMA. When the Fast ADX is above the Slow ADX, the algorithm does not trade because this indicates that price is likelier to trend, which is bad for a mean-reversion system. Conversely, when the Fast ADX is below the Slow ADX, price is likelier to be ranging so this is the only time when the algorithm is allowed to trade.
II. Bollinger Bands
When allowed to trade by the Trend Filter, the algorithm uses the Bollinger Bands indicator to enter long and short positions. The Bolliger Bands indicator has a look-back period of 20 and a standard deviation of 1.5 for both upper and lower bands. When price crosses over the lower band, a Long Signal is generated and a long position is entered. When price crosses under the upper band, a Short Signal is generated and a short position is entered.
III. Money Management
Rule 1 - Each trade will use a limit order for a fixed quantity of 50,000 contracts (0.50 lot). The only exception is Rule
Rule 2 - Order pyramiding is enabled and up to 10 consecutive orders of the same signal can be executed (for example: 14 consecutive Long Signals are generated over 8 hours and the algorithm sends in 10 different buy orders at various prices for a total of 350,000 contracts).
Rule 3 - Every order will include a bracket with both TP and SL set at 50 pips (note: the algorithm only closes the current open position and does not enter the opposite trade once a TP or SL has been hit).
Rule 4 - When a new opposite trade signal is generated, the algorithm sends in a larger order to close the current open position as well as open a new one (for example: 14 consecutive Long Signals are generated over 8 hours and the algorithm sends in 10 different buy orders at various prices for a total of 350,000 contracts. A Short Signal is generated shortly after the 14th Long Signal. The algorithm then sends in a sell order for 400,000 contracts to close the 350,000 contracts long position and open a new short position of 50,000 contracts).

RSI-EMA IndicatorThis indicator calculates and plots 2 separate EMAs of the RSI. The default settings below work great on SPX/SPY daily chart. General rule is if an EMA is above 50, the stock's near term outlook is bullish. If an EMA is below 50, the near term outlook is bearish. Personally, I like to use a fast EMA as a buy signal and a slow EMA as a sell signal.
Default settings:
RSI = 50
EMA1 = 100
EMA2 = 200

High-Low Index [LazyBear]-- Fixed ---
Source: pastebin.com
Fixes an issue with "Combined" mode, using wrong symbols.
--- Original ---
The High-Low Index is a breadth indicator based on Record High Percent, which is based on new 52-week highs and new 52-week lows.
Readings below 50 indicate that there were more new lows than new highs. Readings above 50 indicate that there were more new highs than new lows. 0 indicates there were zero new highs (0% new highs). 100 indicates there was at least 1 new high and no new lows (100% new highs). 50 indicates that new highs and new lows were equal (50% new highs).
Readings consistently above 70 usually coincide with a strong uptrend. Readings consistently below 30 usually coincide with a strong downtrend.
More info:
stockcharts.com
List of my public indicators: bit.ly
List of my app-store indicators: blog.tradingview.com
Just noticed @Greeny has already published this -> Linking it here.

TimWest Long Short FiltersTimWest Long Short Filters
Indicator Has 3 Separate Filters that Create Green(Bullish) or Red(Bearish) BackGround Highlights
If Price is Above or Below a certain LookBack Period - Tim Defaults to 63 on Daily Chart to Quickly View if Price is Above or Below it’s Price 1 Quarter Ago.
A Simple Moving Average Filter - Tim Defaults to 50 SMA and 200 SMA also known as the “Golden Cross”.
A Exponential Moving Average Filter - For Those Who Want To View Shorter Term Market Swings. Defaults to 50 EMA and 100 EMA used By Chuck Hughes, 7 Time World Trading Champion. Chuck Claims the 50/100 EMA's Show the Earliest Change in Market Direction the Equal - Sustainable Moves
Inputs Tab has Checkboxes to Turn On/Off any of the 3 Filters Above.
Reference Chart Post www.tradingview.com

3 projection Indicators - PBands, PO & PBAll these indicators are by Mel Widner.
Projection Bands :
-------------------------------------------------------
These project market data along the trend with the maxima and minima of the projections defining the band. The method provides a way to signal potential direction changes relative to the trend. Usage is like any other trading band.
Projection Oscillator :
-------------------------------------------------------
This indicates the relative position of price with in the bands. It fluctuates between the values 0 to 100. You can configure the "basis" to make it oscillate around a specific value (for ex., basis=50 will make it oscillate between +50 and -50). EMA of PO (length configurable, default is 5) is plotted as a signal line. There is also an option to plot the difference (oscillator - signal), just like MACD histogram. When you see a divergence in this oscillator, remember that it just indicates a potential movement with in the band (for ex., a bullish divergence shown may cause the price to cross the median and move up to the top band).
Projection Bandwidth :
-------------------------------------------------------
This shows the % width of the projection bands. A trend reversal is signaled by a high value. Low value may indicate the start of a new trend. This is also a trend strength indicator.
More info: drive.google.com
Borrowed the color theme for this chart from @liw0. Thanks :)

Fibo RSIThis is a customized Relative Strength Index (RSI) indicator designed to replicate TradingView’s default RSI while adding additional reference levels for deeper market analysis.
🔹 Features:
RSI length set to 8 by default (user adjustable).
Calculates RSI using the standard ta.rsi() function.
Plots the RSI line in a clean, separate panel.
Adds 7 key levels for analysis: 0, 20, 30, 50, 70, 80, 100.
Levels are drawn as thin, solid straight lines for a cleaner look (instead of default dashed).
🔹 Use cases:
Identify momentum shifts with enhanced precision.
Use intermediate levels (20, 30, 50, 70, 80) as potential support/resistance zones.
Ideal for traders who want a Fibonacci-like structure in RSI analysis.

Mayfair FX Scalper V-10 Price Action + SMC//@version=5
indicator("Mayfair FX Scalper V-10 Price Action + SMC", overlay=true)
// === INPUTS ===
rsiLength = input.int(14, title="RSI Length")
overbought = input.float(73, title="SELL Level")
oversold = input.float(31, title="BUY Level")
rsiSrc = input.source(open, title="RSI Source")
// === Color Inputs ===
entryLineColor = input.color(color.white, title="entry Label Color")
entryLabelColor = input.color(color.white, title="entry Lable Color")
slLineColor = input.color(color.red, title="Stop Loss Line Color")
slLabelColor = input.color(color.red, title="Stop Loss Label Color")
tpLineColor = input.color(color.blue, title="Take Profit Line Color")
tpLabelColor = input.color(color.blue, title="Take Profit Color")
entryTextColor = input.color(color.rgb(0, 0, 0) , title="entry Text Color")
slTextColor = input.color(color.white, title="Stop Lose Color")
tpTextColor = input.color(color.white, title="Take Profit Text Color")
//indicator("Author Info Display"
// Create table
var table infoTable = table.new(position.top_right, 2, 6, bgcolor=color.new(#000000, 1), border_width=1)
if barstate.islast
table.cell(infoTable, 0, 0, "Author:", text_color=color.white, text_size=size.small)
table.cell(infoTable, 1, 0, "MR WOW", text_color=color.rgb(255, 251, 0), text_size=size.large)
table.cell(infoTable, 0, 1, "YouTube:", text_color=color.white, text_size=size.small)
table.cell(infoTable, 1, 1, "www.youtube.com/@iammrwow", text_color=color.rgb(255, 251, 0), text_size=size.small)
table.cell(infoTable, 0, 3, "Website:", text_color=color.white, text_size=size.small)
table.cell(infoTable, 1, 3, "www.mrwowea.com", text_color=color.rgb(255, 251, 0), text_size=size.small)
// === RSI CALCULATION ===
rsi = ta.rsi(rsiSrc, rsiLength)
rawBuySignal = rsi < oversold
rawSellSignal = rsi > overbought
// === Confirmed Signals ===
isBullish = close > open
isBearish = close < open
newBuy = rawBuySignal and isBullish and close > open == false
newSell = rawSellSignal and isBearish and close < open == false
// === Trade State Variables ===
var bool inPosition = false
var bool isBuy = false
var float entryPrice = na
var float slPrice = na
var float tp1Price = na
var float tp2Price = na
var float tp3Price = na
var int entryBarIndex = na
var label labels = array.new()
var line lines = array.new()
// === Instrument & Timeframe SL/TP Setup ===
isGold = str.contains(syminfo.ticker, "XAU") or str.contains(syminfo.ticker, "GOLD")
instrumentType = syminfo.type == "crypto" ? "Crypto" : isGold ? "Gold" : syminfo.currency == "JPY" ? "JPY" : "Forex"
tf = timeframe.period
slPipsGold = tf == "1" ? 30 : tf == "3" ? 45 : tf == "5" ? 50 : tf == "15" ? 60 : 70
slPipsCrypto = tf == "1" ? 5 : tf == "3" ? 8 : tf == "5" ? 12 : tf == "15" ? 15 : 10
slPipsForex = tf == "1" ? 6 : tf == "3" ? 9 : tf == "5" ? 11 : tf == "15" ? 15 : 15
gold_slDist = 0.1 * slPipsGold
gold_tp1Dist = gold_slDist
gold_tp2Dist = gold_slDist * 2
gold_tp3Dist = gold_slDist * 3
pipSize = instrumentType == "Crypto" ? 1.0 : instrumentType == "Gold" or instrumentType == "JPY" ? 0.01 : 0.0001
slPips = instrumentType == "Crypto" ? slPipsCrypto : instrumentType == "Gold" ? slPipsGold : slPipsForex
slDist = slPips * pipSize
tp1Dist = slDist
tp2Dist = slDist * 2
tp3Dist = slDist * 3
// === Draw Line & Label ===
drawLine(y, txt, col, lblCol, extendToCurrent) =>
int lineEnd = extendToCurrent ? bar_index : entryBarIndex + 2
array.push(lines, line.new(entryBarIndex, y, lineEnd, y, color=col, width=2, extend=extend.none))
textCol = str.contains(txt, "Entry") ? entryTextColor : str.contains(txt, "Stop") ? slTextColor : tpTextColor
array.push(labels, label.new(lineEnd, y, txt, style=label.style_label_left, color=color.new(lblCol, 0), textcolor=textCol, size=size.small))
// === Check Exit ===
slHit = inPosition and ((isBuy and low <= slPrice) or (not isBuy and high >= slPrice))
tp3Hit = inPosition and ((isBuy and high >= tp3Price) or (not isBuy and low <= tp3Price))
shouldExit = slHit or tp3Hit
if shouldExit
for l in labels
label.delete(l)
array.clear(labels)
for ln in lines
line.delete(ln)
array.clear(lines)
inPosition := false
entryPrice := na
slPrice := na
tp1Price := na
tp2Price := na
tp3Price := na
entryBarIndex := na
// === Confirmed Signal with No Position ===
confirmedBuy = not inPosition and newBuy
confirmedSell = not inPosition and newSell
// === Signal Markers ===
plotshape(series=confirmedBuy, location=location.belowbar, color=color.rgb(33, 150, 243), style=shape.triangleup, text="BUY", textcolor=color.rgb(33, 150, 243))
plotshape(series=confirmedSell, location=location.abovebar, color=color.rgb(254, 254, 255), style=shape.triangledown, text="SELL", textcolor=color.rgb(239, 238, 247))
// === Entry Execution ===
if confirmedBuy or confirmedSell
entryPrice := close
entryBarIndex := bar_index
isBuy := confirmedBuy
inPosition := true
if isGold
slPrice := isBuy ? entryPrice - gold_slDist : entryPrice + gold_slDist
tp1Price := isBuy ? entryPrice + gold_tp1Dist : entryPrice - gold_tp1Dist
tp2Price := isBuy ? entryPrice + gold_tp2Dist : entryPrice - gold_tp2Dist
tp3Price := isBuy ? entryPrice + gold_tp3Dist : entryPrice - gold_tp3Dist
else
slPrice := isBuy ? entryPrice - slDist : entryPrice + slDist
tp1Price := isBuy ? entryPrice + tp1Dist : entryPrice - tp1Dist
tp2Price := isBuy ? entryPrice + tp2Dist : entryPrice - tp2Dist
tp3Price := isBuy ? entryPrice + tp3Dist : entryPrice - tp3Dist
drawLine(entryPrice, "Entry Price - After Candle Above Entry Price Then Place Trade: " + str.tostring(entryPrice), entryLineColor, entryLabelColor, false)
drawLine(slPrice, "Stop Loss: " + str.tostring(slPrice), slLineColor, slLabelColor, false)
drawLine(tp1Price, "(1:1) Take Profit: " + str.tostring(tp1Price), tpLineColor, tpLabelColor, false)
drawLine(tp2Price, "(2:1) Take Profit: " + str.tostring(tp2Price), tpLineColor, tpLabelColor, false)
drawLine(tp3Price, "(3:1) Take Profit: " + str.tostring(tp3Price), tpLineColor, tpLabelColor, false)
// === Update TP/SL Lines if Still in Trade ===
if inPosition and not (confirmedBuy or confirmedSell)
for ln in lines
line.delete(ln)
array.clear(lines)
for l in labels
label.delete(l)
array.clear(labels)
drawLine(entryPrice, "After Candle Closed Above Entry Line Buy & Below Sell :Entry Price-" + str.tostring(entryPrice), entryLineColor, entryLabelColor, true)
drawLine(slPrice, "Stop Loss: " + str.tostring(slPrice), slLineColor, slLabelColor, true)
drawLine(tp1Price, "(1:1) Take Profit: " + str.tostring(tp1Price), tpLineColor, tpLabelColor, true)
drawLine(tp2Price, "(2:1) Take Profit: " + str.tostring(tp2Price), tpLineColor, tpLabelColor, true)
drawLine(tp3Price, "(3:1) Take Profit: " + str.tostring(tp3Price), tpLineColor, tpLabelColor, true)
// === Bollinger Bands Inputs ===
bb_length = input.int(20, title="SMA & StdDev Length")
src = input.source(close, title="Source")
// === Bollinger Band Colors ===
color_upper_2_3 = input.color(color.new(#0db107, 64), title="Upper Band 2–3 Color")
color_upper_3_4 = input.color(color.new(#05c41f, 58), title="Upper Band 3–4 Color")
color_lower_2_3 = input.color(color.new(#bdbc9d, 80), title="Lower Band 2–3 Color")
color_lower_3_4 = input.color(color.new(#e9e6bf, 63), title="Lower Band 3–4 Color")
// === Bollinger Band Calculations ===
sma = ta.sma(src, bb_length)
stdev = ta.stdev(src, bb_length)
bb2_upper = sma + 2 * stdev
bb2_lower = sma - 2 * stdev
bb3_upper = sma + 3 * stdev
bb3_lower = sma - 3 * stdev
bb4_upper = sma + 4 * stdev
bb4_lower = sma - 4 * stdev
// === Hidden Plots for Fill ===
p_bb2_upper = plot(bb2_upper, color=na)
p_bb3_upper = plot(bb3_upper, color=na)
p_bb4_upper = plot(bb4_upper, color=na)
p_bb2_lower = plot(bb2_lower, color=na)
p_bb3_lower = plot(bb3_lower, color=na)
p_bb4_lower = plot(bb4_lower, color=na)
// === Band Zone Fills ===
fill(p_bb2_upper, p_bb3_upper, color=color_upper_2_3)
fill(p_bb3_upper, p_bb4_upper, color=color_upper_3_4)
fill(p_bb2_lower, p_bb3_lower, color=color_lower_2_3)
fill(p_bb3_lower, p_bb4_lower, color=color_lower_3_4)
//SMc
BULLISH_LEG = 1
BEARISH_LEG = 0
BULLISH = +1
BEARISH = -1
GREEN = #9c9c9c
RED = #9c9c9c
BLUE = #9c9c9c
GRAY = #ffffff
MONO_BULLISH = #b2b5be
MONO_BEARISH = #5d606b
HISTORICAL = 'Historical'
PRESENT = 'Present'
COLORED = 'Colored'
MONOCHROME = 'Monochrome'
ALL = 'All'
BOS = 'BOS'
CHOCH = 'CHoCH'
TINY = size.tiny
SMALL = size.small
NORMAL = size.normal
ATR = 'Atr'
RANGE = 'Cumulative Mean Range'
CLOSE = 'Close'
HIGHLOW = 'High/Low'
SOLID = '⎯⎯⎯'
DASHED = '----'
DOTTED = '····'
SMART_GROUP = 'Smart Money Concepts'
INTERNAL_GROUP = 'Real Time Internal Structure'
SWING_GROUP = 'Real Time Swing Structure'
BLOCKS_GROUP = 'Order Blocks'
EQUAL_GROUP = 'EQH/EQL'
GAPS_GROUP = 'Fair Value Gaps'
LEVELS_GROUP = 'Highs & Lows MTF'
ZONES_GROUP = 'Premium & Discount Zones'
modeTooltip = 'Allows to display historical Structure or only the recent ones'
styleTooltip = 'Indicator color theme'
showTrendTooltip = 'Display additional candles with a color reflecting the current trend detected by structure'
showInternalsTooltip = 'Display internal market structure'
internalFilterConfluenceTooltip = 'Filter non significant internal structure breakouts'
showStructureTooltip = 'Display swing market Structure'
showSwingsTooltip = 'Display swing point as labels on the chart'
showHighLowSwingsTooltip = 'Highlight most recent strong and weak high/low points on the chart'
showInternalOrderBlocksTooltip = 'Display internal order blocks on the chart\n\nNumber of internal order blocks to display on the chart'
showSwingOrderBlocksTooltip = 'Display swing order blocks on the chart\n\nNumber of internal swing blocks to display on the chart'
orderBlockFilterTooltip = 'Method used to filter out volatile order blocks \n\nIt is recommended to use the cumulative mean range method when a low amount of data is available'
orderBlockMitigationTooltip = 'Select what values to use for order block mitigation'
showEqualHighsLowsTooltip = 'Display equal highs and equal lows on the chart'
equalHighsLowsLengthTooltip = 'Number of bars used to confirm equal highs and equal lows'
equalHighsLowsThresholdTooltip = 'Sensitivity threshold in a range (0, 1) used for the detection of equal highs & lows\n\nLower values will return fewer but more pertinent results'
showFairValueGapsTooltip = 'Display fair values gaps on the chart'
fairValueGapsThresholdTooltip = 'Filter out non significant fair value gaps'
fairValueGapsTimeframeTooltip = 'Fair value gaps timeframe'
fairValueGapsExtendTooltip = 'Determine how many bars to extend the Fair Value Gap boxes on chart'
showPremiumDiscountZonesTooltip = 'Display premium, discount, and equilibrium zones on chart'
modeInput = input.string( HISTORICAL, 'Mode', group = SMART_GROUP, tooltip = modeTooltip, options = )
styleInput = input.string( COLORED, 'Style', group = SMART_GROUP, tooltip = styleTooltip,options = )
showTrendInput = input( false, 'Color Candles', group = SMART_GROUP, tooltip = showTrendTooltip)
showInternalsInput = input( true, 'Show Internal Structure', group = INTERNAL_GROUP, tooltip = showInternalsTooltip)
showInternalBullInput = input.string( ALL, 'Bullish Structure', group = INTERNAL_GROUP, inline = 'ibull', options = )
internalBullColorInput = input( GREEN, '', group = INTERNAL_GROUP, inline = 'ibull')
showInternalBearInput = input.string( ALL, 'Bearish Structure' , group = INTERNAL_GROUP, inline = 'ibear', options = )
internalBearColorInput = input( RED, '', group = INTERNAL_GROUP, inline = 'ibear')
internalFilterConfluenceInput = input( false, 'Confluence Filter', group = INTERNAL_GROUP, tooltip = internalFilterConfluenceTooltip)
internalStructureSize = input.string( TINY, 'Internal Label Size', group = INTERNAL_GROUP, options = )
showStructureInput = input( true, 'Show Swing Structure', group = SWING_GROUP, tooltip = showStructureTooltip)
showSwingBullInput = input.string( ALL, 'Bullish Structure', group = SWING_GROUP, inline = 'bull', options = )
swingBullColorInput = input( GREEN, '', group = SWING_GROUP, inline = 'bull')
showSwingBearInput = input.string( ALL, 'Bearish Structure', group = SWING_GROUP, inline = 'bear', options = )
swingBearColorInput = input( RED, '', group = SWING_GROUP, inline = 'bear')
swingStructureSize = input.string( SMALL, 'Swing Label Size', group = SWING_GROUP, options = )
showSwingsInput = input( false, 'Show Swings Points', group = SWING_GROUP, tooltip = showSwingsTooltip,inline = 'swings')
swingsLengthInput = input.int( 50, '', group = SWING_GROUP, minval = 10, inline = 'swings')
showHighLowSwingsInput = input( true, 'Show Strong/Weak High/Low',group = SWING_GROUP, tooltip = showHighLowSwingsTooltip)
showInternalOrderBlocksInput = input( true, 'Internal Order Blocks' , group = BLOCKS_GROUP, tooltip = showInternalOrderBlocksTooltip, inline = 'iob')
internalOrderBlocksSizeInput = input.int( 5, '', group = BLOCKS_GROUP, minval = 1, maxval = 20, inline = 'iob')
showSwingOrderBlocksInput = input( false, 'Swing Order Blocks', group = BLOCKS_GROUP, tooltip = showSwingOrderBlocksTooltip, inline = 'ob')
swingOrderBlocksSizeInput = input.int( 5, '', group = BLOCKS_GROUP, minval = 1, maxval = 20, inline = 'ob')
orderBlockFilterInput = input.string( 'Atr', 'Order Block Filter', group = BLOCKS_GROUP, tooltip = orderBlockFilterTooltip, options = )
orderBlockMitigationInput = input.string( HIGHLOW, 'Order Block Mitigation', group = BLOCKS_GROUP, tooltip = orderBlockMitigationTooltip, options = )
internalBullishOrderBlockColor = input.color(color.new(#808080, 80), 'Internal Bullish OB', group = BLOCKS_GROUP)
internalBearishOrderBlockColor = input.color(color.new(#808080, 80), 'Internal Bearish OB', group = BLOCKS_GROUP)
swingBullishOrderBlockColor = input.color(color.new(#808080, 80), 'Bullish OB', group = BLOCKS_GROUP)
swingBearishOrderBlockColor = input.color(color.new(#808080, 80), 'Bearish OB', group = BLOCKS_GROUP)
showEqualHighsLowsInput = input( true, 'Equal High/Low', group = EQUAL_GROUP, tooltip = showEqualHighsLowsTooltip)
equalHighsLowsLengthInput = input.int( 3, 'Bars Confirmation', group = EQUAL_GROUP, tooltip = equalHighsLowsLengthTooltip, minval = 1)
equalHighsLowsThresholdInput = input.float( 0.1, 'Threshold', group = EQUAL_GROUP, tooltip = equalHighsLowsThresholdTooltip, minval = 0, maxval = 0.5, step = 0.1)
equalHighsLowsSizeInput = input.string( TINY, 'Label Size', group = EQUAL_GROUP, options = )
showFairValueGapsInput = input( false, 'Fair Value Gaps', group = GAPS_GROUP, tooltip = showFairValueGapsTooltip)
fairValueGapsThresholdInput = input( true, 'Auto Threshold', group = GAPS_GROUP, tooltip = fairValueGapsThresholdTooltip)
fairValueGapsTimeframeInput = input.timeframe('', 'Timeframe', group = GAPS_GROUP, tooltip = fairValueGapsTimeframeTooltip)
fairValueGapsBullColorInput = input.color(color.new(#00ff68, 70), 'Bullish FVG' , group = GAPS_GROUP)
fairValueGapsBearColorInput = input.color(color.new(#ff0008, 70), 'Bearish FVG' , group = GAPS_GROUP)
fairValueGapsExtendInput = input.int( 1, 'Extend FVG', group = GAPS_GROUP, tooltip = fairValueGapsExtendTooltip, minval = 0)
showDailyLevelsInput = input( false, 'Daily', group = LEVELS_GROUP, inline = 'daily')
dailyLevelsStyleInput = input.string( SOLID, '', group = LEVELS_GROUP, inline = 'daily', options = )
dailyLevelsColorInput = input( BLUE, '', group = LEVELS_GROUP, inline = 'daily')
showWeeklyLevelsInput = input( false, 'Weekly', group = LEVELS_GROUP, inline = 'weekly')
weeklyLevelsStyleInput = input.string( SOLID, '', group = LEVELS_GROUP, inline = 'weekly', options = )
weeklyLevelsColorInput = input( BLUE, '', group = LEVELS_GROUP, inline = 'weekly')
showMonthlyLevelsInput = input( false, 'Monthly', group = LEVELS_GROUP, inline = 'monthly')
monthlyLevelsStyleInput = input.string( SOLID, '', group = LEVELS_GROUP, inline = 'monthly', options = )
monthlyLevelsColorInput = input( BLUE, '', group = LEVELS_GROUP, inline = 'monthly')
showPremiumDiscountZonesInput = input( false, 'Premium/Discount Zones', group = ZONES_GROUP , tooltip = showPremiumDiscountZonesTooltip)
premiumZoneColorInput = input.color( RED, 'Premium Zone', group = ZONES_GROUP)
equilibriumZoneColorInput = input.color( GRAY, 'Equilibrium Zone', group = ZONES_GROUP)
discountZoneColorInput = input.color( GREEN, 'Discount Zone', group = ZONES_GROUP)
//---------------------------------------------------------------------------------------------------------------------}
//DATA STRUCTURES & VARIABLES
//---------------------------------------------------------------------------------------------------------------------{
// @type UDT representing alerts as bool fields
// @field internalBullishBOS internal structure custom alert
// @field internalBearishBOS internal structure custom alert
// @field internalBullishCHoCH internal structure custom alert
// @field internalBearishCHoCH internal structure custom alert
// @field swingBullishBOS swing structure custom alert
// @field swingBearishBOS swing structure custom alert
// @field swingBullishCHoCH swing structure custom alert
// @field swingBearishCHoCH swing structure custom alert
// @field internalBullishOrderBlock internal order block custom alert
// @field internalBearishOrderBlock internal order block custom alert
// @field swingBullishOrderBlock swing order block custom alert
// @field swingBearishOrderBlock swing order block custom alert
// @field equalHighs equal high low custom alert
// @field equalLows equal high low custom alert
// @field bullishFairValueGap fair value gap custom alert
// @field bearishFairValueGap fair value gap custom alert
type alerts
bool internalBullishBOS = false
bool internalBearishBOS = false
bool internalBullishCHoCH = false
bool internalBearishCHoCH = false
bool swingBullishBOS = false
bool swingBearishBOS = false
bool swingBullishCHoCH = false
bool swingBearishCHoCH = false
bool internalBullishOrderBlock = false
bool internalBearishOrderBlock = false
bool swingBullishOrderBlock = false
bool swingBearishOrderBlock = false
bool equalHighs = false
bool equalLows = false
bool bullishFairValueGap = false
bool bearishFairValueGap = false
// @type UDT representing last swing extremes (top & bottom)
// @field top last top swing price
// @field bottom last bottom swing price
// @field barTime last swing bar time
// @field barIndex last swing bar index
// @field lastTopTime last top swing time
// @field lastBottomTime last bottom swing time
type trailingExtremes
float top
float bottom
int barTime
int barIndex
int lastTopTime
int lastBottomTime
// @type UDT representing Fair Value Gaps
// @field top top price
// @field bottom bottom price
// @field bias bias (BULLISH or BEARISH)
// @field topBox top box
// @field bottomBox bottom box
type fairValueGap
float top
float bottom
int bias
box topBox
box bottomBox
// @type UDT representing trend bias
// @field bias BULLISH or BEARISH
type trend
int bias
// @type UDT representing Equal Highs Lows display
// @field l_ine displayed line
// @field l_abel displayed label
type equalDisplay
line l_ine = na
label l_abel = na
// @type UDT representing a pivot point (swing point)
// @field currentLevel current price level
// @field lastLevel last price level
// @field crossed true if price level is crossed
// @field barTime bar time
// @field barIndex bar index
type pivot
float currentLevel
float lastLevel
bool crossed
int barTime = time
int barIndex = bar_index
// @type UDT representing an order block
// @field barHigh bar high
// @field barLow bar low
// @field barTime bar time
// @field bias BULLISH or BEARISH
type orderBlock
float barHigh
float barLow
int barTime
int bias
// @variable current swing pivot high
var pivot swingHigh = pivot.new(na,na,false)
// @variable current swing pivot low
var pivot swingLow = pivot.new(na,na,false)
// @variable current internal pivot high
var pivot internalHigh = pivot.new(na,na,false)
// @variable current internal pivot low
var pivot internalLow = pivot.new(na,na,false)
// @variable current equal high pivot
var pivot equalHigh = pivot.new(na,na,false)
// @variable current equal low pivot
var pivot equalLow = pivot.new(na,na,false)
// @variable swing trend bias
var trend swingTrend = trend.new(0)
// @variable internal trend bias
var trend internalTrend = trend.new(0)
// @variable equal high display
var equalDisplay equalHighDisplay = equalDisplay.new()
// @variable equal low display
var equalDisplay equalLowDisplay = equalDisplay.new()
// @variable storage for fairValueGap UDTs
var array fairValueGaps = array.new()
// @variable storage for parsed highs
var array parsedHighs = array.new()
// @variable storage for parsed lows
var array parsedLows = array.new()
// @variable storage for raw highs
var array highs = array.new()
// @variable storage for raw lows
var array lows = array.new()
// @variable storage for bar time values
var array times = array.new()
// @variable last trailing swing high and low
var trailingExtremes trailing = trailingExtremes.new()
// @variable storage for orderBlock UDTs (swing order blocks)
var array swingOrderBlocks = array.new()
// @variable storage for orderBlock UDTs (internal order blocks)
var array internalOrderBlocks = array.new()
// @variable storage for swing order blocks boxes
var array swingOrderBlocksBoxes = array.new()
// @variable storage for internal order blocks boxes
var array internalOrderBlocksBoxes = array.new()
// @variable color for swing bullish structures
var swingBullishColor = styleInput == MONOCHROME ? MONO_BULLISH : swingBullColorInput
// @variable color for swing bearish structures
var swingBearishColor = styleInput == MONOCHROME ? MONO_BEARISH : swingBearColorInput
// @variable color for bullish fair value gaps
var fairValueGapBullishColor = styleInput == MONOCHROME ? color.new(MONO_BULLISH,70) : fairValueGapsBullColorInput
// @variable color for bearish fair value gaps
var fairValueGapBearishColor = styleInput == MONOCHROME ? color.new(MONO_BEARISH,70) : fairValueGapsBearColorInput
// @variable color for premium zone
var premiumZoneColor = styleInput == MONOCHROME ? MONO_BEARISH : premiumZoneColorInput
// @variable color for discount zone
var discountZoneColor = styleInput == MONOCHROME ? MONO_BULLISH : discountZoneColorInput
// @variable bar index on current script iteration
varip int currentBarIndex = bar_index
// @variable bar index on last script iteration
varip int lastBarIndex = bar_index
// @variable alerts in current bar
alerts currentAlerts = alerts.new()
// @variable time at start of chart
var initialTime = time
// we create the needed boxes for displaying order blocks at the first execution
if barstate.isfirst
if showSwingOrderBlocksInput
for index = 1 to swingOrderBlocksSizeInput
swingOrderBlocksBoxes.push(box.new(na,na,na,na,xloc = xloc.bar_time,extend = extend.right))
if showInternalOrderBlocksInput
for index = 1 to internalOrderBlocksSizeInput
internalOrderBlocksBoxes.push(box.new(na,na,na,na,xloc = xloc.bar_time,extend = extend.right))
// @variable source to use in bearish order blocks mitigation
bearishOrderBlockMitigationSource = orderBlockMitigationInput == CLOSE ? close : high
// @variable source to use in bullish order blocks mitigation
bullishOrderBlockMitigationSource = orderBlockMitigationInput == CLOSE ? close : low
// @variable default volatility measure
atrMeasure = ta.atr(200)
// @variable parsed volatility measure by user settings
volatilityMeasure = orderBlockFilterInput == ATR ? atrMeasure : ta.cum(ta.tr)/bar_index
// @variable true if current bar is a high volatility bar
highVolatilityBar = (high - low) >= (2 * volatilityMeasure)
// @variable parsed high
parsedHigh = highVolatilityBar ? low : high
// @variable parsed low
parsedLow = highVolatilityBar ? high : low
// we store current values into the arrays at each bar
parsedHighs.push(parsedHigh)
parsedLows.push(parsedLow)
highs.push(high)
lows.push(low)
times.push(time)
//---------------------------------------------------------------------------------------------------------------------}
//USER-DEFINED FUNCTIONS
//---------------------------------------------------------------------------------------------------------------------{
// @function Get the value of the current leg, it can be 0 (bearish) or 1 (bullish)
// @returns int
leg(int size) =>
var leg = 0
newLegHigh = high > ta.highest( size)
newLegLow = low < ta.lowest( size)
if newLegHigh
leg := BEARISH_LEG
else if newLegLow
leg := BULLISH_LEG
leg
// @function Identify whether the current value is the start of a new leg (swing)
// @param leg (int) Current leg value
// @returns bool
startOfNewLeg(int leg) => ta.change(leg) != 0
// @function Identify whether the current level is the start of a new bearish leg (swing)
// @param leg (int) Current leg value
// @returns bool
startOfBearishLeg(int leg) => ta.change(leg) == -1
// @function Identify whether the current level is the start of a new bullish leg (swing)
// @param leg (int) Current leg value
// @returns bool
startOfBullishLeg(int leg) => ta.change(leg) == +1
// @function create a new label
// @param labelTime bar time coordinate
// @param labelPrice price coordinate
// @param tag text to display
// @param labelColor text color
// @param labelStyle label style
// @returns label ID
drawLabel(int labelTime, float labelPrice, string tag, color labelColor, string labelStyle) =>
var label l_abel = na
if modeInput == PRESENT
l_abel.delete()
l_abel := label.new(chart.point.new(labelTime,na,labelPrice),tag,xloc.bar_time,color=color(na),textcolor=labelColor,style = labelStyle,size = size.small)
// @function create a new line and label representing an EQH or EQL
// @param p_ivot starting pivot
// @param level price level of current pivot
// @param size how many bars ago was the current pivot detected
// @param equalHigh true for EQH, false for EQL
// @returns label ID
drawEqualHighLow(pivot p_ivot, float level, int size, bool equalHigh) =>
equalDisplay e_qualDisplay = equalHigh ? equalHighDisplay : equalLowDisplay
string tag = 'EQL'
color equalColor = swingBullishColor
string labelStyle = label.style_label_up
if equalHigh
tag := 'EQH'
equalColor := swingBearishColor
labelStyle := label.style_label_down
if modeInput == PRESENT
line.delete( e_qualDisplay.l_ine)
label.delete( e_qualDisplay.l_abel)
e_qualDisplay.l_ine := line.new(chart.point.new(p_ivot.barTime,na,p_ivot.currentLevel), chart.point.new(time ,na,level), xloc = xloc.bar_time, color = equalColor, style = line.style_dotted)
labelPosition = math.round(0.5*(p_ivot.barIndex + bar_index - size))
e_qualDisplay.l_abel := label.new(chart.point.new(na,labelPosition,level), tag, xloc.bar_index, color = color(na), textcolor = equalColor, style = labelStyle, size = equalHighsLowsSizeInput)
// @function store current structure and trailing swing points, and also display swing points and equal highs/lows
// @param size (int) structure size
// @param equalHighLow (bool) true for displaying current highs/lows
// @param internal (bool) true for getting internal structures
// @returns label ID
getCurrentStructure(int size,bool equalHighLow = false, bool internal = false) =>
currentLeg = leg(size)
newPivot = startOfNewLeg(currentLeg)
pivotLow = startOfBullishLeg(currentLeg)
pivotHigh = startOfBearishLeg(currentLeg)
if newPivot
if pivotLow
pivot p_ivot = equalHighLow ? equalLow : internal ? internalLow : swingLow
if equalHighLow and math.abs(p_ivot.currentLevel - low ) < equalHighsLowsThresholdInput * atrMeasure
drawEqualHighLow(p_ivot, low , size, false)
p_ivot.lastLevel := p_ivot.currentLevel
p_ivot.currentLevel := low
p_ivot.crossed := false
p_ivot.barTime := time
p_ivot.barIndex := bar_index
if not equalHighLow and not internal
trailing.bottom := p_ivot.currentLevel
trailing.barTime := p_ivot.barTime
trailing.barIndex := p_ivot.barIndex
trailing.lastBottomTime := p_ivot.barTime
if showSwingsInput and not internal and not equalHighLow
drawLabel(time , p_ivot.currentLevel, p_ivot.currentLevel < p_ivot.lastLevel ? 'LL' : 'HL', swingBullishColor, label.style_label_up)
else
pivot p_ivot = equalHighLow ? equalHigh : internal ? internalHigh : swingHigh
if equalHighLow and math.abs(p_ivot.currentLevel - high ) < equalHighsLowsThresholdInput * atrMeasure
drawEqualHighLow(p_ivot,high ,size,true)
p_ivot.lastLevel := p_ivot.currentLevel
p_ivot.currentLevel := high
p_ivot.crossed := false
p_ivot.barTime := time
p_ivot.barIndex := bar_index
if not equalHighLow and not internal
trailing.top := p_ivot.currentLevel
trailing.barTime := p_ivot.barTime
trailing.barIndex := p_ivot.barIndex
trailing.lastTopTime := p_ivot.barTime
if showSwingsInput and not internal and not equalHighLow
drawLabel(time , p_ivot.currentLevel, p_ivot.currentLevel > p_ivot.lastLevel ? 'HH' : 'LH', swingBearishColor, label.style_label_down)
// @function draw line and label representing a structure
// @param p_ivot base pivot point
// @param tag test to display
// @param structureColor base color
// @param lineStyle line style
// @param labelStyle label style
// @param labelSize text size
// @returns label ID
drawStructure(pivot p_ivot, string tag, color structureColor, string lineStyle, string labelStyle, string labelSize) =>
var line l_ine = line.new(na,na,na,na,xloc = xloc.bar_time)
var label l_abel = label.new(na,na)
if modeInput == PRESENT
l_ine.delete()
l_abel.delete()
l_ine := line.new(chart.point.new(p_ivot.barTime,na,p_ivot.currentLevel), chart.point.new(time,na,p_ivot.currentLevel), xloc.bar_time, color=structureColor, style=lineStyle)
l_abel := label.new(chart.point.new(na,math.round(0.5*(p_ivot.barIndex+bar_index)),p_ivot.currentLevel), tag, xloc.bar_index, color=color(na), textcolor=structureColor, style=labelStyle, size = labelSize)
// @function delete order blocks
// @param internal true for internal order blocks
// @returns orderBlock ID
deleteOrderBlocks(bool internal = false) =>
array orderBlocks = internal ? internalOrderBlocks : swingOrderBlocks
for in orderBlocks
bool crossedOderBlock = false
if bearishOrderBlockMitigationSource > eachOrderBlock.barHigh and eachOrderBlock.bias == BEARISH
crossedOderBlock := true
if internal
currentAlerts.internalBearishOrderBlock := true
else
currentAlerts.swingBearishOrderBlock := true
else if bullishOrderBlockMitigationSource < eachOrderBlock.barLow and eachOrderBlock.bias == BULLISH
crossedOderBlock := true
if internal
currentAlerts.internalBullishOrderBlock := true
else
currentAlerts.swingBullishOrderBlock := true
if crossedOderBlock
orderBlocks.remove(index)
// @function fetch and store order blocks
// @param p_ivot base pivot point
// @param internal true for internal order blocks
// @param bias BULLISH or BEARISH
// @returns void
storeOrdeBlock(pivot p_ivot,bool internal = false,int bias) =>
if (not internal and showSwingOrderBlocksInput) or (internal and showInternalOrderBlocksInput)
array a_rray = na
int parsedIndex = na
if bias == BEARISH
a_rray := parsedHighs.slice(p_ivot.barIndex,bar_index)
parsedIndex := p_ivot.barIndex + a_rray.indexof(a_rray.max())
else
a_rray := parsedLows.slice(p_ivot.barIndex,bar_index)
parsedIndex := p_ivot.barIndex + a_rray.indexof(a_rray.min())
orderBlock o_rderBlock = orderBlock.new(parsedHighs.get(parsedIndex), parsedLows.get(parsedIndex), times.get(parsedIndex),bias)
array orderBlocks = internal ? internalOrderBlocks : swingOrderBlocks
if orderBlocks.size() >= 100
orderBlocks.pop()
orderBlocks.unshift(o_rderBlock)
// @function draw order blocks as boxes
// @param internal true for internal order blocks
// @returns void
drawOrderBlocks(bool internal = false) =>
array orderBlocks = internal ? internalOrderBlocks : swingOrderBlocks
orderBlocksSize = orderBlocks.size()
if orderBlocksSize > 0
maxOrderBlocks = internal ? internalOrderBlocksSizeInput : swingOrderBlocksSizeInput
array parsedOrdeBlocks = orderBlocks.slice(0, math.min(maxOrderBlocks,orderBlocksSize))
array b_oxes = internal ? internalOrderBlocksBoxes : swingOrderBlocksBoxes
for in parsedOrdeBlocks
orderBlockColor = styleInput == MONOCHROME ? (eachOrderBlock.bias == BEARISH ? color.new(MONO_BEARISH,80) : color.new(MONO_BULLISH,80)) : internal ? (eachOrderBlock.bias == BEARISH ? internalBearishOrderBlockColor : internalBullishOrderBlockColor) : (eachOrderBlock.bias == BEARISH ? swingBearishOrderBlockColor : swingBullishOrderBlockColor)
box b_ox = b_oxes.get(index)
b_ox.set_top_left_point( chart.point.new(eachOrderBlock.barTime,na,eachOrderBlock.barHigh))
b_ox.set_bottom_right_point(chart.point.new(last_bar_time,na,eachOrderBlock.barLow))
b_ox.set_border_color( internal ? na : orderBlockColor)
b_ox.set_bgcolor( orderBlockColor)
// @function detect and draw structures, also detect and store order blocks
// @param internal true for internal structures or order blocks
// @returns void
displayStructure(bool internal = false) =>
var bullishBar = true
var bearishBar = true
if internalFilterConfluenceInput
bullishBar := high - math.max(close, open) > math.min(close, open - low)
bearishBar := high - math.max(close, open) < math.min(close, open - low)
pivot p_ivot = internal ? internalHigh : swingHigh
trend t_rend = internal ? internalTrend : swingTrend
lineStyle = internal ? line.style_dashed : line.style_solid
labelSize = internal ? internalStructureSize : swingStructureSize
extraCondition = internal ? internalHigh.currentLevel != swingHigh.currentLevel and bullishBar : true
bullishColor = styleInput == MONOCHROME ? MONO_BULLISH : internal ? internalBullColorInput : swingBullColorInput
if ta.crossover(close,p_ivot.currentLevel) and not p_ivot.crossed and extraCondition
string tag = t_rend.bias == BEARISH ? CHOCH : BOS
if internal
currentAlerts.internalBullishCHoCH := tag == CHOCH
currentAlerts.internalBullishBOS := tag == BOS
else
currentAlerts.swingBullishCHoCH := tag == CHOCH
currentAlerts.swingBullishBOS := tag == BOS
p_ivot.crossed := true
t_rend.bias := BULLISH
displayCondition = internal ? showInternalsInput and (showInternalBullInput == ALL or (showInternalBullInput == BOS and tag != CHOCH) or (showInternalBullInput == CHOCH and tag == CHOCH)) : showStructureInput and (showSwingBullInput == ALL or (showSwingBullInput == BOS and tag != CHOCH) or (showSwingBullInput == CHOCH and tag == CHOCH))
if displayCondition
drawStructure(p_ivot,tag,bullishColor,lineStyle,label.style_label_down,labelSize)
if (internal and showInternalOrderBlocksInput) or (not internal and showSwingOrderBlocksInput)
storeOrdeBlock(p_ivot,internal,BULLISH)
p_ivot := internal ? internalLow : swingLow
extraCondition := internal ? internalLow.currentLevel != swingLow.currentLevel and bearishBar : true
bearishColor = styleInput == MONOCHROME ? MONO_BEARISH : internal ? internalBearColorInput : swingBearColorInput
if ta.crossunder(close,p_ivot.currentLevel) and not p_ivot.crossed and extraCondition
string tag = t_rend.bias == BULLISH ? CHOCH : BOS
if internal
currentAlerts.internalBearishCHoCH := tag == CHOCH
currentAlerts.internalBearishBOS := tag == BOS
else
currentAlerts.swingBearishCHoCH := tag == CHOCH
currentAlerts.swingBearishBOS := tag == BOS
p_ivot.crossed := true
t_rend.bias := BEARISH
displayCondition = internal ? showInternalsInput and (showInternalBearInput == ALL or (showInternalBearInput == BOS and tag != CHOCH) or (showInternalBearInput == CHOCH and tag == CHOCH)) : showStructureInput and (showSwingBearInput == ALL or (showSwingBearInput == BOS and tag != CHOCH) or (showSwingBearInput == CHOCH and tag == CHOCH))
if displayCondition
drawStructure(p_ivot,tag,bearishColor,lineStyle,label.style_label_up,labelSize)
if (internal and showInternalOrderBlocksInput) or (not internal and showSwingOrderBlocksInput)
storeOrdeBlock(p_ivot,internal,BEARISH)
// @function draw one fair value gap box (each fair value gap has two boxes)
// @param leftTime left time coordinate
// @param rightTime right time coordinate
// @param topPrice top price level
// @param bottomPrice bottom price level
// @param boxColor box color
// @returns box ID
fairValueGapBox(leftTime,rightTime,topPrice,bottomPrice,boxColor) => box.new(chart.point.new(leftTime,na,topPrice),chart.point.new(rightTime + fairValueGapsExtendInput * (time-time ),na,bottomPrice), xloc=xloc.bar_time, border_color = boxColor, bgcolor = boxColor)
// @function delete fair value gaps
// @returns fairValueGap ID
deleteFairValueGaps() =>
for in fairValueGaps
if (low < eachFairValueGap.bottom and eachFairValueGap.bias == BULLISH) or (high > eachFairValueGap.top and eachFairValueGap.bias == BEARISH)
eachFairValueGap.topBox.delete()
eachFairValueGap.bottomBox.delete()
fairValueGaps.remove(index)
// @function draw fair value gaps
// @returns fairValueGap ID
drawFairValueGaps() =>
= request.security(syminfo.tickerid, fairValueGapsTimeframeInput, [close , open , time , high , low , time , high , low ],lookahead = barmerge.lookahead_on)
barDeltaPercent = (lastClose - lastOpen) / (lastOpen * 100)
newTimeframe = timeframe.change(fairValueGapsTimeframeInput)
threshold = fairValueGapsThresholdInput ? ta.cum(math.abs(newTimeframe ? barDeltaPercent : 0)) / bar_index * 2 : 0
bullishFairValueGap = currentLow > last2High and lastClose > last2High and barDeltaPercent > threshold and newTimeframe
bearishFairValueGap = currentHigh < last2Low and lastClose < last2Low and -barDeltaPercent > threshold and newTimeframe
if bullishFairValueGap
currentAlerts.bullishFairValueGap := true
fairValueGaps.unshift(fairValueGap.new(currentLow,last2High,BULLISH,fairValueGapBox(lastTime,currentTime,currentLow,math.avg(currentLow,last2High),fairValueGapBullishColor),fairValueGapBox(lastTime,currentTime,math.avg(currentLow,last2High),last2High,fairValueGapBullishColor)))
if bearishFairValueGap
currentAlerts.bearishFairValueGap := true
fairValueGaps.unshift(fairValueGap.new(currentHigh,last2Low,BEARISH,fairValueGapBox(lastTime,currentTime,currentHigh,math.avg(currentHigh,last2Low),fairValueGapBearishColor),fairValueGapBox(lastTime,currentTime,math.avg(currentHigh,last2Low),last2Low,fairValueGapBearishColor)))
// @function get line style from string
// @param style line style
// @returns string
getStyle(string style) =>
switch style
SOLID => line.style_solid
DASHED => line.style_dashed
DOTTED => line.style_dotted
// @function draw MultiTimeFrame levels
// @param timeframe base timeframe
// @param sameTimeframe true if chart timeframe is same as base timeframe
// @param style line style
// @param levelColor line and text color
// @returns void
drawLevels(string timeframe, bool sameTimeframe, string style, color levelColor) =>
= request.security(syminfo.tickerid, timeframe, [high , low , time , time],lookahead = barmerge.lookahead_on)
float parsedTop = sameTimeframe ? high : topLevel
float parsedBottom = sameTimeframe ? low : bottomLevel
int parsedLeftTime = sameTimeframe ? time : leftTime
int parsedRightTime = sameTimeframe ? time : rightTime
int parsedTopTime = time
int parsedBottomTime = time
if not sameTimeframe
int leftIndex = times.binary_search_rightmost(parsedLeftTime)
int rightIndex = times.binary_search_rightmost(parsedRightTime)
array timeArray = times.slice(leftIndex,rightIndex)
array topArray = highs.slice(leftIndex,rightIndex)
array bottomArray = lows.slice(leftIndex,rightIndex)
parsedTopTime := timeArray.size() > 0 ? timeArray.get(topArray.indexof(topArray.max())) : initialTime
parsedBottomTime := timeArray.size() > 0 ? timeArray.get(bottomArray.indexof(bottomArray.min())) : initialTime
var line topLine = line.new(na, na, na, na, xloc = xloc.bar_time, color = levelColor, style = getStyle(style))
var line bottomLine = line.new(na, na, na, na, xloc = xloc.bar_time, color = levelColor, style = getStyle(style))
var label topLabel = label.new(na, na, xloc = xloc.bar_time, text = str.format('P{0}H',timeframe), color=color(na), textcolor = levelColor, size = size.small, style = label.style_label_left)
var label bottomLabel = label.new(na, na, xloc = xloc.bar_time, text = str.format('P{0}L',timeframe), color=color(na), textcolor = levelColor, size = size.small, style = label.style_label_left)
topLine.set_first_point( chart.point.new(parsedTopTime,na,parsedTop))
topLine.set_second_point( chart.point.new(last_bar_time + 20 * (time-time ),na,parsedTop))
topLabel.set_point( chart.point.new(last_bar_time + 20 * (time-time ),na,parsedTop))
bottomLine.set_first_point( chart.point.new(parsedBottomTime,na,parsedBottom))
bottomLine.set_second_point(chart.point.new(last_bar_time + 20 * (time-time ),na,parsedBottom))
bottomLabel.set_point( chart.point.new(last_bar_time + 20 * (time-time ),na,parsedBottom))
// @function true if chart timeframe is higher than provided timeframe
// @param timeframe timeframe to check
// @returns bool
higherTimeframe(string timeframe) => timeframe.in_seconds() > timeframe.in_seconds(timeframe)
// @function update trailing swing points
// @returns int
updateTrailingExtremes() =>
trailing.top := math.max(high,trailing.top)
trailing.lastTopTime := trailing.top == high ? time : trailing.lastTopTime
trailing.bottom := math.min(low,trailing.bottom)
trailing.lastBottomTime := trailing.bottom == low ? time : trailing.lastBottomTime
// @function draw trailing swing points
// @returns void
drawHighLowSwings() =>
var line topLine = line.new(na, na, na, na, color = swingBearishColor, xloc = xloc.bar_time)
var line bottomLine = line.new(na, na, na, na, color = swingBullishColor, xloc = xloc.bar_time)
var label topLabel = label.new(na, na, color=color(na), textcolor = swingBearishColor, xloc = xloc.bar_time, style = label.style_label_down, size = size.tiny)
var label bottomLabel = label.new(na, na, color=color(na), textcolor = swingBullishColor, xloc = xloc.bar_time, style = label.style_label_up, size = size.tiny)
rightTimeBar = last_bar_time + 20 * (time - time )
topLine.set_first_point( chart.point.new(trailing.lastTopTime, na, trailing.top))
topLine.set_second_point( chart.point.new(rightTimeBar, na, trailing.top))
topLabel.set_point( chart.point.new(rightTimeBar, na, trailing.top))
topLabel.set_text( swingTrend.bias == BEARISH ? 'Strong High' : 'Weak High')
bottomLine.set_first_point( chart.point.new(trailing.lastBottomTime, na, trailing.bottom))
bottomLine.set_second_point(chart.point.new(rightTimeBar, na, trailing.bottom))
bottomLabel.set_point( chart.point.new(rightTimeBar, na, trailing.bottom))
bottomLabel.set_text( swingTrend.bias == BULLISH ? 'Strong Low' : 'Weak Low')
// @function draw a zone with a label and a box
// @param labelLevel price level for label
// @param labelIndex bar index for label
// @param top top price level for box
// @param bottom bottom price level for box
// @param tag text to display
// @param zoneColor base color
// @param style label style
// @returns void
drawZone(float labelLevel, int labelIndex, float top, float bottom, string tag, color zoneColor, string style) =>
var label l_abel = label.new(na,na,text = tag, color=color(na),textcolor = zoneColor, style = style, size = size.small)
var box b_ox = box.new(na,na,na,na,bgcolor = color.new(zoneColor,80),border_color = color(na), xloc = xloc.bar_time)
b_ox.set_top_left_point( chart.point.new(trailing.barTime,na,top))
b_ox.set_bottom_right_point(chart.point.new(last_bar_time,na,bottom))
l_abel.set_point( chart.point.new(na,labelIndex,labelLevel))
// @function draw premium/discount zones
// @returns void
drawPremiumDiscountZones() =>
drawZone(trailing.top, math.round(0.5*(trailing.barIndex + last_bar_index)), trailing.top, 0.95*trailing.top + 0.05*trailing.bottom, 'Premium', premiumZoneColor, label.style_label_down)
equilibriumLevel = math.avg(trailing.top, trailing.bottom)
drawZone(equilibriumLevel, last_bar_index, 0.525*trailing.top + 0.475*trailing.bottom, 0.525*trailing.bottom + 0.475*trailing.top, 'Equilibrium', equilibriumZoneColorInput, label.style_label_left)
drawZone(trailing.bottom, math.round(0.5*(trailing.barIndex + last_bar_index)), 0.95*trailing.bottom + 0.05*trailing.top, trailing.bottom, 'Discount', discountZoneColor, label.style_label_up)
//---------------------------------------------------------------------------------------------------------------------}
//MUTABLE VARIABLES & EXECUTION
//---------------------------------------------------------------------------------------------------------------------{
parsedOpen = showTrendInput ? open : na
candleColor = internalTrend.bias == BULLISH ? swingBullishColor : swingBearishColor
plotcandle(parsedOpen,high,low,close,color = candleColor, wickcolor = candleColor, bordercolor = candleColor)
if showHighLowSwingsInput or showPremiumDiscountZonesInput
updateTrailingExtremes()
if showHighLowSwingsInput
drawHighLowSwings()
if showPremiumDiscountZonesInput
drawPremiumDiscountZones()
if showFairValueGapsInput
deleteFairValueGaps()
getCurrentStructure(swingsLengthInput,false)
getCurrentStructure(5,false,true)
if showEqualHighsLowsInput
getCurrentStructure(equalHighsLowsLengthInput,true)
if showInternalsInput or showInternalOrderBlocksInput or showTrendInput
displayStructure(true)
if showStructureInput or showSwingOrderBlocksInput or showHighLowSwingsInput
displayStructure()
if showInternalOrderBlocksInput
deleteOrderBlocks(true)
if showSwingOrderBlocksInput
deleteOrderBlocks()
if showFairValueGapsInput
drawFairValueGaps()
if barstate.islastconfirmedhistory or barstate.islast
if showInternalOrderBlocksInput
drawOrderBlocks(true)
if showSwingOrderBlocksInput
drawOrderBlocks()
lastBarIndex := currentBarIndex
currentBarIndex := bar_index
newBar = currentBarIndex != lastBarIndex
if barstate.islastconfirmedhistory or (barstate.isrealtime and newBar)
if showDailyLevelsInput and not higherTimeframe('D')
drawLevels('D',timeframe.isdaily,dailyLevelsStyleInput,dailyLevelsColorInput)
if showWeeklyLevelsInput and not higherTimeframe('W')
drawLevels('W',timeframe.isweekly,weeklyLevelsStyleInput,weeklyLevelsColorInput)
if showMonthlyLevelsInput and not higherTimeframe('M')
drawLevels('M',timeframe.ismonthly,monthlyLevelsStyleInput,monthlyLevelsColorInput)
//---------------------------------------------------------------------------------------------------------------------}
//ALERTS
//---------------------------------------------------------------------------------------------------------------------{
alertcondition(currentAlerts.internalBullishBOS, 'Internal Bullish BOS', 'Internal Bullish BOS formed')
alertcondition(currentAlerts.internalBullishCHoCH, 'Internal Bullish CHoCH', 'Internal Bullish CHoCH formed')
alertcondition(currentAlerts.internalBearishBOS, 'Internal Bearish BOS', 'Internal Bearish BOS formed')
alertcondition(currentAlerts.internalBearishCHoCH, 'Internal Bearish CHoCH', 'Internal Bearish CHoCH formed')
alertcondition(currentAlerts.swingBullishBOS, 'Bullish BOS', 'Internal Bullish BOS formed')
alertcondition(currentAlerts.swingBullishCHoCH, 'Bullish CHoCH', 'Internal Bullish CHoCH formed')
alertcondition(currentAlerts.swingBearishBOS, 'Bearish BOS', 'Bearish BOS formed')
alertcondition(currentAlerts.swingBearishCHoCH, 'Bearish CHoCH', 'Bearish CHoCH formed')
alertcondition(currentAlerts.internalBullishOrderBlock, 'Bullish Internal OB Breakout', 'Price broke bullish internal OB')
alertcondition(currentAlerts.internalBearishOrderBlock, 'Bearish Internal OB Breakout', 'Price broke bearish internal OB')
alertcondition(currentAlerts.swingBullishOrderBlock, 'Bullish Swing OB Breakout', 'Price broke bullish swing OB')
alertcondition(currentAlerts.swingBearishOrderBlock, 'Bearish Swing OB Breakout', 'Price broke bearish swing OB')
alertcondition(currentAlerts.equalHighs, 'Equal Highs', 'Equal highs detected')
alertcondition(currentAlerts.equalLows, 'Equal Lows', 'Equal lows detected')
alertcondition(currentAlerts.bullishFairValueGap, 'Bullish FVG', 'Bullish FVG formed')
alertcondition(currentAlerts.bearishFairValueGap, 'Bearish FVG', 'Bearish FVG formed')
//---------------------------------------------------------------------------------------------------------------------}

さくらんぼーい//@version=6
indicator("さくらんぼーい", overlay=true, max_labels_count=500, max_lines_count=500)
//==================== Inputs ====================//
// ---- Anchor (shared) ----
grpA = "Anchor (shared)"
anchorMode = input.string("Time", "Anchor Mode", options= , group=grpA)
anchorTime = input.time(timestamp("2025-06-24T20:31:00"), "Anchor Time (exchange)", group=grpA)
anchorBarsAgo = input.int(100, "Anchor Bars Ago", minval=1, group=grpA)
anchorPriceMode = input.string("Close", "Anchor Price", options= , group=grpA)
anchorPriceManual = input.float(0.0, "Manual Anchor Price (0=auto)", step=0.0001, group=grpA)
// ---- Light-Cone ----
grpLC = "Light-Cone ATR"
atrLen = input.int(14, "ATR Length", minval=1, group=grpLC)
atrTF = input.timeframe("", "ATR Timeframe (blank=same)", group=grpLC)
projBars = input.int(60, "Projection Horizon (bars)", minval=1, group=grpLC)
coneMode = input.string("Diffusive √n", "Cone Growth Mode", options= , group=grpLC)
mult = input.float(1.0, "ATR Multiplier (σ-ish)", step=0.1, minval=0.0, group=grpLC)
wickMode = input.string("Close", "Height uses", options= , group=grpLC)
coneFillCol= input.color(color.new(color.teal, 90), "Cone Fill", group=grpLC)
coneLineCol= input.color(color.new(color.aqua, 40), "Cone Edge", group=grpLC)
// ---- Light-Cone guide lines ----
grpFan = "Light-Cone Guides (0.5c / 1.5c)"
showFan = input.bool(true, "Show 0.5c & 1.5c guide lines", group=grpFan)
fan05Color = input.color(color.new(color.aqua, 75), "0.5c line", group=grpFan)
fan15Color = input.color(color.new(color.aqua, 60), "1.5c line", group=grpFan)
fanWidth = input.int(1, "Guide line width", minval=1, maxval=3, group=grpFan)
// ---- √n Stripes ----
grpZ = "Convergence (√n stripes)"
stepBars = input.int(20, "Base Step (bars)", minval=1, group=grpZ)
maxOrderM = input.int(8, "Max Order M (m²)", minval=1, maxval=50, group=grpZ)
halfWindow = input.int(2, "Stripe Half-Width (bars)", minval=0, group=grpZ)
stripeColor = input.color(color.new(color.fuchsia, 86), "Stripe Color", group=grpZ)
showCenters = input.bool(false, "Draw Stripe Center Lines", group=grpZ)
// ---- Fractal ----
grpF = "Fractal (Pivot) Detector"
leftP = input.int(2, "Left bars (L)", minval=1, group=grpF)
rightP = input.int(2, "Right bars (R)", minval=1, group=grpF)
hitColHi = input.color(color.new(color.lime, 0), "Pivot High Mark", group=grpF)
hitColLo = input.color(color.new(color.red, 0), "Pivot Low Mark", group=grpF)
// ---- Display / Limits ----
grpO = "Display / Limits"
showHitTable = input.bool(true, "Show m² Hit Table", group=grpO)
limitScreen = input.bool(true, "Reduce drawing near screen", group=grpO)
screenPastBars = input.int(5000, "Screen past window (bars)", minval=100, group=grpO)
futureLimitBars= input.int(500, "FUTURE draw limit (TV max 500)", minval=0, maxval=500, group=grpO)
// ---- Bias Panel ----
grpB = "Bias Panel"
showBiasPanel = input.bool(true, "Show Bias Panel", group=grpB)
biasTf = input.timeframe("15", "HTF timeframe", group=grpB)
emaFast = input.int(20, "HTF EMA fast", minval=1, group=grpB)
emaSlow = input.int(50, "HTF EMA slow", minval=2, group=grpB)
zThresh = input.float(0.30, "Z threshold (±)", step=0.05, group=grpB)
railLookback = input.int(20, "Rail lookback bars", minval=5, group=grpB)
railPct = input.float(0.40, "Rail touch ratio (0–1)", minval=0.1, maxval=0.9, step=0.05, group=grpB)
// ---- Positions (NEW) ----
panelCorner = input.string("Top-Right", "Bias Panel Position",
options= , group=grpB)
hitsCorner = input.string("Top-Left", "Hits Table Position",
options= , group=grpO)
// ---- Helpers: table positions ----
f_pos(s) =>
p = position.top_left
if s == "Top-Right"
p := position.top_right
else if s == "Bottom-Left"
p := position.bottom_left
else if s == "Bottom-Right"
p := position.bottom_right
p
//==================== Anchor Resolve ====================//
var int anchorBar = na
var float anchorPrice = na
var label anchorLbl = na
// 初バー保護付きタイム検索
f_find_anchor_bar_by_time(_t) =>
ta.valuewhen(nz(time , time ) < _t and time >= _t, bar_index, 0)
if anchorMode == "Time"
anchorBar := f_find_anchor_bar_by_time(anchorTime)
else
// バッファ下限保護
anchorBar := math.max(0, bar_index - anchorBarsAgo)
// アンカー価格(安全取得)
f_price_at_anchor(_bar) =>
float _v = na
if anchorPriceMode == "Close"
_v := ta.valuewhen(bar_index == _bar, close, 0)
else if anchorPriceMode == "High"
_v := ta.valuewhen(bar_index == _bar, high, 0)
else if anchorPriceMode == "Low"
_v := ta.valuewhen(bar_index == _bar, low, 0)
else if anchorPriceMode == "Open"
_v := ta.valuewhen(bar_index == _bar, open, 0)
_v
float autoPrice = na
if not na(anchorBar) and anchorBar <= bar_index
autoPrice := f_price_at_anchor(anchorBar)
anchorPrice := (anchorPriceMode == "Manual" and anchorPriceManual != 0.0) ? anchorPriceManual : autoPrice
bool anchorOK = not na(anchorBar) and anchorBar >= 0 and anchorBar <= bar_index + futureLimitBars and not na(anchorPrice)
// ラベル
if anchorOK
if na(anchorLbl)
anchorLbl := label.new(anchorBar, anchorPrice, "Anchor", xloc=xloc.bar_index, yloc=yloc.price, style=label.style_label_down, textcolor=color.black, color=color.yellow, size=size.tiny)
else
label.set_x(anchorLbl, anchorBar), label.set_y(anchorLbl, anchorPrice)
//==================== Light-Cone (ATR-based) ====================//
float atrSame = ta.atr(atrLen)
float atrOther = request.security(syminfo.tickerid, atrTF, ta.atr(atrLen), gaps=barmerge.gaps_off, lookahead=barmerge.lookahead_off)
float baseATR = (na(atrTF) or atrTF == "") ? atrSame : atrOther
float c_main = mult * baseATR
int horizon = math.min(projBars, futureLimitBars)
var line upL = na
var line dnL = na
var line up05 = na
var line dn05 = na
var line up15 = na
var line dn15 = na
var linefill coneFill = na
f_growth(_n) =>
coneMode == "Linear n" ? _n : math.sqrt(_n)
if anchorOK
if not na(coneFill)
linefill.delete(coneFill)
if not na(upL)
line.delete(upL)
if not na(dnL)
line.delete(dnL)
if not na(up05)
line.delete(up05)
if not na(dn05)
line.delete(dn05)
if not na(up15)
line.delete(up15)
if not na(dn15)
line.delete(dn15)
int x1 = anchorBar + horizon
float dyPer= (wickMode == "Wick (High/Low)") ? c_main * 0.5 : c_main
float grow = f_growth(horizon)
float upY = anchorPrice + dyPer * grow
float dnY = anchorPrice - dyPer * grow
float upY05 = anchorPrice + (dyPer * 0.5) * grow
float dnY05 = anchorPrice - (dyPer * 0.5) * grow
float upY15 = anchorPrice + (dyPer * 1.5) * grow
float dnY15 = anchorPrice - (dyPer * 1.5) * grow
upL := line.new(anchorBar, anchorPrice, x1, upY, xloc=xloc.bar_index, extend=extend.none, color=coneLineCol, width=2)
dnL := line.new(anchorBar, anchorPrice, x1, dnY, xloc=xloc.bar_index, extend=extend.none, color=coneLineCol, width=2)
coneFill := linefill.new(upL, dnL, color=coneFillCol)
if showFan
up05 := line.new(anchorBar, anchorPrice, x1, upY05, xloc=xloc.bar_index, extend=extend.none, color=fan05Color, width=fanWidth)
dn05 := line.new(anchorBar, anchorPrice, x1, dnY05, xloc=xloc.bar_index, extend=extend.none, color=fan05Color, width=fanWidth)
up15 := line.new(anchorBar, anchorPrice, x1, upY15, xloc=xloc.bar_index, extend=extend.none, color=fan15Color, width=fanWidth)
dn15 := line.new(anchorBar, anchorPrice, x1, dnY15, xloc=xloc.bar_index, extend=extend.none, color=fan15Color, width=fanWidth)
//==================== √n Stripes ====================//
var array centers = array.new_int()
array.clear(centers)
if not na(anchorBar)
for m = 1 to maxOrderM
array.push(centers, anchorBar + stepBars * m * m)
f_in_any_stripe(_bi) =>
sz = array.size(centers)
if sz == 0
false
else
bool hit = false
for i = 0 to sz - 1
int c0 = array.get(centers, i)
if _bi >= c0 - halfWindow and _bi <= c0 + halfWindow
hit := true
hit
// どの m² ストライプか(なければ na)
f_stripe_index(_bi) =>
int mFound = na
if array.size(centers) > 0
for m = 1 to maxOrderM
int cCenter = array.get(centers, m - 1)
if _bi >= cCenter - halfWindow and _bi <= cCenter + halfWindow
mFound := m
mFound
bgcolor(f_in_any_stripe(bar_index) ? stripeColor : na)
if showCenters and array.size(centers) > 0
for i = 0 to array.size(centers) - 1
int c0 = array.get(centers, i)
bool withinFutureLimit = c0 <= bar_index + futureLimitBars
bool nearScreen = not limitScreen or (c0 >= bar_index - screenPastBars and c0 <= bar_index + futureLimitBars)
if withinFutureLimit and nearScreen
line.new(c0, high, c0, low, xloc=xloc.bar_index, extend=extend.both, color=color.new(color.white, 70), width=1)
//==================== Fractal Detection ====================//
isPH = not na(ta.pivothigh(high, leftP, rightP))
isPL = not na(ta.pivotlow (low , leftP, rightP))
int pivotCenter = bar_index - rightP
hitPH = isPH and f_in_any_stripe(pivotCenter)
hitPL = isPL and f_in_any_stripe(pivotCenter)
//==================== m² Hit Table (robust) ====================//
var table tbHits = na
var hitsHi = array.new_int()
var hitsLo = array.new_int()
f_sync_len_int(_arr, _n, _fill) =>
while array.size(_arr) < _n
array.push(_arr, _fill)
while array.size(_arr) > _n
array.pop(_arr)
_arr
f_safe_get_int(_arr, _idx) =>
(_idx >= 0 and _idx < array.size(_arr)) ? array.get(_arr, _idx) : 0
// 毎バー長さ同期
f_sync_len_int(hitsHi, maxOrderM, 0)
f_sync_len_int(hitsLo, maxOrderM, 0)
// 集計
if (hitPH or hitPL) and array.size(centers) > 0
int nC = array.size(centers)
int nM = math.min(maxOrderM, nC)
for m = 1 to nM
int c0 = array.get(centers, m - 1)
if pivotCenter >= c0 - halfWindow and pivotCenter <= c0 + halfWindow
if hitPH
array.set(hitsHi, m - 1, f_safe_get_int(hitsHi, m - 1) + 1)
if hitPL
array.set(hitsLo, m - 1, f_safe_get_int(hitsLo, m - 1) + 1)
// 表示
if showHitTable and barstate.islast
if na(tbHits)
tbHits := table.new(f_pos(hitsCorner), 3, maxOrderM + 1, border_width=1)
table.cell(tbHits, 0, 0, "m²", bgcolor=color.new(color.blue, 20), text_color=color.white)
table.cell(tbHits, 1, 0, "PH▲", bgcolor=color.new(color.green,10), text_color=color.white)
table.cell(tbHits, 2, 0, "PL▼", bgcolor=color.new(color.red, 10), text_color=color.white)
int rows = array.size(hitsHi)
int nRow = math.min(maxOrderM, rows)
for m = 1 to nRow
table.cell(tbHits, 0, m, str.tostring(m) + "²")
table.cell(tbHits, 1, m, str.tostring(f_safe_get_int(hitsHi, m - 1)))
table.cell(tbHits, 2, m, str.tostring(f_safe_get_int(hitsLo, m - 1)))
//==================== Bias Components ====================//
// 1) HTF trend
bool htfBull = request.security(syminfo.tickerid, biasTf, ta.ema(close, emaFast) > ta.ema(close, emaSlow), gaps=barmerge.gaps_off)
bool htfBear = request.security(syminfo.tickerid, biasTf, ta.ema(close, emaFast) < ta.ema(close, emaSlow), gaps=barmerge.gaps_off)
int scHTF = htfBull ? 1 : (htfBear ? -1 : 0)
string stHTF = htfBull ? "Bull" : (htfBear ? "Bear" : "—")
// 2) Cone Z
float z = 0.0
if anchorOK
int barsFromAnchor = math.max(1, bar_index - anchorBar)
float dyPerNow = (wickMode == "Wick (High/Low)") ? (mult * baseATR * 0.5) : (mult * baseATR)
float growNow = f_growth(math.min(barsFromAnchor, horizon))
float denom = dyPerNow * growNow
z := denom != 0 ? (close - anchorPrice) / denom : 0.0
int scZ = z > zThresh ? 1 : (z < -zThresh ? -1 : 0)
string stZ = anchorOK ? ("z=" + str.tostring(z, "#.00")) : "no anchor"
// 3) Rail-hug(0.5c〜1.0c帯を High/Low の“タッチ”で判定)
// ← 初期バー安全:参照本数を bar_index にクリップ
int effLookback = math.min(railLookback, bar_index) // bar_index 本目までは 0..bar_index しか参照不可
int upTouch = 0, dnTouch = 0
if anchorOK and effLookback > 0
for i = 0 to effLookback - 1
int barsFA = math.max(1, (bar_index - i) - anchorBar)
float growI = f_growth(math.min(barsFA, horizon))
float dyPerI = (wickMode == "Wick (High/Low)") ? (mult * baseATR * 0.5) : (mult * baseATR)
float up05I = anchorPrice + dyPerI * 0.5 * growI
float up10I = anchorPrice + dyPerI * 1.0 * growI
float dn05I = anchorPrice - dyPerI * 0.5 * growI
float dn10I = anchorPrice - dyPerI * 1.0 * growI
upTouch += (high >= up05I and low <= up10I) ? 1 : 0
dnTouch += (low <= dn05I and high >= dn10I) ? 1 : 0
float upRatio = effLookback > 0 ? (upTouch * 1.0) / effLookback : 0.0
float dnRatio = effLookback > 0 ? (dnTouch * 1.0) / effLookback : 0.0
bool railUp = upRatio > railPct
bool railDn = dnRatio > railPct
int scRail = railUp ? 1 : (railDn ? -1 : 0)
string stRail = anchorOK ? (railUp ? ("Up " + str.tostring(upRatio*100, "#") + "%") : (railDn ? ("Dn " + str.tostring(dnRatio*100, "#") + "%") : "—")) : "no anchor"
// 4) Stripe entry → 最初のフラクタル(帯を出た後確定も拾う)
var bool stripeIn = false
var int stripeIdxActive = na
var int stripeEnterBar = na
var int stripeLastStart = na
var int stripeLastEnd = na
var int stripeLastIdx = na
var string firstFrac = "" // "PL" or "PH" or ""
int nowIdx = f_stripe_index(bar_index)
bool nowInStripe = not na(nowIdx)
if nowInStripe and not stripeIn
stripeIn := true
stripeIdxActive := nowIdx
stripeEnterBar := bar_index
firstFrac := ""
else if not nowInStripe and stripeIn
stripeIn := false
stripeLastStart := stripeEnterBar
stripeLastEnd := bar_index - 1
stripeLastIdx := stripeIdxActive
if (isPH or isPL)
int pc = pivotCenter
int pcIdx = f_stripe_index(pc)
bool inActive = stripeIn and not na(stripeIdxActive) and pcIdx == stripeIdxActive and pc >= nz(stripeEnterBar, pc)
bool inClosed = (not stripeIn) and not na(stripeLastIdx) and pcIdx == stripeLastIdx and pc >= nz(stripeLastStart, pc) and pc <= nz(stripeLastEnd, pc)
if firstFrac == "" and (inActive or inClosed)
firstFrac := isPL ? "PL" : (isPH ? "PH" : "")
int scFrac = firstFrac == "PL" ? 1 : (firstFrac == "PH" ? -1 : 0)
string stFrac = firstFrac == "" ? "—" : ("1st " + firstFrac + (not stripeIn and not na(stripeLastIdx) ? " @m=" + str.tostring(stripeLastIdx) : (not na(stripeIdxActive) ? " @m=" + str.tostring(stripeIdxActive) : "")))
// 5) Structure break(簡易)
var float lastPH = na
var float lastPL = na
float ph = ta.pivothigh(high, 2, 2)
float pl = ta.pivotlow (low , 2, 2)
if not na(ph)
lastPH := ph
if not na(pl)
lastPL := pl
bool bullBreak = not na(lastPH) and close > lastPH
bool bearBreak = not na(lastPL) and close < lastPL
int scStruct = bullBreak ? 1 : (bearBreak ? -1 : 0)
string stStruct = bullBreak ? "Break ↑" : (bearBreak ? "Break ↓" : "—")
// ---- Total ----
int biasScore = scHTF + scZ + scRail + scFrac + scStruct
string biasDir = biasScore >= 3 ? "UP" : (biasScore <= -3 ? "DOWN" : "NEUTRAL")
//==================== Bias Panel (table, corner selectable) ====================//
var table tbBias = na
color colG = color.new(color.green, 10)
color colR = color.new(color.red, 10)
color colN = color.new(color.gray, 70)
f_col(v) =>
v > 0 ? colG : (v < 0 ? colR : colN)
if showBiasPanel and barstate.islast
if na(tbBias)
tbBias := table.new(f_pos(panelCorner), 3, 8, border_width=1)
table.cell(tbBias, 0, 0, "Bias Panel", text_color=color.white, bgcolor=color.new(color.blue, 20), text_halign=text.align_center)
table.merge_cells(tbBias, 0, 0, 2, 0)
table.cell(tbBias, 0, 1, "Card", text_halign=text.align_center)
table.cell(tbBias, 1, 1, "State", text_halign=text.align_center)
table.cell(tbBias, 2, 1, "±1", text_halign=text.align_center)
// rows
table.cell(tbBias, 0, 2, "HTF ("+biasTf+")")
table.cell(tbBias, 1, 2, stHTF)
table.cell(tbBias, 2, 2, str.tostring(scHTF), bgcolor=f_col(scHTF), text_halign=text.align_center)
table.cell(tbBias, 0, 3, "Cone z")
table.cell(tbBias, 1, 3, stZ)
table.cell(tbBias, 2, 3, str.tostring(scZ), bgcolor=f_col(scZ), text_halign=text.align_center)
table.cell(tbBias, 0, 4, "Rail 0.5c")
table.cell(tbBias, 1, 4, stRail)
table.cell(tbBias, 2, 4, str.tostring(scRail), bgcolor=f_col(scRail), text_halign=text.align_center)
table.cell(tbBias, 0, 5, "Fractal")
table.cell(tbBias, 1, 5, stFrac)
table.cell(tbBias, 2, 5, str.tostring(scFrac), bgcolor=f_col(scFrac), text_halign=text.align_center)
table.cell(tbBias, 0, 6, "Structure")
table.cell(tbBias, 1, 6, stStruct)
table.cell(tbBias, 2, 6, str.tostring(scStruct), bgcolor=f_col(scStruct), text_halign=text.align_center)
color totCol = biasScore>=3?colG:(biasScore<=-3?colR:colN)
table.cell(tbBias, 0, 7, "TOTAL", bgcolor=color.new(color.black, 0), text_color=color.white, text_halign=text.align_center)
table.cell(tbBias, 1, 7, biasDir, bgcolor=totCol, text_color=color.white, text_halign=text.align_center)
table.cell(tbBias, 2, 7, str.tostring(biasScore), bgcolor=totCol, text_color=color.white, text_halign=text.align_center)
//==================== Alerts ====================//
alertcondition(biasScore >= 3, "Bias UP", "Bias score >= +3")
alertcondition(biasScore <= -3, "Bias DOWN", "Bias score <= -3")
alertcondition(hitPH, "Fractal High in Convergence", "Pivot High detected inside √n convergence stripe.")
alertcondition(hitPL, "Fractal Low in Convergence", "Pivot Low detected inside √n convergence stripe.")

Information Flow Analysis[b🔄 Information Flow Analysis: Systematic Multi-Component Market Analysis Framework
SYSTEM OVERVIEW AND ANALYTICAL FOUNDATION
The Information Flow Kernel - Hybrid combines established technical analysis methods into a unified analytical framework. This indicator systematically processes three distinct data streams - directional price momentum, volume-weighted pressure dynamics, and intrabar development patterns - integrating them through weighted mathematical fusion to produce statistically normalized market flow measurements.
COMPREHENSIVE MATHEMATICAL FRAMEWORK
Component 1: Directional Flow Analysis
The directional component analyzes price momentum through three mathematical vectors:
Price Vector: p = C - O (intrabar directional bias)
Momentum Vector: m = C_t - C_{t-1} (bar-to-bar velocity)
Acceleration Vector: a = m_t - m_{t-1} (momentum rate of change)
Directional Signal Integration:
S_d = \text{sgn}(p) \cdot |p| + \text{sgn}(m) \cdot |m| \cdot 0.6 + \text{sgn}(a) \cdot |a| \cdot 0.3
The signum function preserves directional information while absolute values provide magnitude weighting. Coefficients create a hierarchy emphasizing intrabar movement (100%), momentum (60%), and acceleration (30%).
Final Directional Output: K_1 = S_d \cdot w_d where w_d is the directional weight parameter.
Component 2: Volume-Weighted Pressure Analysis
Volume Normalization: r_v = \frac{V_t}{\overline{V_n}} where \overline{V_n} represents the n-period simple moving average of volume.
Base Pressure Calculation: P_{base} = \Delta C \cdot r_v \cdot w_v where \Delta C = C_t - C_{t-1} and w_v is the velocity weighting factor.
Volume Confirmation Function:
f(r_v) = \begin{cases}
1.4 & \text{if } r_v > 1.2 \
0.7 & \text{if } r_v < 0.8 \
1.0 & \text{otherwise}
\end{cases}
Final Pressure Output: K_2 = P_{base} \cdot f(r_v)
Component 3: Intrabar Development Analysis
Bar Position Calculation: B = \frac{C - L}{H - L} when H - L > 0 , else B = 0.5
Development Signal Function:
S_{dev} = \begin{cases}
2(B - 0.5) & \text{if } B > 0.6 \text{ or } B < 0.4 \
0 & \text{if } 0.4 \leq B \leq 0.6
\end{cases}
Final Development Output: K_3 = S_{dev} \cdot 0.4
Master Integration and Statistical Normalization
Weighted Component Fusion: F_{raw} = 0.5K_1 + 0.35K_2 + 0.15K_3
Sensitivity Scaling: F_{master} = F_{raw} \cdot s where s is the sensitivity parameter.
Statistical Normalization Process:
Rolling Mean: \mu_F = \frac{1}{n}\sum_{i=0}^{n-1} F_{master,t-i}
Rolling Standard Deviation: \sigma_F = \sqrt{\frac{1}{n}\sum_{i=0}^{n-1} (F_{master,t-i} - \mu_F)^2}
Z-Score Computation: z = \frac{F_{master} - \mu_F}{\sigma_F}
Boundary Enforcement: z_{bounded} = \max(-3, \min(3, z))
Final Normalization: N = \frac{z_{bounded}}{3}
Flow Metrics Calculation:
Intensity: I = |z|
Strength Percentage: S = \min(100, I \times 33.33)
Extreme Detection: \text{Extreme} = I > 2.0
DETAILED INPUT PARAMETER SPECIFICATIONS
Sensitivity (0.1 - 3.0, Default: 1.0)
Global amplification multiplier applied to the master flow calculation. Functions as: F_{master} = F_{raw} \cdot s
Low Settings (0.1 - 0.5): Enhanced precision for subtle market movements. Optimal for low-volatility environments, scalping strategies, and early detection of minor directional shifts. Increases responsiveness but may amplify noise.
Moderate Settings (0.6 - 1.2): Balanced sensitivity for standard market conditions across multiple timeframes.
High Settings (1.3 - 3.0): Reduced sensitivity to minor fluctuations while emphasizing significant flow changes. Ideal for high-volatility assets, trending markets, and longer timeframes.
Directional Weighting (0.1 - 1.0, Default: 0.7)
Controls emphasis on price direction versus volume and positioning factors. Applied as: K_{1,weighted} = K_1 \times w_d
Lower Values (0.1 - 0.4): Reduces directional bias, favoring volume-confirmed moves. Optimal for ranging markets where momentum may generate false signals.
Higher Values (0.7 - 1.0): Amplifies directional signals from price vectors and acceleration. Ideal for trending conditions where directional momentum drives price action.
Velocity Weighting (0.1 - 1.0, Default: 0.6)
Scales volume-confirmed price change impact. Applied in: P_{base} = \Delta C \times r_v \times w_v
Lower Values (0.1 - 0.4): Dampens volume spike influence, focusing on sustained pressure patterns. Suitable for illiquid assets or news-sensitive markets.
Higher Values (0.8 - 1.0): Amplifies high-volume directional moves. Optimal for liquid markets where volume provides reliable confirmation.
Volume Length (3 - 20, Default: 5)
Defines lookback period for volume averaging: \overline{V_n} = \frac{1}{n}\sum_{i=0}^{n-1} V_{t-i}
Short Periods (3 - 7): Responsive to recent volume shifts, excellent for intraday analysis.
Long Periods (13 - 20): Smoother averaging, better for swing trading and higher timeframes.
DASHBOARD SYSTEM
Primary Flow Gauge
Bilaterally symmetric visualization displaying normalized flow direction and intensity:
Segment Calculation: n_{active} = \lfloor |N| \times 15 \rfloor
Left Fill: Bearish flow when N < -0.01
Right Fill: Bullish flow when N > 0.01
Neutral Display: Empty segments when |N| \leq 0.01
Visual Style Options:
Matrix: Digital blocks (▰/▱) for quantitative precision
Wave: Progressive patterns (▁▂▃▄▅▆▇█) showing flow buildup
Dots: LED-style indicators (●/○) with intensity scaling
Blocks: Modern squares (■/□) for professional appearance
Pulse: Progressive markers (⎯ to █) emphasizing intensity buildup
Flow Intensity Visualization
30-segment horizontal bar graph with mathematical fill logic:
Segment Fill: For i \in : filled if \frac{i}{29} \leq \frac{S}{100}
Color Coding System:
Orange (S > 66%): High intensity, strong directional conviction
Cyan (33% ≤ S ≤ 66%): Moderate intensity, developing bias
White (S < 33%): Low intensity, neutral conditions
Extreme Detection Indicators
Circular markers flanking the gauge with state-dependent illumination:
Activation: I > 2.0 \land |N| > 0.3
Bright Yellow: Active extreme conditions
Dim Yellow: Normal conditions
Metrics Display
Balance Value: Raw master flow output ( F_{master} ) showing absolute directional pressure
Z-Score Value: Statistical deviation ( z_{bounded} ) indicating historical context
Dynamic Narrative System
Context-sensitive interpretation based on mathematical thresholds:
Extreme Flow: I > 2.0 \land |N| > 0.6
Moderate Flow: 0.3 < |N| \leq 0.6
High Volatility: S > 50 \land |N| \leq 0.3
Neutral State: S \leq 50 \land |N| \leq 0.3
ALERT SYSTEM SPECIFICATIONS
Mathematical Trigger Conditions:
Extreme Bullish: I > 2.0 \land N > 0.6
Extreme Bearish: I > 2.0 \land N < -0.6
High Intensity: S > 80
Bullish Shift: N_t > 0.3 \land N_{t-1} \leq 0.3
Bearish Shift: N_t < -0.3 \land N_{t-1} \geq -0.3
TECHNICAL IMPLEMENTATION AND PERFORMANCE
Computational Architecture
The system employs efficient calculation methods minimizing processing overhead:
Single-pass mathematical operations for all components
Conditional visual rendering (executed only on final bar)
Optimized array operations using direct calculations
Real-Time Processing
The indicator updates continuously during bar formation, providing immediate feedback on changing market conditions. Statistical normalization ensures consistent interpretation across varying market regimes.
Market Applicability
Optimal performance in liquid markets with consistent volume patterns. May require parameter adjustment for:
Low-volume or after-hours sessions
News-driven market conditions
Highly volatile cryptocurrency markets
Ranging versus trending market environments
PRACTICAL APPLICATION FRAMEWORK
Market State Classification
This indicator functions as a comprehensive market condition assessment tool providing:
Trend Analysis: High intensity readings ( S > 66% ) with sustained directional bias indicate strong trending conditions suitable for momentum strategies.
Reversal Detection: Extreme readings ( I > 2.0 ) at key technical levels may signal potential trend exhaustion or reversal points.
Range Identification: Low intensity with neutral flow ( S < 33%, |N| < 0.3 ) suggests ranging market conditions suitable for mean reversion strategies.
Volatility Assessment: High intensity without clear directional bias indicates elevated volatility with conflicting pressures.
Integration with Trading Systems
The normalized output range facilitates integration with automated trading systems and position sizing algorithms. The statistical basis provides consistent interpretation across different market conditions and asset classes.
LIMITATIONS AND CONSIDERATIONS
This indicator combines established technical analysis methods and processes historical data without predicting future price movements. The system performs optimally in liquid markets with consistent volume patterns and may produce false signals in thin trading conditions or during news-driven market events. This indicator is provided for educational and analytical purposes only and does not constitute financial advice. Users should combine this analysis with proper risk management, position sizing, and additional confirmation methods before making any trading decisions. Past performance does not guarantee future results.
Note: The term "kernel" in this context refers to modular calculation components rather than mathematical kernel functions in the formal computational sense.
As quantitative analyst Ralph Vince noted: "The essence of successful trading lies not in predicting market direction, but in the systematic processing of market information and the disciplined management of probability distributions."
— Dskyz, Trade with insight. Trade with anticipation.
