Fiboborsa+BistTitle: "Fiboborsa+Bist Indicator for TradingView"
Description: The "Fiboborsa+Bist" indicator is a powerful tool designed for TradingView users. This indicator offers a comprehensive set of technical indicators to assist you in your technical analysis and trading decisions.
Features:
Simple Moving Averages (SMA): You can enable or disable SMA with different periods (20, 50, 100, 200) to observe different timeframes and trends.
SMA Strategy: Use SMA crossovers to determine trends. Watch for the 20-period SMA crossing above the 50-period SMA for a bullish signal. For a bearish signal, observe the 50-period SMA crossing below the 100-period SMA.
Exponential Moving Averages (EMA): Similar to SMA, you can enable or disable EMA with different periods (5, 8, 14, 21, 34, 55, 89, 144, 233) for more precise trend analysis.
EMA Strategy: Use EMA crossovers and crossunders for short-term trend changes. A buy signal may occur when the 5-period EMA crosses above the 14-period EMA, while a crossunder suggests a selling opportunity.
Weighted Moving Averages (WMA): Customize WMA settings with various periods (5, 13, 21, 34, 89, 144, 233, 377, 610, 987) to suit your trading style.
WMA Strategy: Use WMA crossovers to verify trends. When the 13-period WMA crosses above the 34-period WMA, it may indicate an uptrend.
Buy and Sell Signals: The indicator provides buy and sell signals based on EMA crossovers and crossunders. Strong signals are also highlighted.
EMA Buy and Sell Strategy: Make informed trading decisions using buy and sell signals generated by EMA crossovers and crossunders.
Ichimoku Cloud: You can enable the Ichimoku Cloud for a clear visual representation of support and resistance levels.
Ichimoku Strategy: Use the Ichimoku Cloud to determine trend direction. Entering long positions is common when the price is above the cloud and considering short positions when it's below the cloud. Verify the trend with the Chikou Span.
Bollinger Bands: Easily visualize price volatility by enabling the Bollinger Bands feature.
Bollinger Bands Strategy: Bollinger Bands help you visualize price volatility. Look for potential reversal points when the price touches or crosses the upper or lower bands.
Use the "Fiboborsa+Bist" indicator to enhance your trading strategies and make informed decisions in the dynamic world of financial markets.
Additional Information:
Bollinger Bands: Bollinger Bands are a technical analysis tool used to monitor price volatility and determine overbought or oversold conditions. This indicator consists of three components:
Middle Moving Average (SMA): Typically, a 20-day SMA is used.
Upper Band: Calculated by adding two times the standard deviation to the SMA.
Lower Band: Calculated by subtracting two times the standard deviation from the SMA.
As the price moves between these two bands, it becomes possible to identify potential buying or selling points by comparing its height or low with these bands.
Ichimoku Cloud: The Ichimoku Cloud is a comprehensive indicator used for trend identification, defining support and resistance levels, and measuring trend strength. The Ichimoku Cloud comprises five key components:
Tenkan Sen (Conversion Line): Used to identify short-term trends.
Kijun Sen (Base Line): Used to identify medium-term trends.
Senkou Span A (Leading Span A): Calculated as (Tenkan Sen + Kijun Sen) / 2 and shows future support and resistance levels.
Senkou Span B (Leading Span B): Calculated as (highest high + lowest low) / 2 and indicates future support and resistance levels.
Chikou Span (Lagging Line): Enables tracking the price backward.
The Ichimoku Cloud interprets a price above the cloud as an uptrend and below the cloud as a downtrend. The Chikou Span assists in verifying the current trend.
ADDITIONAL STRATEGY WITH RSI AND MACD INDICATORS
**Strategy: Two-Stage Trading Strategy Using RSI, MACD, and Fiboborsa+Bist Indicators**
**Stage 1: Determining the Trend and Selecting the Trading Direction**
1. **Trend Identification with Fiboborsa+Bist Indicator:**
- Analyze the simple moving averages (SMA), exponential moving averages (EMA), and weighted moving averages (WMA) used with the Fiboborsa+Bist indicator. These indicators will provide information about the direction of the market trend.
2. **Identifying Overbought and Oversold Conditions with RSI:**
- Use the RSI indicator to identify overbought (70 and above) and oversold (30 and below) conditions. This helps in measuring the strength of the trend. If RSI enters the overbought zone, a downward correction is likely. If RSI enters the oversold zone, an upward correction is probable.
3. **Evaluating Momentum with MACD:**
- Examine price momentum using the MACD indicator. When the MACD line crosses above the signal line, it may indicate an increasing upward momentum. Conversely, a downward cross can suggest an increasing downward momentum.
**Stage 2: Generating Buy and Sell Signals**
4. **Combining RSI, MACD, and Fiboborsa+Bist Indicators:**
- To generate a buy signal, wait for RSI to move out of the oversold region into an uptrend and for the MACD line to cross above the signal line.
- To generate a sell signal, wait for RSI to move out of the overbought region into a downtrend and for the MACD line to cross below the signal line.
5. **Confirmation with Fiboborsa+Bist Indicator:**
- When you receive a buy or sell signal, use the Fiboborsa+Bist indicator to confirm the market trend. Confirming the trend can strengthen your trade signals.
6. **Setting Stop-Loss and Take-Profit Levels:**
- Remember to manage risk when opening buy or sell positions. Set stop-loss and take-profit levels to limit your risk.
7. **Monitor and Adjust Your Trades:**
- Continuously monitor your trade positions and adjust your strategy as per market conditions.
This two-stage trading strategy offers the ability to determine trends and generate trade signals using different indicators. However, every trading strategy involves risks, so risk management and practical application are essential. Also, it's recommended to test this strategy in a demo account before using it in a real trading account.
"科创50和科创100区别"に関するスクリプトを検索

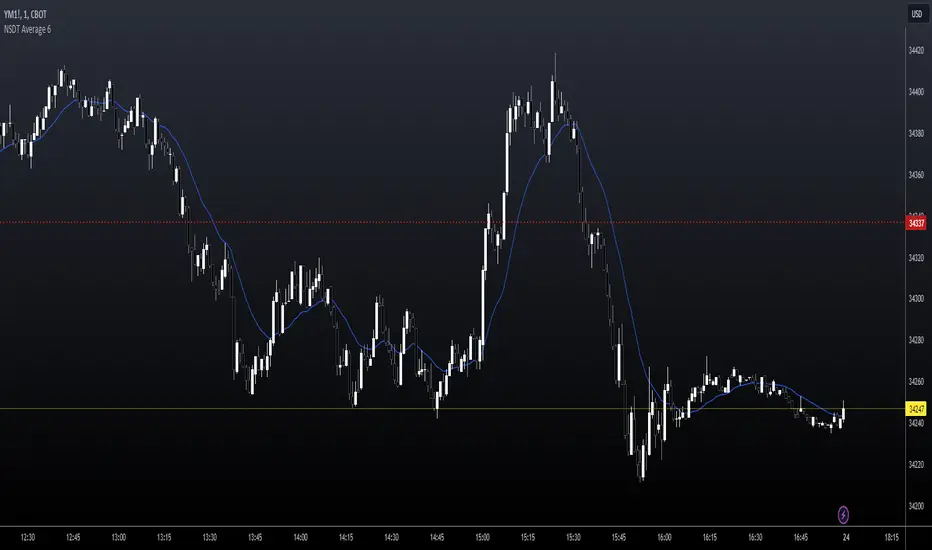
NSDT Average 6This is a pretty simple concept that we were asked to put together. It uses 6 Moving Averages, and takes the average of each one, then averages them all together.
If you don't want to use 6, and only 3 for example, then just enter the same length in two of the input fields as pairs.
Example:
For 6, you could use 10, 20, 30, 40, 50, 60
For 3, you could use 10, 10, 50, 50, 100, 100
It doesn't ploy 6 MA's, it only plots one - the result of the average of an average of an average, etc..
Publishing open source so other can modify as needed.
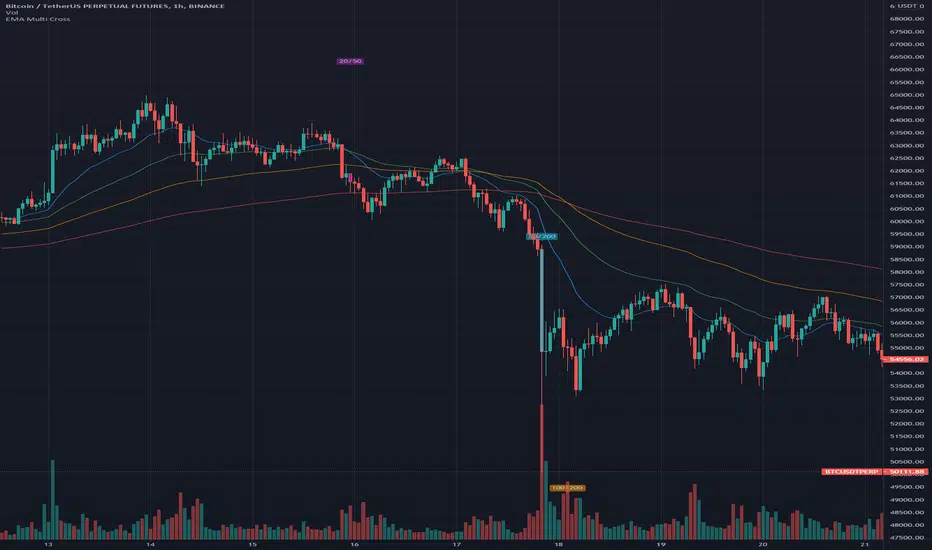
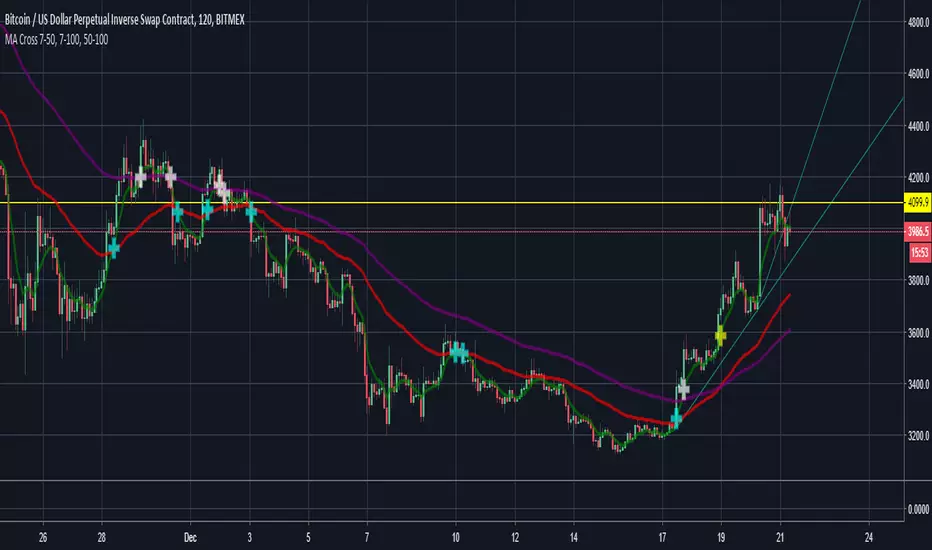
EMA Multi CrossThis is just a very simple EMA indicator that shows the 20, 50, 100, and 200 Exponential Moving Averages and plots some shapes when the lines cross from the 20 & 50, the 50 & 200, and the 100 & 200.
I know there are many EMA indicators out there, but I couldn't find one that let me edit the colors, values, and toggle the crossings. Maybe some of you will find usefulness in having some of these extra options too.
I use this occasionally on the Bitcoin 1 hour charts to see how the long-term trend is going.
Here are some ways to read EMA lines:
Slope: A rising moving average generally reflects a rising trend, while a falling moving average points to a falling trend.
Crosses: Seeing when a slower moving average crosses over/under a faster moving average can be an indication of a trend. If a shorter moving average remains above the longer moving average after they cross, the uptrend is considered intact. The trend is seen as down when the shorter moving average is below the longer moving average.
I prefer the slope of the two since crosses can cause some false positives if you are relying on it for trades.
LUBEThis is a chart meant for 30m BTCUSD but could be used for many other assets, and there are inputs to play with.
I decided on the strange title "LUBE" because I was measuring how many of the previous 500 bars had the current price level already been in. I wanted to discover when the price was in a new zone or an area that it hadn't spent much time in recently... the LUBE zone.
Think of the blue line as showing you the current level friction. If the blue line is high, price is quagmired and not moving quickly. Price could trend sideways for a while before breaking out. A high blue line is a high traffic zone for trading. When the blue line dips low, it's encountering a price zone the asset has not been observed in recently, and this could mean price could break out and move more freely and quickly when it does. We get a trade entry signal if the blue line dips below the bottom white line. The bottom white line is currently set to -10. Think about the lowest the blue line has been recently as 0, and the highest as 100. It is set by default (for BTCUSD 30m chart) to -10 meaning the blue line has to dip a little (-10%) below the lowest it has experienced recently to initiate a trade. This is the LUBE zone. The bottom white line shows that level. Again this is a level lower than the lowest amount of friction experienced in price action for the last 100 bars, but offset by 5 bars showing where that level was at 5 bars ago. We want to dip below that to initiate a trade.
The direction to trade in is determined by a very quick moving weighted moving average (variable name is "fir") to see if the recent trend is up or down. To end a trade, an arbitrary number between 0 and 100 is picked telling us when we are experiencing enough friction again to end the trade. I have it preset to 50 (think of it as 50/100 or half way between the white bars. At a 50% friction level it's time to get out of the trade.
Some shortcomings are missing the bulk of big moves, and experiencing whipsaws where price action zips up and then comes straight back down. Overall the backtest looks sweet enough to use on 2x leverage, experiencing a 17.78% max drawdown at the time of publishing. I wouldn't push the leverage any higher.
To get alerts change the word "strategy" to "study" and delete lines 60-67.
Bot traders using alerts: beware the alert conditions. If a trade goes directly from long to short (which happens rarely), without closing a trade first, it might not act properly. If you use bots to trade, for "LONG" please close any old trades first before putting in instructions to open a leveraged long. To go "SHORT" please remember to close any old trade first as well, and things *should* work out just fine.
Good luck, have fun, and feel free to mess up and butcher this code to your own liking. I'm not responsible if anything bad that happens to you if you use this trading system, or for any bugs you may encounter.

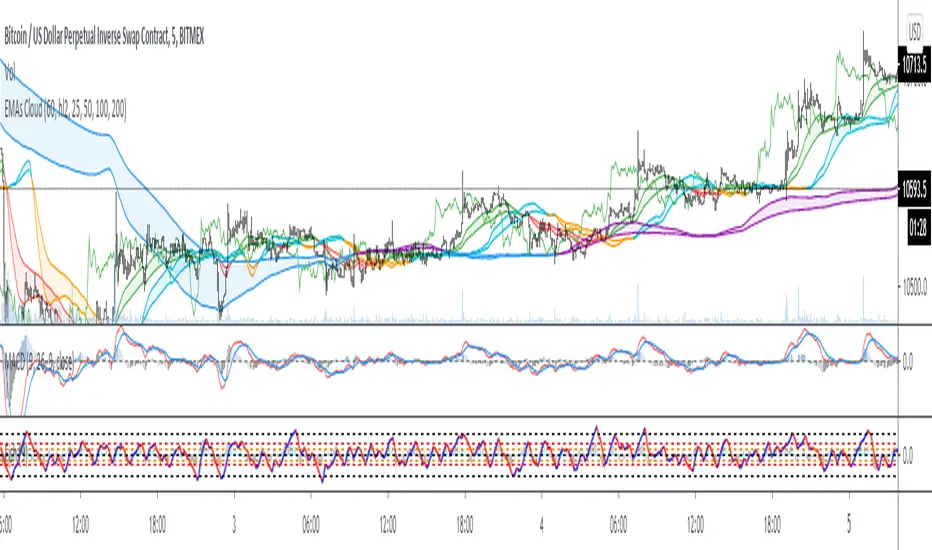
EMAs CloudEmas clouds is based on exponential moving averages 25 , 50, 100, 200
Ema 25/50 when crossed give you entry to the trend based on dipacmend forward ema 25/50 for 25 candles and ema 100/200
I add it also momentum based on close of the price moved back 25 candles.
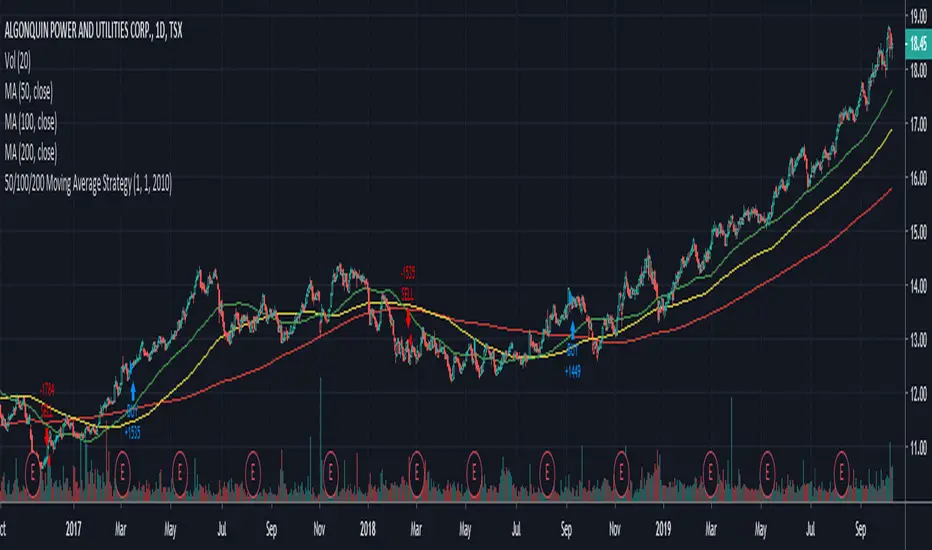
Easy to Use 50/100/200 Day Moving Average StrategyWhenever you see someone publish a chart or idea, what's the one thing you almost always see? Moving Averages!
Many investors focus on these indictors solely as entry and exit points, so here's an easy to manipulate strategy to backtest and see if this is feasible on your security.
CODE VARIABLES
LINE 2 - Here you can change your currency and amount you want to invest on each entry.
LINE 8/9/10 - Here we establish the 50 (Fast), 100 (Medium) and 200 (Slow) day variables. These can be adjusted to your choosing.
LINE 13/14/15 - Here we establish what date we want to start backtesting from. Simple change the defval on each line to change the date (In the code below we start on Jan 1st, 2010).
LINE 20/23 - Here, within the crossover and crossunder functions, we set which MA's must cross to enter and exit a trade. Below we have the 50 day moving above and under the 200 day. Simple change the variables to FastMA, MediumMA and SlowMA to your choosing.
NOTE: As a beginner you may not want to short stock, therefore LINE 5 was added to only allow long positions.
Hope this helps, from one beginner to another.
Cheers!
TimWest Long Short FiltersTimWest Long Short Filters
Indicator Has 3 Separate Filters that Create Green(Bullish) or Red(Bearish) BackGround Highlights
If Price is Above or Below a certain LookBack Period - Tim Defaults to 63 on Daily Chart to Quickly View if Price is Above or Below it’s Price 1 Quarter Ago.
A Simple Moving Average Filter - Tim Defaults to 50 SMA and 200 SMA also known as the “Golden Cross”.
A Exponential Moving Average Filter - For Those Who Want To View Shorter Term Market Swings. Defaults to 50 EMA and 100 EMA used By Chuck Hughes, 7 Time World Trading Champion. Chuck Claims the 50/100 EMA's Show the Earliest Change in Market Direction the Equal - Sustainable Moves
Inputs Tab has Checkboxes to Turn On/Off any of the 3 Filters Above.
Reference Chart Post www.tradingview.com

Drawdown + Labels BINANCE:BTCUSDT
Indicador de reducciones de precio con etiqueta.
El indicador toma por defecto el valor máximo histórico y a partir de ese valor realiza los siguientes cálculos:
Reducción del 50% = Máximo Histórico*(50/100)
Reducción del 60% = Máximo Histórico*(40/100)
Reducción del 70% = Máximo Histórico*(30/100)
Reducción del 80% = Máximo Histórico*(20/100)
Reducción del 90% = Máximo Histórico*(10/100)
En el grafico se mostrará una etiqueta a la derecha por defecto, el valor que corresponde a cada reducción.
Ejemplo:
Fecha: 04 de Enero de 2022
Máximo Histórico de BTC = $ 69,000 (Línea color Naranja)
Reducción del 50% = $ 34,500 (Línea color Morada)
Reducción del 60% = $ 27,600 (Línea color Marrón)
Reducción del 70% = $ 20,700 (Línea color Verde)
Reducción del 80% = $ 13,800 (Línea color Roja)
Reducción del 90% = $ 6,900 (Línea color Aqua)
Reducción del 100% = $ 0 (Línea color Negro)
Espero les ayude, saludos.

Stochastic SuperTrend [BigBeluga]🔵 OVERVIEW
A hybrid momentum-trend tool that combines Stochastic RSI with SuperTrend logic to deliver clean directional signals based on momentum turns.
Stochastic SuperTrend is a straightforward yet powerful oscillator overlay designed to highlight turning points in momentum with high clarity. It overlays a SuperTrend-style envelope onto the Stochastic RSI, generating intuitive up/down signals when a momentum shift occurs across the neutral 50 level. Built for traders who appreciate simplicity without sacrificing reliability.
🔵 CONCEPTS
Stochastic RSI: Measures momentum by applying stochastic calculations to the RSI curve instead of raw price.
SuperTrend Bands: Dynamic upper/lower bands are drawn around the smoothed Stoch RSI line using a user-defined multiplier.
Momentum Direction: Trend flips when the smoothed Stoch RSI crosses above/below the calculated bands.
Neutral Bias Filter: Directional arrows only appear when momentum turns above or below the central 50 level—adding confluence.
🔵 FEATURES
Trend Detection on Oscillator: Applies SuperTrend logic directly to the Stoch RSI curve.
Clean Entry Signals:
→ 🢁 arrow printed when trend flips bullish below 50 (bottom reversals).
→ 🢃 arrow printed when trend flips bearish above 50 (top reversals).
Custom Multiplier: Adjust sensitivity of SuperTrend band spacing around the oscillator.
Neutral Zone Highlight: Visual zone between 0–50 (green) and 50–100 (red) for quick momentum polarity reference.
Toggle SuperTrend Line: Option to show/hide the SuperTrend trail on the Stoch RSI.
🔵 HOW TO USE
Use 🢁 signals for potential bottom reversals when momentum flips bullish from oversold regions.
Use 🢃 signals for potential top reversals when momentum flips bearish from overbought areas.
Combine with price-based SuperTrend or support/resistance zones for confluence.
Suitable for scalping, swing trading, or momentum filtering across all timeframes.
🔵 CONCLUSION
Stochastic SuperTrend is a simple yet refined tool that captures clean momentum shifts with directional clarity. Whether you're identifying reversals, filtering entries, or spotting exhaustion in a trend, this oscillator overlay delivers just what you need— no clutter, just clean momentum structure.

Multiple MAs Signals with RSI MA Filter & Signal About the Script
The "Multiple Moving Averages Signals with RSI MA Filter and Golden Signals" script is a comprehensive trading tool designed to provide traders with detailed insights and actionable signals based on multiple moving averages and RSI (Relative Strength Index). This script combines traditional moving average crossovers with RSI filtering to enhance the accuracy of trading signals and includes "golden" signals to highlight significant long-term trend changes.
This script integrates several technical indicators and concepts to create a robust and versatile trading tool. Here's why this combination is both original and useful:
1. Multiple Moving Averages:
- Why Use Multiple MAs: Different types of moving averages (SMA, EMA, SMMA, WMA, VWMA, Hull) offer unique perspectives on price trends and volatility. Combining them allows traders to capture a more comprehensive view of the market.
- Purpose: Using multiple moving averages helps identify trend direction, support/resistance levels, and potential reversal points.
2. RSI MA Filter:
- Why Use RSI: RSI is a momentum oscillator that measures the speed and change of price movements. It is used to identify overbought or oversold conditions in a market.
- Purpose: Filtering signals with RSI moving averages ensures that trades are taken in line with the prevailing momentum, reducing the likelihood of false signals.
3. Golden Signals:
- Why Use Golden Crosses: A golden cross (50-period MA crossing above the 200-period MA) is a well-known bullish signal, while a death cross (50-period MA crossing below the 200-period MA) is bearish. These signals are widely followed by traders and institutions.
- Purpose: Highlighting these significant long-term signals helps traders identify major buy or sell opportunities and align with broader market trends.
How the Script Works
1. Moving Average Calculations:
- The script calculates multiple moving averages (MA1 to MA5) based on user-selected types (SMA, EMA, SMMA, WMA, VWMA, Hull) and periods (9, 21, 50, 100, 200).
- Golden Moving Averages: Separately calculates 50-period and 200-period moving averages for generating golden signals.
2. RSI and RSI MA Filter:
- RSI Calculation: Computes the RSI for the given period.
- RSI MA: Calculates a moving average of the RSI to smooth out the RSI values and reduce noise.
- RSI MA Filter: Traders can enable/disable RSI filtering and set custom thresholds to refine long and short signals based on RSI momentum.
3. Long & Short Signal Generation:
- Long Signal: Generated when the short-term moving average crosses above both the mid-term and long-term moving averages, and the RSI MA is below the specified threshold (if enabled).
- Short Signal: Generated when the short-term moving average crosses below both the mid-term and long-term moving averages, and the RSI MA is above the specified threshold (if enabled).
4. Golden Signals:
- Golden Long Signal: Triggered when the 50-period golden moving average crosses above the 200-period golden moving average.
- Golden Short Signal: Triggered when the 50-period golden moving average crosses below the 200-period golden moving average.
How to Use the Script
1. Customize Inputs:
- Moving Averages: Choose the type of moving averages and set the periods for up to five different moving averages.
- RSI Settings: Adjust the RSI period and its moving average period. Enable or disable RSI filtering and set custom thresholds for long and short signals.
- Signal Colors: Customize the colors for long, short, and golden signals.
- Enable/Disable Signals: Toggle the visibility of long, short, and golden signals.
2. Observe Plots and Signals:
- The script plots the selected moving averages on the chart.
- Long and short signals are marked with labels on the chart, with customizable colors for easy identification.
- Golden signals are highlighted with specific labels to indicate significant long-term trend changes.
3. Analyze and Trade:
- Use the generated signals as part of your trading strategy. The script provides visual cues to help you make informed decisions about entering or exiting trades based on multiple technical indicators.
Unique Features
1. Integration of Multiple Moving Averages: Combines various moving average types to provide a holistic view of market trends.
2. RSI MA Filtering: Enhances signal accuracy by incorporating RSI momentum, reducing the likelihood of false signals.
3. Golden Signals: Highlights significant long-term trend changes, aligning with broader market movements.
4. Customizability: Offers extensive customization options, allowing traders to tailor the script to their specific trading strategies and preferences.
feel free to comments.

Stock Scoring SystemThe EMA Scoring System is designed to help traders quickly assess market trend strength and decide portfolio allocation. It compares price vs. key EMAs (21, 50, 100) and also checks the relative strength between EMAs. Based on these conditions, it assigns a score (-6 to +6) and a corresponding allocation percentage.
+6 Score = 100% allocation (strong bullish trend)
-6 Score = 10% allocation (strong bearish trend)
Scores in between represent intermediate trend strength.
📌 Key Features
✅ Scoring Model: Evaluates price vs. EMA alignment and EMA cross relationships.
✅ Allocation % Display: Converts score into suggested portfolio allocation.
✅ Background Highlighting: Green shades for bullish conditions, red shades for bearish.
✅ Customizable Table Position: Choose between Top Right, Top Center, Bottom Right, or Bottom Center.
✅ Toggleable EMAs: Show/Hide 21 EMA, 50 EMA, and 100 EMA directly from indicator settings.
✅ Simple & Intuitive: One glance at the chart tells you trend strength and suggested allocation.
📈 How It Works
Score Calculation:
Price above an EMA = +1, below = -1
Faster EMA above slower EMA = +1, else -1
Maximum score = +6, minimum = -6
Allocation Mapping:
+6 → 100% allocation
+4 to +5 → 100% allocation
+2 to +3 → 75% allocation
0 to +1 → 50% allocation
-1 to -2 → 30% allocation
-3 to -4 → 20% allocation
-5 to -6 → 10% allocation
Visual Output:
Table shows SCORE + Allocation %
Background color shifts with score (green for bullish, red for bearish)
⚠️ Disclaimer
This indicator is for educational purposes only. It does not constitute financial advice. Always backtest and combine with your own analysis before making trading decisions.

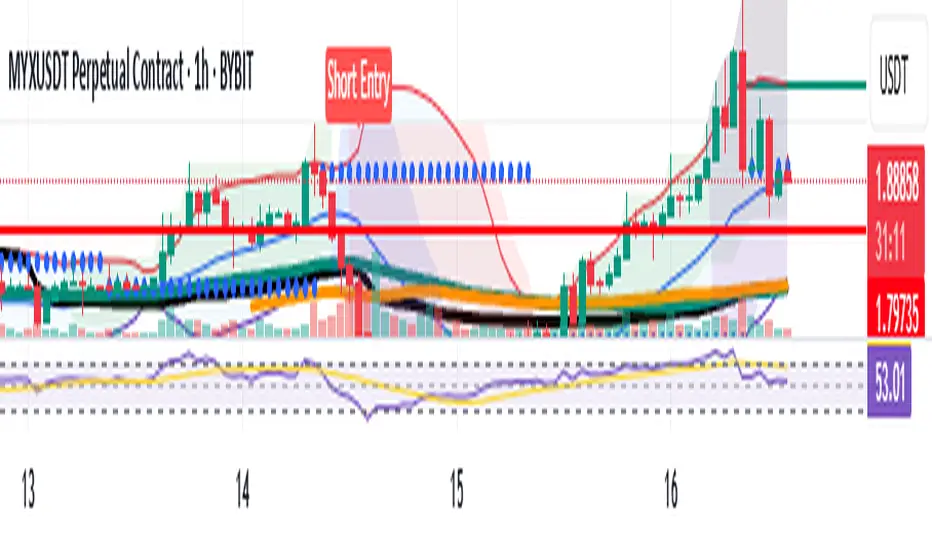
Perp Imbalance Zones • Pro (clean)USD Premium (perp vs spot) → (Perp − Spot) / Spot.
Imbalance (z-score of that premium) → how extreme the current premium is relative to its own history over lenPrem bars.
Hysteresis state machine → flips to a SHORT bias when perp-long pressure is extreme; flips to LONG bias when perp-short pressure is extreme. It exits only after the imbalance cools (prevents whipsaw).
Price stretch filter (±σ) → optional Bollinger check so signals only fire when price is already stretched.
HTF confirmation (optional) → require higher-timeframe imbalance to agree with the current-TF bias.
Gradient visuals → line + background tint deepen as |z| grows (more extreme pressure).
What you see on the pane
A single line (z):
Above 0 = perp richer than spot (perp longs pressing).
Below 0 = perp cheaper than spot (perp shorts pressing).
Guides: dotted levels at ±enterZ (entry) and ±exitZ (cool-off/exit).
Background tint:
Red when state = SHORT bias (perp longs heavy).
Blue when state = LONG bias (perp shorts heavy).
Tint intensity scales with |z| (via hotZ).
Labels (optional): prints when bias flips.
Alerts (optional): “Enter SHORT/LONG bias” and “Exit bias”.
How to use it (playbook)
Attach & set symbols
Put the script on your chart.
Set Spot symbol and Perp symbol to the venue you trade (e.g., BINANCE:BTCUSDT + BINANCE:BTCUSDTPERP).
Read the bias
SHORT bias (red background): perp longs over-extended. Look for short entries if price is at resistance, σ-stretched, or your PA system agrees.
LONG bias (blue background): perp shorts over-extended. Look for long entries at support/σ-stretched down.
Entries
Use the bias flip as a context/confirm. Combine with your structure trigger (OB/level sweep, rejection wick, micro-break in market structure, etc.).
If useSigma=true, only trade when price is already ≥ upper band (shorts) or ≤ lower band (longs).
Exits
Bias auto-exits when |z| falls below exitZ.
You can also take profits at your levels or when the line fades back toward 0 while price mean-reverts to the middle band.
Tuning (what each knob does)
enterZ / exitZ (signal strictness + hysteresis)
Higher enterZ → fewer, cleaner signals (e.g., 1.8–2.2).
exitZ should be lower than enterZ (e.g., 0.6–1.0) to prevent flicker.
lenPrem (context window for z)
Larger (50–100) = steadier baseline, fewer signals.
Smaller (20–30) = more reactive, more signals.
smoothLen (EMA on z)
2–3 = snappier; 5–7 = smoother/laggier but cleaner.
useSigma, bbLen, bbK (price-stretch filter)
On filters chop. Try bbLen=100, bbK=1.0–1.5.
Off if you want more frequent signals or you already gate with your own σ/Keltner.
useHTF, htfTF, htfZmin (trend/confirmation)
Turn on to require higher-TF imbalance agreement (e.g., trading 1H → confirm with 4H htfTF=240, htfZmin≈0.6–1.0).
hotZ (visual intensity)
Lower (2.0–2.5) heats up faster; higher (4.0) is more subtle.
Ready-made presets
Conservative swing (fewer, higher-conviction):
enterZ=2.0, exitZ=1.0, lenPrem=60–80, smoothLen=5, useSigma=true, bbK=1.5, useHTF=true (240/0.8).
Balanced intraday (default feel):
enterZ=1.6–1.8, exitZ=0.8–1.0, lenPrem=50, smoothLen=3–4, useSigma=true, bbK=1.0–1.25, useHTF=false/true depending on trendiness.
Aggressive scalping (more signals):
enterZ=1.2–1.4, exitZ=0.6–0.8, lenPrem=20–30, smoothLen=2–3, useSigma=false, useHTF=false.
Practical tips
Don’t trade the line in isolation. Use it to time trades into your levels: VWAP bands, Monday high/low, prior POC/VAH/VAL, order blocks, etc.
Perp-led reversals often snap—be ready to scale out quickly back to mid-bands.
Venue matters. Keep spot & perp from the same exchange family to avoid cross-venue quirks.
Alerts: enable after you’ve tuned thresholds for your timeframe so you only get high-quality pings.

BPS Multi-MA 5 — 22/30, SMA/WMA/EMA# Multi-MA 5 — 22/30 base, SMA/WMA/EMA
**What it is**
A lightweight 5-line moving-average ribbon for fast visual bias and trend/mean-reversion reads. You can switch the MA type (SMA/WMA/EMA) and choose between two ways of setting lengths: by monthly “session-based” base (22 or 30) with multipliers, or by entering exact lengths manually. An optional info table shows the effective settings in real time.
---
## How it works
* Calculates five moving averages from the selected price source.
* Lengths are either:
* **Multipliers mode:** `Base × Multiplier` (e.g., base 22 → 22/44/66/88/110), or
* **Manual mode:** any five exact lengths (e.g., 10/22/50/100/200).
* Plots five lines with fixed legend titles (MA1…MA5); the **info table** displays the actual type and lengths.
---
## Inputs
**Length Mode**
* **Multipliers** — choose a **Base** of **22** (≈ trading sessions per month) or **30** (calendar-style, smoother) and set **×1…×5** multipliers.
* **Manual** — enter **Len1…Len5** directly.
**MA Settings**
* **MA Type:** SMA / WMA / EMA
* **Source:** any series (e.g., `close`, `hlc3`, etc.)
* **Use true close (ignore Heikin Ashi):** when enabled, the MA is computed from the underlying instrument’s real `close`, not HA candles.
* **Show info table:** toggles the on-chart table with the current mode, type, base, and lengths.
---
## Quick start
1. Add the indicator to your chart.
2. Pick **MA Type** (e.g., **WMA** for faster response, **SMA** for smoother).
3. Choose **Length Mode**:
* **Multipliers:** set **Base = 22** for session-based monthly lengths (stocks/FX), or **30** for heavier smoothing.
* **Manual:** enter your exact lengths (e.g., 10/22/50/100/200).
4. (Optional) On **Heikin Ashi** charts, enable **Use true close** if you want the lines based on the instrument’s real close.
---
## Tips & notes
* **1 month ≈ 21–22 sessions.** Using 30 as “monthly” yields a smoother, more delayed curve.
* **WMA** reacts faster than **SMA** at the same length; expect earlier signals but more whipsaws in chop.
* **Len = 1** makes the MA track the chosen source (e.g., `close`) almost exactly.
* If changing lengths doesn’t move the lines, ensure you’re editing fields for the **active Length Mode** (Multipliers vs Manual).
* For clean comparisons, use the **same timeframe**. If you later wrap this in MTF logic, keep `lookahead_off` and handle gaps appropriately.
---
## Use cases
* Trend ribbon and dynamic bias zones
* Pullback entries to the mid/slow lines
* Crossovers (fast vs slow) for confirmation
* Volatility filtering by spreading lengths (e.g., 22/44/88/132/176)
---
**Credits:** Built for clarity and speed; designed around session-based “monthly” lengths (22) or smoother calendar-style (30).


Weekly and Daily EMA levelsThis Pine Script indicator provides important weekly and daily levels for lower time frame traders, whom trades based on reaction of these levels.
Dedicated to Prof Michael G
Key Features:
Multi-timeframe EMAs: Shows 12, 21, 50, 100, and 200 period EMAs from both Weekly and Daily timeframes
Horizontal dotted lines: Uses plot.style_linebr to create the dotted/dashed line effect
Works on all timeframes: The lines will appear on any chart timeframe you're viewing
Customizable: Individual toggles for each EMA period and timeframe
Settings Available:
Toggle Weekly/Daily EMAs on/off
Enable/disable individual EMA periods (12, 21, 50, 100, 200)
Customize colors for each EMA line
Adjust line width
Optional labels showing current EMA values
How to Use:
Copy the code into TradingView's Pine Editor
Click "Add to Chart"
Adjust settings in the indicator's Style tab as needed
The weekly EMAs appear with slightly more opacity (30%) while daily EMAs have higher transparency (60%) to help distinguish between timeframes. The lines will automatically update as new bars form and will be visible regardless of what timeframe you're currently viewing on your chart.

Moving Averages 7 & 15 & 50 & 100 & 200 & 400we can use 7 moving averages for one indicator.
base moving averages are 7, 15, 50, 100, 200 and 400.
it can be used for determining of trend
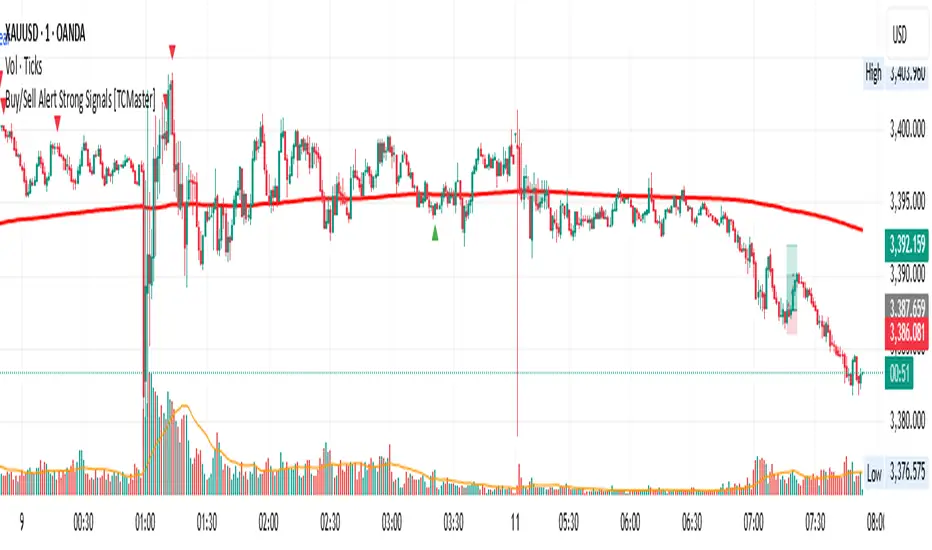
Buy/Sell Alert Strong Signals [TCMaster]This indicator combines Smoothed Moving Averages (SMMA), Stochastic Oscillator, and popular candlestick patterns (Engulfing, 3 Line Strike) to highlight potential trend reversal zones.
Main features:
4 SMMA lines (21, 50, 100, 200) for short-, medium-, and long-term trend analysis.
Trend Fill: Background shading when EMA(2) and SMMA(200) are aligned, visually confirming trend direction.
Stochastic Filter: Filters signals based on overbought/oversold conditions to help reduce noise.
Candlestick pattern recognition:
Bullish/Bearish Engulfing
Bullish/Bearish 3 Line Strike
Alerts for each pattern when Stochastic conditions are met.
⚠️ Note: This is a technical analysis tool. It does not guarantee accuracy and is not financial advice. Always combine with other analysis methods and practice proper risk management.
🛠 How to Use:
1. SMMA Settings
21 SMMA & 50 SMMA: Short- and medium-term trend tracking.
100 SMMA: Optional mid/long-term filter (toggle on/off).
200 SMMA: Major trend direction reference.
2. Trend Fill
EMA(2) > SMMA(200): Background shaded green (uptrend bias).
EMA(2) < SMMA(200): Background shaded red (downtrend bias).
Can be enabled/disabled in settings.
3. Stochastic Filter
K Length, D Smoothing, Smooth K: Adjust sensitivity.
Overbought & Oversold: Default 80 / 20 thresholds.
Buy signals only valid if Stochastic is oversold.
Sell signals only valid if Stochastic is overbought.
4. Candlestick Patterns
3 Line Strike:
Bullish: Three consecutive bullish candles followed by one bearish candle closing below the previous, with potential reversal.
Bearish: Three consecutive bearish candles followed by one bullish candle closing above the previous, with potential reversal.
Engulfing:
Bullish: Green candle fully engulfs the prior red candle body.
Bearish: Red candle fully engulfs the prior green candle body.
5. Alerts
Alerts available for each pattern when Stochastic conditions are met.
Example: "Bullish Engulfing + Stochastic confirm".
📌 Important Notes
Do not use this indicator as the sole basis for trading decisions.
Test on a demo account before applying to live trades.
Combine with multi-timeframe analysis, volume, and proper position sizing.
Multi-Length Quad Bollinger BandsHere is a Pine Script code for TradingView that plots four separate Bollinger Bands on your chart. The lengths are preset to 14, 50, 100, and 200, but every aspect—including lengths, standard deviations, colors, and the source price—is fully customizable through the script's settings menu.
The 14 and 50-period bands are enabled by default, while the 100 and 200-period bands are disabled to keep the chart clean initially. You can easily toggle any of them on or off.

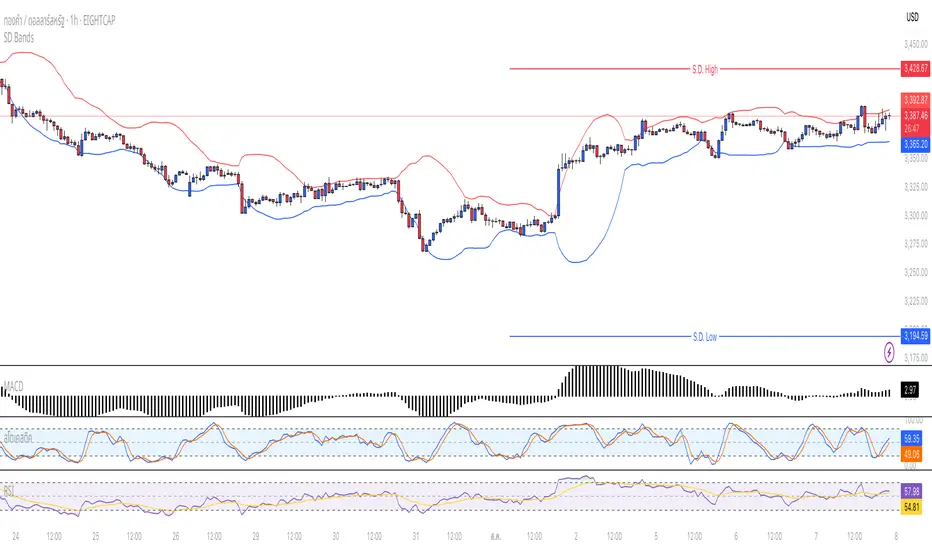
Standard Deviation BandsStandard Deviation Bands
คำอธิบายอินดิเคเตอร์:
อินดิเคเตอร์ SD Bands (Standard Deviation Bands) เป็นเครื่องมือวิเคราะห์ทางเทคนิคที่ออกแบบมาเพื่อวัดความผันผวนของราคาและระบุโอกาสในการเทรดที่อาจเกิดขึ้น อินดิเคเตอร์นี้จะแสดงผลเป็นเส้นขอบ 2 เส้นบนกราฟราคาโดยตรง โดยอ้างอิงจากค่าเฉลี่ยเคลื่อนที่ (Moving Average) และค่าส่วนเบี่ยงเบนมาตรฐาน (Standard Deviation)
* เส้นบน (Upper Band): แสดงระดับที่ราคาเคลื่อนไหวสูงกว่าค่าเฉลี่ย
* เส้นล่าง (Lower Band): แสดงระดับที่ราคาเคลื่อนไหวต่ำกว่าค่าเฉลี่ย
ความกว้างของช่องระหว่างเส้นทั้งสองบ่งบอกถึงระดับความผันผวนของตลาดในปัจจุบัน
วิธีการใช้งานอย่างละเอียด:
คุณสามารถนำอินดิเคเตอร์ SD Bands ไปประยุกต์ใช้ได้หลายวิธีเพื่อประกอบการตัดสินใจ ดังนี้:
1. การใช้เป็นแนวรับ-แนวต้านแบบไดนามิก (Dynamic Support & Resistance)
* แนวรับ: เมื่อราคาวิ่งลงมาแตะหรือเข้าใกล้เส้นล่าง (เส้นสีน้ำเงิน) เส้นนี้อาจทำหน้าที่เป็นแนวรับชั่วคราวและมีโอกาสที่ราคาจะเด้งกลับขึ้นไปหาเส้นกลาง
* แนวต้าน: เมื่อราคาวิ่งขึ้นไปแตะหรือเข้าใกล้เส้นบน (เส้นสีแดง) เส้นนี้อาจทำหน้าที่เป็นแนวต้านชั่วคราวและมีโอกาสที่ราคาจะย่อตัวลงมา
2. การวัดความผันผวนและสัญญาณ Breakout
* ช่วงตลาดสงบ (Low Volatility): เมื่อเส้น SD ทั้งสองเส้นบีบตัวเข้าหากันเป็นช่องที่แคบมาก (คล้ายกับ Bollinger Squeeze) แสดงว่าตลาดมีความผันผวนต่ำมาก ซึ่งมักจะเป็นสัญญาณว่ากำลังจะเกิดการเคลื่อนไหวครั้งใหญ่ (Breakout)
* ช่วงตลาดเป็นเทรนด์ (High Volatility): เมื่อเส้น SD ขยายตัวกว้างออกอย่างรวดเร็ว พร้อมกับที่ราคาวิ่งอยู่นอกขอบ แสดงว่าตลาดเข้าสู่ช่วงเทรนด์ที่แข็งแกร่งและมีโมเมนตัมสูง
3. สัญญาณการกลับตัว (Reversal Signals)
* เมื่อราคาปิดแท่งเทียน นอกเส้น SD Bands อย่างชัดเจน (โดยเฉพาะหลังจากที่เทรนด์นั้นดำเนินมานาน) อาจเป็นสัญญาณว่าแรงซื้อ/แรงขายเริ่มอ่อนกำลังลง และมีโอกาสที่จะเกิดการกลับตัวของราคาในไม่ช้า
การตั้งค่าอินพุต (Input Parameters):
* ระยะเวลา (Length): กำหนดจำนวนแท่งเทียนที่ใช้ในการคำนวณค่าเฉลี่ยและ SD
* 20: สำหรับการวิเคราะห์ระยะสั้นถึงกลาง
* 50 หรือ 100: สำหรับการวิเคราะห์ระยะยาว
* ตัวคูณ (Multiplier): กำหนดระยะห่างของเส้น SD จากค่าเฉลี่ย
* 1.0 - 2.0: เส้นจะอยู่ใกล้ราคามากขึ้น ทำให้เกิดสัญญาณบ่อยขึ้น
* 2.0 - 3.0: เส้นจะอยู่ห่างจากราคามากขึ้น ทำให้เกิดสัญญาณที่น่าเชื่อถือมากขึ้น แต่จะเกิดไม่บ่อย
ข้อควรระวังและคำเตือน:
* อินดิเคเตอร์นี้เป็นเพียง เครื่องมือวิเคราะห์ เพื่อช่วยในการตัดสินใจ ไม่ใช่สัญญาณการซื้อขายที่ถูกต้อง 100%
* ควรใช้ร่วมกับเครื่องมืออื่นๆ เช่น RSI, MACD, หรือ Volume เพื่อยืนยันสัญญาณ
* การเทรดมีความเสี่ยงสูง ควรบริหารจัดการความเสี่ยงและตั้งจุด Stop Loss ทุกครั้ง
คุณสามารถใช้โครงสร้างนี้ในการเขียนโพสต์บน TradingView ได้เลยนะครับ ขอให้ประสบความสำเร็จกับการโพสต์อินดิเคเตอร์ของคุณครับ!
English
Standard Deviation Bands
Indicator Description:
The SD Bands (Standard Deviation Bands) indicator is a powerful technical analysis tool designed to measure price volatility and identify potential trading opportunities. The indicator displays two dynamic bands directly on the price chart, based on a moving average and a customizable standard deviation multiplier.
* Upper Band: Indicates price levels above the moving average.
* Lower Band: Indicates price levels below the moving average.
The width of the channel between these two bands provides a clear picture of current market volatility.
Detailed User Guide:
You can use SD Bands in several ways to enhance your trading decisions:
1. Dynamic Support and Resistance:
These bands can act as dynamic support and resistance levels.
* Support: When the price moves down and touches or approaches the lower band, it can act as support, offering the possibility of a rebound to the average.
* Resistance: When the price moves up and touches or approaches the upper band, it can act as resistance, offering the possibility of a rebound.
2. Volatility Measurement and Breakout Signals:
* Low Volatility (Squeeze): When the two bands converge and form a narrow channel. Indicates very low market volatility. This condition often occurs before significant price movements or breakouts.
* High Volatility (Expansion): When the bands expand and widen rapidly, it indicates that the market is entering a period of strong trending momentum with high momentum.
3. Reversal Signals:
* When the price closes significantly outside the SD Bands (especially after a long-term trend), it may signal that the current momentum has expired and a reversal may be imminent.
Input Parameters:
The indicator's parameters are fully customizable to suit your trading style:
* Length: Defines the number of bars used to calculate the moving average and standard deviation.
* 20: Suitable for short- to medium-term analysis.
* 50 or 100: Suitable for long-term trend analysis.
* Multiplier: Adjusts the sensitivity of the signal bars.
* 1.0 - 2.0: Creates narrower signal bars, leading to more frequent signals.
* 2.0 - 3.0: Creates wider signal bars, providing fewer but potentially more significant signals.
Important Warning:
* This indicator is an analytical tool only. It does not provide guaranteed buy or sell signals.
* Always use it in conjunction with other indicators (such as RSI, MACD, and Volume) for confirmation.
* Trading involves high risk. Proper risk management, including the use of stop-loss orders, is recommended.
You can use this structure for your posts on TradingView. Good luck with your indicators!
MA Table [RanaAlgo]The "MA Table " indicator is a comprehensive and visually appealing tool for tracking moving average signals in TradingView. Here's a short summary of its usefulness:
Key Features:
Dual MA Support:
Tracks both EMA (Exponential Moving Average) and SMA (Simple Moving Average) signals (10, 20, 30, 50, 100 periods).
Users can toggle visibility for EMA/SMA separately.
Clear Signal Visualization:
Displays Buy (▲) or Sell (▼) signals based on price position relative to each MA.
Color-coded (green for buy, red for sell) for quick interpretation.
Customizable Table Design:
Adjustable position (9 placement options), colors, text size, and border styling.
Alternating row colors improve readability.
Optional MA Plots:
Can display the actual MA lines on the chart for visual confirmation (with distinct colors/styles).
Usefulness:
Quick Overview: The table consolidates multiple MA signals in one place, saving time compared to checking each MA individually.
Trend Confirmation: Helps confirm trend strength when multiple MAs align (e.g., price above all MAs → strong uptrend).
Flexible: Suitable for both short-term (10-20 period) and long-term (50-100 period) traders.
Aesthetic: Professional design enhances chart clarity without clutter.
Ideal For:
Traders who rely on moving average crossovers or price-MA relationships.
Multi-timeframe analysis when combined with other tools.
Beginners learning MA strategies (clear visual feedback).

TrendShift [MOT]📈 TrendShift – Multi-Factor Momentum & Trend Signal Suite
TrendShift is a precision-built momentum and confluence tool designed to highlight directional shifts in price action. It combines EMA slope structure, oscillator confirmation, volume behavior, and dynamic SL/TP logic into one cohesive system. Whether you're trading with the trend or catching reversals, TrendShift provides data-backed clarity and visual confidence — and it’s available free to the public.
🔍 Core Signal Logic
Buy (🟢 Long) and Sell (🔴 Short) signals are triggered when multiple conditions align within a set bar window (default: 5 bars):
Stochastic RSI K/D cross
RSI crosses above 20 (long) or below 80 (short)
Stochastic RSI breaks 20 (long) or 80 (short)
Volume exceeds 20-bar average
🧭 Visual Trend Dashboard – Signal Table
A real-time on-chart dashboard displays:
EMA Trend: Bullish / Bearish / Mixed (based on 4 EMA slopes)
Stoch RSI: Oversold / Overbought / Neutral
RSI: Exact value with zone label
Volume: Above or Below average
Dashboard theme and position are fully customizable.
📐 Trend Structure with EMA Slope Logic
Plots four EMAs (21, 50, 100, 200) color-coded by slope:
Green = Rising
Red = Falling
These feed into the dashboard's EMA Trend display.
🎯 Optional Take Profit / Stop Loss Zones
When enabled, SL/TP lines plot automatically on valid signals:
Fixed-distance targets (e.g., 10pt TP, 5pt SL)
Auto-remove on TP or SL hit
Separate lines for long vs. short trades
Fully customizable styling
🔁 Trailing Stop Filter (Internal Logic)
A custom ATR-based trailing stop helps validate directional strength:
ATR period
HHV window
ATR multiplier
Used internally — not plotted — to confirm trend progression before entry.
⚙️ Customizable Parameters
Every core component is user-configurable:
EMA periods: 21 / 50 / 100 / 200
ATR trailing logic: period, HHV, multiplier
Oscillator settings: Stoch RSI & RSI
Volume length
SL/TP toggles and point values
Bar clustering window
Dashboard theme and location
🔔 Alerts Included
BUY Signal Triggered
SELL Signal Triggered
Compatible with webhook automation or mobile push notifications.
⚠️ Disclaimer
This tool is for educational purposes only and is not financial advice. Trading involves risk — always do your own research and consult a licensed professional before making trading decisions.

TPO[Fixed Range, Anchored, Bars Back]TPO Bars Back, Fixed Range and Anchored
Overview
The TPO Profile (Time Price Opportunity Profile) is a powerful market profile indicator that displays the amount of time price spent at different levels during a specified period. Unlike traditional volume profile indicators that show volume distribution, TPO Profile shows time distribution , providing insights into where price has spent the most time and identifying key support and resistance levels.
Key Advantages Over TradingView's Built-in TPO
Simplified Composite Creation : Automatically creates TPO profiles for any time range without manual split/merge operations
Instant Value Area Calculation : Immediately shows Value Area, POC, VAH, and VAL for your selected period
No Manual Assembly Required : TradingView's native TPO requires you to manually split sessions and merge them to create composites - this indicator does it automatically
Flexible Time Ranges : Create composites for any custom time period (multiple days, weeks, specific events) with a few clicks
Real-time Composite Updates : Anchor mode creates live composites that update as new data arrives
Multiple Composite Analysis : Easily compare different time periods without the tedious manual process
Key Features
Core Functionality
Time-Based Analysis : Shows time spent at each price level rather than volume
Configurable Time Blocks : Use any timeframe for TPO counting (30min, 1H, 4H, etc.)
Multiple Price Levels : Adjustable from 5 to 200 levels for granular analysis
Point of Control (POC) : Automatically identifies the price level with highest time activity
Value Area Calculation : Shows the price range containing 70% (configurable) of time activity
Automatic Composite Generation : Creates multi-session composites without manual intervention
Three Operating Modes
1. Bars Back Mode
Analyzes the last N bars from the current bar
Perfect for recent market activity analysis
Range: 10-500 bars
Use Case : Intraday analysis, recent session review
2. Fixed Range Mode
Analyzes a specific time period between start and end times
Ideal for historical analysis of specific events
Creates perfect composites for multi-day periods
Use Case : Earnings periods, news events, specific trading sessions, weekly/monthly composites
3. Anchor Mode (NEW)
Starts from a specific time and extends to the current bar
Dynamically updates as new bars form
Perfect for building live composites from any starting point
Use Case : Live session monitoring, event-based analysis from a specific point, growing composites
Visual Elements
TPO Bars
Horizontal bars showing time distribution at each price level
Longer bars = more time spent at that level
Color-coded to distinguish Value Area from outlying levels
Point of Control (POC)
Red line marking the price level with highest time activity
Most significant support/resistance level
Configurable line style (Solid/Dashed/Dotted) and width
Value Area High/Low (VAH/VAL)
Green and Orange lines marking the boundaries of the Value Area
Shows the price range containing the specified percentage of time activity
Optional display with customizable line styles
Single Print Detection
Identifies price levels touched by only one time block
Display options: Lines or Boxes
Purple color highlighting these significant levels
Often act as strong support/resistance in future trading
Customization Options
Time Block Configuration
Block Time : Choose timeframe for TPO counting (30min, 1H, 4H, etc.)
Allows analysis at different time granularities
Higher timeframes = broader perspective, Lower timeframes = finer detail
Visual Styling
Line Styles : Solid, Dashed, or Dotted for all line elements
Line Widths : 1-5 pixels for POC, VAH, and VAL lines
Colors : Fully customizable colors for all elements
Transparency : Adjustable transparency for better chart readability
Label Management
Show/Hide Labels : Toggle POC, VAH, VAL labels
Font Sizes : Tiny, Small, Normal, Large, Huge
Label Positioning : 8 different position options relative to lines
Offset Controls : Fine-tune label positioning
Line Extension
Level Offset Right : Controls how far lines extend
Smart extension logic:
Value ≤ 0: Infinite extension (extend.right)
Value ≥ 1: Extends exactly N bars ahead
Trading Applications
Support & Resistance
POC often acts as strong support/resistance
Value Area boundaries provide key levels
Single prints frequently become significant levels
Market Structure Analysis
Identify areas of price acceptance (thick TPO bars)
Spot areas of price rejection (thin TPO bars)
Understand where market participants are comfortable trading
Composite Profile Analysis
Create multi-day, weekly, or monthly composites instantly
Compare different composite periods without manual work
Analyze longer-term price acceptance levels
Build composites around specific events or announcements
Session Analysis
Monitor intraday session development in real-time
Compare different sessions (London, New York, Asia)
Track how profiles change throughout the trading day
Build live composites across multiple sessions
Event Analysis
Use Fixed Range mode for earnings, news events
Use Anchor mode to track price development from specific events
Compare pre/post event price acceptance levels
Create event-based composites automatically
Input Parameters
Mode Selection
Mode : Bars Back | Fixed Range | Anchor
Bars Back : Number of bars to analyze (10-500)
Start Time : Beginning time for Fixed Range and Anchor modes
End Time : Ending time for Fixed Range mode only
Analysis Configuration
Block Time : Timeframe for TPO blocks (e.g., "30" for 30-minute blocks)
TPO Levels : Number of price levels (5-200)
Value Area % : Percentage for Value Area calculation (50-95%)
Display Options
Show POC : Display Point of Control line
Show Value Area : Display Value Area box
Show VAH/VAL Lines : Display Value Area boundary lines
Show Single Prints : Display single print detection
Single Print Style : Lines or Boxes
Styling Controls
Colors : TPO, POC, Value Area, VAH, VAL, Single Print colors
Line Styles : POC, VAH, VAL line styles
Line Widths : POC, VAH, VAL line widths
Labels : Show/hide, font size, position, offset controls
Technical Details
Calculation Method
Divides the price range into equal levels based on TPO Levels setting
For each time block, determines which price levels it crosses
Adds +1 count to each crossed level
Identifies POC as the level with highest count
Calculates Value Area by expanding from POC until target percentage is reached
Performance Considerations
Historical data limited to prevent buffer overflow errors
Smart bounds checking for different timeframes
Optimized cleanup routines to prevent drawing object accumulation
Pine Script Version
Built on Pine Script v6
Uses modern Pine Script best practices
Efficient array handling and drawing object management
Best Practices
Timeframe Selection
Block Time = Chart Timeframe : Traditional TPO approach
Block Time > Chart Timeframe : Smoother, broader perspective
Block Time < Chart Timeframe : More granular, detailed analysis
Level Count Guidelines
Low levels (10-20) : Better for swing trading, major levels
High levels (50-100) : Better for scalping, precise entries
Very high levels (100+) : For very detailed analysis
Mode Selection
Bars Back : Daily analysis, recent activity
Fixed Range : Historical events, specific periods, manual composites
Anchor : Live monitoring, event-based analysis, growing composites
Composite Creation Workflow
Select Fixed Range or Anchor mode
Set your desired start time (and end time for Fixed Range)
Adjust TPO Levels for desired granularity
Enable VAH/VAL lines to see Value Area boundaries
The composite profile generates automatically with all key levels
This indicator eliminates the tedious manual process of creating composite TPO profiles in TradingView. Instead of splitting sessions and manually merging them, you get instant composite analysis with automatic Value Area calculation, POC identification, and single print detection. The combination of time-based analysis, multiple operating modes, and extensive customization options makes it a powerful tool for understanding market structure and price acceptance levels across any time period.
