Simple Trading SessionsThis indicator highlights the major global trading sessions (Tokyo, London, and New York) directly on your chart with clean background shading.
Tokyo Session (default 00:00–09:00 exchange time)
London Session (default 07:00–16:00 exchange time)
New York Session (default 12:30–21:00 exchange time)
Each session is displayed as a different shaded block, making it easy to:
Spot when the market is most active.
Identify overlapping periods (e.g., London–New York overlap).
Backtest strategies that depend on session timing.
⚙️ How to Use
Add the indicator to any intraday chart.
Adjust session times in the settings panel to match your broker or preferred timezone.
Use the shading to guide your trading around regional liquidity zones.
✅ Notes
By default, session times follow the chart’s exchange timezone.
You can change the inputs to match your own session definitions.
Very lightweight and designed for traders who want a simple, uncluttered session map without extra calculations.
"美联储议息会议12月时间"に関するスクリプトを検索

Iani SMC Sniper XAU v2.2 (Long+Short + News Countdown, v6)Iani SMC Sniper v2.6 — Anytime • Auto Pip • FVG 50% • OB • News Panel
Smart-Money Concepts made simple for intraday XAU/USD (works on any symbol).
Finds BOS, 50% FVG “sniper” entries, optional Order Blocks, London H/L, news countdown, and a mini info panel.
What it does
BOS (Break of Structure): detects bullish/bearish BOS after London sweep logic.
FVG 50% entries: plots precise long/short entry dots at the midpoint of the gap.
Auto TP/SL: TP = RR × risk, SL below/above recent swing with a small buffer.
Order Blocks (optional): marks the last opposite candle after BOS and alerts on OB revisit.
London High/Low: tracks session range; session filter is optional.
News countdown: shows next event time and minutes left (user-selectable timezone).
Mini Panel: top-left table with Trend (last BOS), Next news, R:R, Pip size.
Inputs (key)
Auto pip size: uses syminfo.mintick. Manual override available.
Risk:Reward (RR): default 2.0.
Pivot length: swing sensitivity.
Sessions: enable if you want signals only 12:00–20:00 (symbol timezone). Off = anytime.
News timezone: pick your own (e.g., Europe/Brussels, America/New_York).
Absolute & daily times: add your events (strings like 2025-09-17 20:00 or 14:30,16:00…).
Show labels/levels/OBs: toggle on/off.
Alerts included
BOS Bullish / BOS Bearish
BUY Entry / SELL Entry (return to 50% FVG)
Bullish OB revisit / Bearish OB revisit
TP Long/Short reached, SL Long/Short hit
NEWS WARNING (warning window only; does not block signals)
To use: Add Alert → Condition: this indicator → choose any of the alertconditions.
Best use
Bias: H1 for structure.
Execution: M15 (standard) or M5 (aggressive).
Works great on XAUUSD, but is symbol-agnostic (auto pip adapts).
Notes
News times display in the timezone you pick in settings.
OBs are a simple implementation meant for quick visual guidance.
Labels: BUY/SELL near entries, TP/SL on set and when hit, BOS up/down.
Risk disclaimer
This tool is for education only. Not financial advice. Backtest and manage risk.

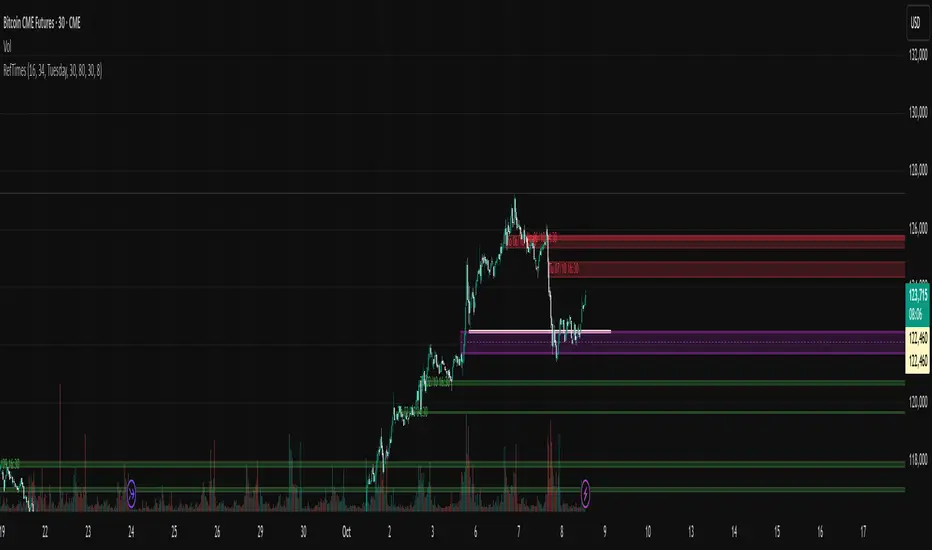
Reference timesThe theory behind this indicator is that sometimes the graph reaches a certain price at at a certain time according to the price it had at the same time and day in any of the previous weeks. If you could easily see what happened a few weeks ago on this day's weekday and half an hour from now, you might theoretically gain more assurance as to where the graph might go in the next half an hour.
This of course relies of the premise that some traders choose to enter or exit positions according to historical times they are referencing. Hence the name - Reference times.
Example:
it is now 08:00 ET Wednesday. I want to guess what the graph will do in the next half hour. I enter in the indicator the weekday "Wednesday", the time "8:30", and go to 30 minute candles.
I will then see all the candles the graph has been on historical Wednesdays at 8:30. If the candles are below the 08:00 price, we might guess that the graph might want to descent. If they are above the graph, we might guess that the graph might ascend.
How it works:
The user defines a weekday and time he wants to inquire on.
The script searches for past weekdays and similar hours.
It marks these bars at their wicks.
The user can also inquire "opposite hours" - 12 hours ahead or earlier.
The user can also inquire "opposite days" - Monday<->Wednesday, Tuesday<->Thursday.
In addition, the User may inquire the previous day of his selected weekday, which will mark the most recent previous day existent.
Side note: The Time zone offset is set for Jerusalem time. and so it may need future adjustment.
send debugging instances if you find any
Thank you
Assaf Fogelman 2025

Reference TimesThe theory behind this indicator is that sometime the graph will change its direction at a point that is the point it reached at that weekday on that time in the previous weeks. If you can easily see what happened a few weeks ago on this day's weekday and a half an hour from now, you might theoretically gain more assurance as to where the graph might go in the next half an hour.
This of course relies of the premise that some traders choose to enter or exit positions according to historical times they are referencing. Hence the name - Reference times.
Example:
it is now 08:00 ET Wednesday. I want to guess what the graph will do in half an hour. I enter in the indicator the weekday "Wednesday", the time "8:30", and go to 30 minute candles.
I will then see all the candles the graph has been on historical Wednesdays at 8:30. If the candles are below the 08:00 price, we might guess that the graph might want to descent. If they are above the graph, we would guess the graph might want to ascend.
How it works:
The user defines a weekday and time he wants to inquire on.
The script searches for past weekdays and similar hours.
It marks these bars at their wicks.
The user can also inquire "opposite hours" - 12 hours ahead or earlier.
The user can also inquire "opposite days" - Monday<->Wednesday, Tuesday<->Thursday.
In addition, the User may inquire the previous day of his selected weekday, which will mark the most recent previous day existent.
Side note: The Time zone offset is set for Jerusalem time. and so it may need future adjustment.
send debugging instances if you find any
Thank you
Assaf Fogelman 2025
SCTR - AbsoluteIndicator for showing Absolute Value of SCTR - StockCharts Technical Rank.
Uses the calculations from Stock Charts based on the following:
Long-Term Indicators (weighting)
--------------------------------
* Percent above/below 200-day EMA (30%)
* 125-Day Rate-of-Change (30%)
Medium-Term Indicators (weighting)
----------------------------------
* Percent above/below 50-day EMA (15%)
* 20-day Rate-of-Change (15%)
Short-Term Indicators (weighting)
---------------------------------
* 3-day slope of PPO(12,26,9) Histogram/3 (5%)
* 14-day RSI (5%)

Daily + 4H MACD & RSI Screeneri used this script for my swing trading entry.
//@version=5
indicator("Daily + 4H MACD & RSI Screener", overlay=false)
// settings
rsiLength = input.int(14, "RSI Length")
rsiLevel = input.int(50, "RSI Threshold")
macdFast = input.int(12, "MACD Fast")
macdSlow = input.int(26, "MACD Slow")
macdSignal = input.int(9, "MACD Signal")
// ---- daily timeframe ----
dailyRsi = request.security(syminfo.tickerid, "D", ta.rsi(close, rsiLength))
= request.security(syminfo.tickerid, "D", ta.macd(close, macdFast, macdSlow, macdSignal))
dailyRsiPass = dailyRsi < rsiLevel
dailyMacdPass = dailyMacd < 0
dailyCondition = dailyRsiPass and dailyMacdPass
// ---- 4H timeframe ----
h4Rsi = request.security(syminfo.tickerid, "240", ta.rsi(close, rsiLength))
= request.security(syminfo.tickerid, "240", ta.macd(close, macdFast, macdSlow, macdSignal))
h4RsiPass = h4Rsi < rsiLevel
h4MacdPass = h4Macd < 0
h4Condition = h4RsiPass and h4MacdPass
// ---- combined condition ----
finalCondition = dailyCondition and h4Condition
// plot signals
plotshape(finalCondition, style=shape.triangledown, location=location.top, color=color.red, size=size.large, title="Signal")
bgcolor(finalCondition ? color.new(color.red, 85) : na)
// ---- table (3 columns x 4 rows) ----
var table statusTable = table.new(position=position.top_right, columns=3, rows=4, border_width=1)
// headers
table.cell(statusTable, 0, 0, "Timeframe", text_color=color.white, bgcolor=color.new(color.black, 0))
table.cell(statusTable, 1, 0, "RSI", text_color=color.white, bgcolor=color.new(color.black, 0))
table.cell(statusTable, 2, 0, "MACD", text_color=color.white, bgcolor=color.new(color.black, 0))
// daily row
table.cell(statusTable, 0, 1, "Daily", text_color=color.white, bgcolor=color.new(color.black, 0))
table.cell(statusTable, 1, 1, str.tostring(dailyRsi, "#.##"),
text_color=color.white, bgcolor=dailyRsiPass ? color.new(color.green, 60) : color.new(color.red, 60))
table.cell(statusTable, 2, 1, str.tostring(dailyMacd, "#.##"),
text_color=color.white, bgcolor=dailyMacdPass ? color.new(color.green, 60) : color.new(color.red, 60))
// 4H row
table.cell(statusTable, 0, 2, "4H", text_color=color.white, bgcolor=color.new(color.black, 0))
table.cell(statusTable, 1, 2, str.tostring(h4Rsi, "#.##"),
text_color=color.white, bgcolor=h4RsiPass ? color.new(color.green, 60) : color.new(color.red, 60))
table.cell(statusTable, 2, 2, str.tostring(h4Macd, "#.##"),
text_color=color.white, bgcolor=h4MacdPass ? color.new(color.green, 60) : color.new(color.red, 60))
// status row (simulate colspan by using two adjacent cells with the same bgcolor)
table.cell(statusTable, 0, 3, "Status", text_color=color.white, bgcolor=color.new(color.black, 0))
statusText = finalCondition ? "match" : "no match"
statusBg = finalCondition ? color.new(color.green, 0) : color.new(color.red, 0)
table.cell(statusTable, 1, 3, statusText, text_color=color.white, bgcolor=statusBg, text_size=size.large)
table.cell(statusTable, 2, 3, "", text_color=color.white, bgcolor=statusBg)

Chimera [theUltimator5]In myth, the chimera is an “impossible” hybrid—lion, goat, and serpent fused into one—striking to look at and formidable in presence. The word has come to mean a beautiful, improbable union of parts that shouldn’t work together, yet do.
Chimera is a dual-mode market context tool that blends a multi-input oscillator with classic ADX/DI trend strength, plus optional multi-timeframe “gap-line” tracking. Use it to visualize regime (trend vs. range), momentum swings around an adaptive midline, and higher timeframe (HTF) reference levels that auto-terminate on touch/cross.
Modes
1) Oscillator view
A smoothed composite of five common inputs—RSI, MACD (oscillator), Bollinger position, Stochastic, and an ATR/DI-weighted bias. Each is normalized to a comparable 0–100 style scale, averaged, and plotted as a candle-style oscillator (short vs. long smoothing, wickless for clarity). A dynamic midline with standard-deviation bands frames neutral → bearish/bullish zones. Colors ramp from neutral to your chosen Oversold/Overbought endpoints; consolidation can override to white.
Here is a description of the (5) signals used to calculate the sentiment oscillator:
RSI (14): Measures recent momentum by comparing average gains vs. losses. High = strength after advances; low = weakness after declines. (Z-score normalized to 0–100.)
MACD oscillator (12/26/9): Uses the difference between MACD and its signal (histogram) to gauge momentum shifts. Positive = bullish tilt; negative = bearish. (Z-score normalized.)
Bollinger Bands position (20, 2): Locates price within the bands (0–100 from lower → upper). Near upper suggests strength/expansion; near lower suggests weakness/contraction. (Then normalized.)
Stochastic (14, 3, 3): Shows where the close sits within the recent high-low range, smoothed via %D. Higher values = closes near highs; lower = near lows. (Scaled 0–100.)
ATR/DI composite (14): Volatility-weighted directional bias: (+DI − −DI) amplified by ATR as a % of price and its relative average. Positive = bullish pressure with volatility; negative = bearish. (Rank/scale normalized.)
All five are normalized and averaged into one composite, then smoothed (short/long) and compared to an adaptive midline with bands.
2) ADX view
Shows ADX, +DI, –DI with user-defined High Threshold. Transparency and color shift with regime. When ADX is strong, a directional “fire/ice” gradient fills the area between ADX and the high threshold, biased toward the dominant DI; when ADX is weak, a soft white fade highlights low-trend conditions.
HTF gap-line tracking (optional; both modes)
Detects “gap-like” reference levels after weak-trend consolidation flips into a sudden DI jump.
Anchors a line at the event bar’s open and auto-terminates upon first touch/cross (tick-size tolerance).
Auto-selects up to three higher timeframes suited to your chart resolution and prints non-overlapping lines with labels like 1H / 4H / 1D. Lower-priority duplicates are suppressed to reduce clutter.
Confirmation / repaint notes
Signals and lines finalize on bar close of the relevant timeframe.
HTF elements update only on the HTF bar close. During a forming bar they may appear transiently.
Line removal finalizes after the bar that produced the touch/cross closes.
Visual cues & effects
Oscillator candles: Open/High = long smoothing; Low/Close = short smoothing (no wicks).
Adaptive bands: Midline ± StdDev Multiplier × stdev of the blended series.
Consolidation tint: Optional white backdrop/candles when the consolidation condition is true (balance + low ADX).
Breakout VFX (optional): With strong DI/ADX and Bollinger breaks, renders a subtle “fire” flare above upper-band thrusts or “ice” shelf below lower-band thrusts.
Inputs (high-level)
Visual Style: Oscillator or ADX.
General (Oscillator): Lookback Period, Short/Long Smoothing, Standard Deviation Multiplier.
Color (Oscillator): Oversold/Overbought colors for gradient endpoints.
Plot (Oscillator): Show Candles, Show Slow MA Line, Show Individual Component (RSI/MACD/BB/Stoch/ATR).
Table (Oscillator): Show Information Table & position (compact dashboard of component values + status).
ADX / Gaps / VFX (both modes): ADX High Threshold, Highlight Backgrounds, Show Gap Labels, Visual Overlay Effects, and color choices for current-TF & HTF lines.
HTF selection: Automatic ladder (3 tiers) based on your chart timeframe.
Alerts (built-in)
Buy Signal – Primary: Oscillator exits oversold.
Sell Signal – Primary: Oscillator exits overbought.
Gap Fill Line Created (Any TF)
Gap Fill Line Terminated (Any TF)
ADX Crossed ABOVE/BELOW Low Threshold
ADX Crossed ABOVE/BELOW High Threshold
Consolidation Started
Alerts evaluate on the close of the relevant timeframe.
How to read it (quick guide)
Pick your lens: Oscillator for blended momentum around an adaptive midline; ADX for trend strength and DI skew.
Watch extremes & mean re-entries (Oscillator): Approaches to the top/bottom band show persistent momentum; returns toward the midline show normalization.
Check regime (ADX): Below Low = low-trend; above High = strong trend, with “fire/ice” bias toward +DI/–DI.
Track gap lines: Fresh labels mark new reference levels; lines auto-remove on first interaction. HTF lines add context but finalize only on HTF close.
The uniqueness from this indicator comes from multiple areas:
1. A unique multi-timeframe algorithm detects gap fill zones and plots them on the chart.
2. Visual effects for both visual modes were hand crafted to provide a visually stunning and intuitive interface.
3. The algorithm to determine sentiment uses a unique blend of weight and sensitivity adjustment to create a plot with elastic upper and lower bounds based off historical volatility and price action.

Chartlense Dashboard (Data, Trend & Levels)Chartlense Dashboard (Data, Trend & Levels)
Overview
This dashboard is designed to solve two common problems for traders: chart clutter and the manual drawing of support and resistance levels . It consolidates critical data from multiple indicators into a clean table overlay and automatically plots the most relevant S&R levels based on recent price action. The primary goal is to provide a clear, at-a-glance overview of the market's structure and data.
It offers both a vertical and horizontal layout to fit any trader's workspace.
Key Concepts & Calculations Explained
This indicator is more than a simple collection of values; it synthesizes data to provide unique insights. Here’s a conceptual look at how its core components work:
Automatic Support & Resistance (Pivot-Based):
The dashed support (green) and resistance (red) lines are not manually drawn. They are dynamically calculated based on the most recent confirmed pivot highs and pivot lows . A pivot is a foundational concept in technical analysis that identifies potential turning points in price action.
How it works: A pivot high is a candle whose `high` is higher than a specific number of candles to its left and right (the "Pivot Lookback" is set to 5 by default in the settings). A pivot low is the inverse. By automatically identifying these confirmed structural points, the script visualizes the most relevant levels of potential supply and demand on the chart.
Relative Volume (RVOL):
This value in the table is not the standard volume. It measures the current bar's volume against its recent average (specifically, `current volume / 10-period simple moving average of volume`).
Interpretation: A reading above 2.0 (indicated by green text) suggests that the current volume is more than double the recent average. This technique is used to identify significant volume spikes, which can add conviction to breakouts or signal potential market climaxes.
Consolidated Data for Context:
Other values displayed in the table, such as the EMAs (9, 20, 200) , Bollinger Bands (20, 2) , RSI (14) , MACD (12, 26, 9) , and VWAP (on intraday charts), use their standard industry calculations. They are included to provide a complete contextual picture without needing to load each indicator separately, saving valuable chart space.
How to Use This in Your Trading
This dashboard is designed as a tool for confluence and context , not as a standalone signal generator. Here are some ways to integrate it into your analysis workflow:
As a Trend Filter: Before considering a trade, quickly glance at the EMAs and the MACD values in the table. A price above the key EMAs and a positive MACD can serve as a quick confirmation that you are aligned with the dominant trend.
To Validate Breakouts: When the price is approaching a key Resistance level (red pivot line), watch the RVOL value . A reading above 2.0 on the breakout candle adds significant confirmation that the move is backed by strong interest. The same logic applies to breakdowns below a support level.
To Spot Potential Reversals: Confluence is key. For example, if the price is testing a Support level (green pivot line) AND the RSI in the table is approaching oversold levels (e.g., near 30), it can signal a higher probability reversal setup.
About This Indicator
This indicator was developed by the team at ChartLense to help traders declutter their charts and focus on the data that matters. We believe in making complex analysis more accessible and organized. We hope this free tool is a valuable addition to your trading process.

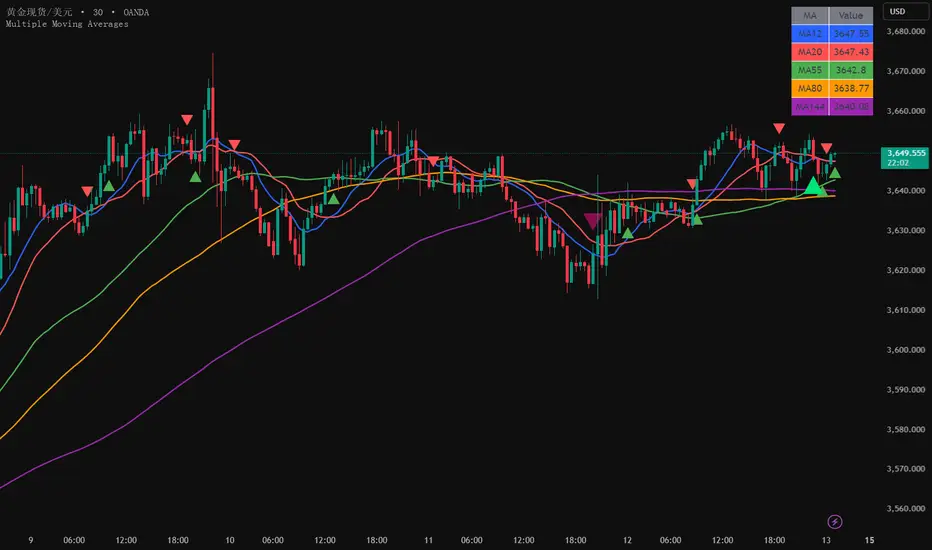
Multiple Moving Averages5 Simple Moving Averages: 12, 20, 55, 80, 144 periods
Different colors: Each moving average uses a different color for easy distinction
Crossover signals: Display crossover signals for MA12/MA20 and MA55/MA144
Value display: Show current specific values of each moving average in a table at the top right corner
Optional EMA: The commented section provides code for the EMA version, which can be uncommented if needed
Trend-Strong Candle - 3 EMAs with Filters# Trend-Strong Candle - Professional Trading Indicator
## 📊 What It Does
Identifies high-probability entries by combining triple EMA trend analysis with strong candle detection. Only signals when all conditions align for maximum accuracy.
## 🎯 Core Features
- Triple EMA System: Fast (20) / Medium (50) / Slow (200) for trend confirmation
- Strong Candle Filter: ATR-based sizing ensures genuine momentum
- Advanced Filters: EMA close validation + trend stability checks
- Live Alerts: Instant notifications for real-time signals
- Session Filter: Trade only during active EU/US market hours
## ⚡ Quick Setup
Scalping (1-5min): Default settings + enable session filter
Day Trading (15-60min): Default settings work perfectly
Swing Trading (4H+): Increase ATR multiplier to 0.8-1.0
## 📈 Trading Rules
Long Signals: Green triangle below candle
- Strong bullish candle during confirmed uptrend
- All EMAs properly aligned (Fast > Medium > Slow)
Short Signals: Red triangle above candle
- Strong bearish candle during confirmed downtrend
- All EMAs properly aligned (Fast < Medium < Slow)
## ⚠️ Critical Success Factors
1. Always Verify the Trend Yourself
The indicator helps identify signals, but YOU must confirm the larger trend context. Check higher timeframes and overall market structure before entering.
2. Understand the "Big Players"
Strong candles in trend direction usually come from institutional money (banks, funds, algorithms). These create the momentum that retail traders can follow. The indicator catches these institutional moves.
3. Distance to Next Value Level
NEVER enter if price is too close to major resistance/support levels:
- Check distance to round numbers (1.1000, 1.1050, etc.)
- Ensure at least 20-30 pips room to next key level
- You need space for profit - tight levels = limited upside
4. Risk Management
- Stop Loss: 1-2 ATR from entry
- Take Profit: 2-3 ATR target (minimum 1:2 R/R)
- Position Size: Risk max 1-2% per trade
## 💡 Pro Tips
- Best Sessions: London open (8-12 UTC) and NY open (13-17 UTC)
- Avoid: Major news, low liquidity periods, choppy markets
- Multiple Timeframes: Confirm signals on higher timeframe
- Value Levels: Always check daily/weekly support/resistance before entering
## 🎯 Success Formula
Trend Confirmation + Strong Institutional Candle + Distance to Value Levels = High Probability Trade
*
Remember: The indicator finds the signals, but successful trading requires your analysis of trend context and value level positioning. Trade smart, not just frequent.

Bias + VWAP Pullback — v4 (PA + BOS/CHOCH)Simple idea: I identify the trend (bias) from the larger timeframe, and only trade pullbacks to the VWAP/EMA during liquidity (London/New York). When the trend is clear, gold moves strongly, and its pullbacks to the balance lines provide clear opportunities.
Timeframe and Sessions (Cairo Time)
Analysis: H1 to determine the trend.
Implementation: 5m (or 1m if professional).
Trading window:
London Opening: 10:00–12:30
New York Opening: 16:30–19:00
(avoid the rest of the day unless there is exceptional traffic).
Direction determination (BIAS)
On H1:
If the price is above the 200 EMA and the daily VWAP is bullish and the price is above it → uptrend (long-only).
If the price is below the 200 EMA and the daily VWAP is bearish and the price is below it → bearish trend (short-only).
Determine your levels: yesterday's high/low (PDH/PDL) + approximate Asia range (03:00–09:30).
Entry Rules (Setup A: Trend Continuation)
Asia range breakout towards Bias during liquidity window.
Wait for a withdrawal to:
Daily VWAP, or
EMA50 on 5m frame (best if both cross).
Confirmation: Confirmation low/high on 5m (HL buy/LH sell) + clear impulse candle (Body is greater than average of last 10 candles).
Entry:
Buy: When the price returns above VWAP/EMA50 with a confirmation candle close.
Sell: The exact opposite.
Stop Loss (SL): Below/above the last confirmation low/high or ATR(14, 5m) x 1.5 (largest).
Objectives:
TP1 = 1R (Close 50% and move the rest Break-even).
TP2 = 2.5R to 3R or at an important HTF level (PDH/PDL/Bid/Demand Zone).
Entry Rules (Setup B: Reversion to VWAP – “Mean Reversion”)
Use with extreme caution, once daily maximum:
Price deviation from VWAP by more than ~1.5 x ATR(14, 5m) with rejection candles appearing near PDH/PDL.
Reverse entry towards the return of VWAP.
SL small behind rejection top/bottom.
Main target: VWAP. (Don't get greedy — this scenario is for extended periods only.)
News Filtering and Risk Management
Avoid trading 15–30 minutes before/after strong US news (CPI, NFP, FOMC).
Maximum daily loss: 1.5–2% of account balance.
Risk per trade: 0.25–0.5% (if you are learning) or 0.5–1% (if you are experienced).
Do not exceed two consecutive losing trades per day.
Don't chase the market after the opportunity has passed — wait for the next pullback.
Smart Deal Management
After TP1: Move stop to entry point + trail the rest with EMA20 on 5m or ATR Trailing = ATR(14)×1.0.
If the price touches a strong daily level (PDH/PDL) and fails to break, consider taking additional profit.
If VWAP starts to flatten and breaks against the trend on H1, stop trading for the day.
Quick Checklist (Before Entry)
H1 trend is clear and consistent with 200EMA + VWAP.
Penetrating the Asia range towards Bias.
Clean pull to VWAP/EMA50 on 5m.
Confirmation candle and real push.
SL is logical (behind swing/ATR×1.5) and R :R ≥ 1:2.
No red news coming soon.
Example of "ready-made" settings
EMA: 20, 50, 200 on 5m, 200 only on H1.
VWAP: Daily (reset daily).
ATR: 14 on 5m.
Levels: PDH/PDL + Asia Band (03:00–09:30 Cairo).
Gold Notes
Gold is fast and sharp at the open; don't get in early — wait for the draw.
Fakeouts are common before news: it is best to call with the trend after the price returns above/below VWAP.
Don't expect 80% consistent wins every day — the advantage comes from discipline, filtering out bad days, and only withdrawing when you're on the right track.
تعتبر شركة الماسة الألمانية أحد المؤسسات العاملة بالمملكة العربية السعودية ولها تاريخ طويل من الخدمات الكثيرة والمتنوعة التى مازالت تقدمها للكثير من العملاء داخل جميع مدن وأحياء المملكة حيث نقدم أفضل ما لدينا من خلال مجموعة الشركات التالية والتي من خلالها ستتلقي كل ما تحتاج إلية في كل المجال المختلفة فنحن نعمل منذ عام 2015 ولنا سابقات اعمال فى مختلف المجالات الحيوية التى نخدم من خلالها عملائنا ونوفر لهم أرخص الأسعار وبأعلى جودة من الممكن توفرها فى المجالات التالية :-
خدمات تنظيف المنازل والفلل والشقق
خدمات عزل الخزانات تنظيف غسيل صيانة اصلاح
خدمات جلي البلاط والرخام والسيراميك
خدمات نقل العفش عمالة فلبينية مدربة
خدمات مكافحة الحشرات بجدة
كل هذة الخدمات وأكثر نوفرها لكل المتعاقدين بأفضل الطرق مع توفير خطط وبرامج متنوعة لأتمام العمل المسنود إلينا بأفضل وأحدث الطرق الحديثة والعصرية سواء فى شركات النظافة بجدة ومكة المكرمة أو شركات نقل العفش بجدة عمالة فلبينية وباقى الخدمات مثل جلي وتلميع الرخام بمكة وجدة ولا ننسي شركة مكافحة حشرات بجدة التى ساعدت آلاف المواطنين على تنظيف منازلهم من الحشرات بأفضل مبيدات حشرية.

ICT Largest Midnight–00:30 FVG (NY, 1 per day) — FIXEDmarks out the first and largest fvg on the 1 min chart from midnight open until 12:30 am est

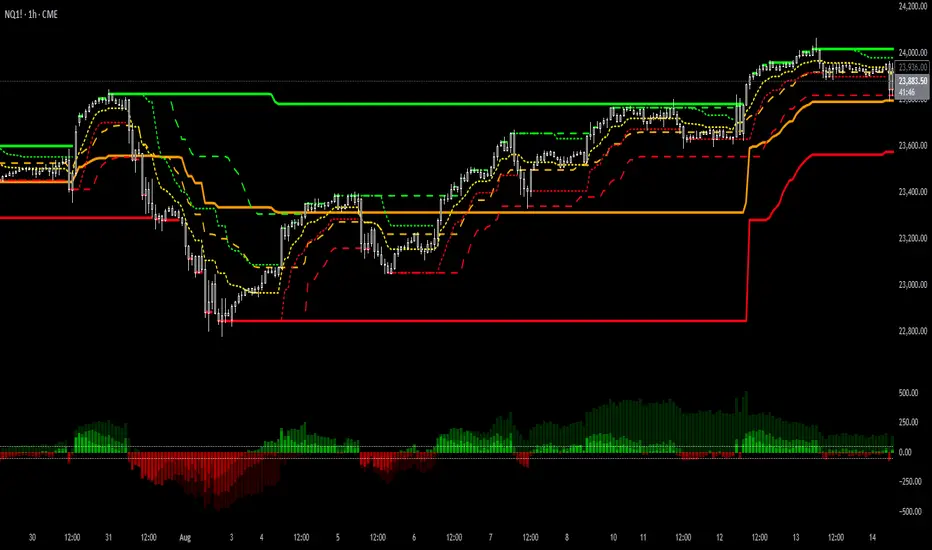
Key Levels: Daily, Weekly, Monthly [BackQuant]Key Levels: Daily, Weekly, Monthly
Map the market’s “memory” in one glance—yesterday’s range, this week’s chosen day high/low, and D/W/M opens—then auto-clean levels once they break.
What it does
This tool plots three families of high-signal reference lines and keeps them tidy as price evolves:
Chosen Day High/Low (per week) — Pick a weekday (e.g., Monday). For each past week, the script records that day’s session high and low and projects them forward for a configurable number of bars. These act like “memory levels” that price often revisits.
Daily / Weekly / Monthly Opens — Plots the opening price of each new day, week, and month with separate styling. These opens frequently behave like magnets/flip lines intraday and anchors for regime on higher timeframes.
Auto-pruning — When price breaks a stored level, the script can automatically remove it to reduce clutter and refocus you on still-active lines. See: (broken levels removed).
Why these levels matter
Liquidity pockets — Prior day’s high/low and the daily open concentrate stops and pending orders. Mapping them quickly reveals likely sweep or fade zones. Example: previous day highs + daily open highlighting liquidity:
Context & regime — Monthly opens frame macro bias; trading above a rising cluster of monthly opens vs. below gives a clean top-down read. Example: monthly-only “macro outlook” view:
Cleaner charts — Auto-remove broken lines so you focus on what still matters right now.
What it plots (at a glance)
Past Chosen Day High/Low for up to N prior weeks (your choice), extended right.
Current Daily Open , Weekly Open , and Monthly Open , each with its own color, label, and forward extension.
Optional short labels (e.g., “Mon High”) or full labels (with week/month info).
How breaks are detected & cleaned
You control both the evidence and the timing of a “break”:
Break uses — Choose Close (more conservative) or Wick (more sensitive).
Inclusive? — If enabled, equality counts (≥ high or ≤ low). If disabled, you need a strict cross.
Allow intraday breaks? — If on, a level can break during the tracked day; if off, the script only counts breaks after the session completes.
Remove Broken Levels — When a break is confirmed, the line/label is deleted automatically. (See the demo: )
Quick start
Pick a Day of Week to Track (e.g., Monday).
Set how many weeks back to show (e.g., 8–10).
Choose how far to extend each family (bars to the right for chosen-day H/L and D/W/M opens).
Decide if a break uses Close or Wick , and whether equality counts.
Toggle Remove Broken Levels to keep the chart clean automatically.
Tips by use-case
Intraday bias — Watch the Daily Open as a magnet/flip. If price gaps above and holds, pullbacks to the daily open often decide direction. Pair with last day’s high/low for sweep→reversal or true breakout cues. See:
Weekly structure — Track the week’s chosen day (e.g., Monday) high/low across prior weeks. If price stalls near a cluster of old “Monday Highs,” look for sweep/reject patterns or continuation on reclaim.
Macro regime — Hide daily/weekly lines and keep only Monthly Opens to read bigger cycles at a glance (BTC/crypto especially). Example:
Customization
Use wicks or bodies for highs/lows (wicks capture extremes; bodies are stricter).
Line style & thickness — solid/dashed/dotted, width 1–5, plus global transparency.
Labels — Abbreviated (“Mon High”, “D Open”) or full (month/week/day info).
Color scheme — Separate colors for highs, lows, and each of D/W/M opens.
Capacity controls — Set how many daily/weekly/monthly opens and how many weeks of chosen-day H/L to keep visible.
What’s under the hood
On your selected weekday, the script records that session’s true high and true low (using wicks or body-based extremes—your choice), then projects a horizontal line forward for the next bars.
At each new day/week/month , it records the opening price and projects that line forward as well.
Each bar, the script checks your “break” rules; once broken, lines/labels are removed if auto-cleaning is on.
Everything updates in real time; past levels don’t repaint after the session finishes.
Recommended presets
Day trading — Weeks back: 6–10; extend D/W opens: 50–100 bars; Break uses: Close ; Inclusive: off; Auto-remove: on.
Swing — Fewer daily opens, more weekly opens (2–6), and 8–12 weeks of chosen-day H/L.
Macro — Show only Monthly Opens (1–6 months), dashed style, thicker lines for clarity.
Reading the examples
Broken lines disappear — decluttering in action:
Macro outlook — monthly opens as cycle rails:
Liquidity map — previous day highs + daily open:
Final note
These are not “signals”—they’re reference points that many participants watch. By standardising how you draw them and automatically clearing the ones that no longer matter, you turn a noisy chart into a focused map: where liquidity likely sits, where price memory lives, and which lines are still in play.

Table Logic ExtractorTable Logic Extractor v2.0
Advanced multi-timeframe analysis with intelligent trade recommendations!
Overview:
This sophisticated indicator provides comprehensive market analysis through multiple technical indicators and timeframes. It combines EMA analysis, RSI momentum, MACD signals, Bollinger Bands, volume analysis, divergence detection, and intelligent trade recommendations with support/resistance distance calculations and trading style detection.
Key Features:
✅ Multi-Indicator Analysis - EMA, RSI, MACD, Bollinger Bands, Volume, ATR
✅ Multi-Timeframe Analysis - M1, M5, M15, M30 trend comparison
✅ Divergence Detection - Bullish and bearish divergence with strength calculation
✅ Support/Resistance Analysis - Distance calculations with Fibonacci levels
✅ Trading Style Detection - Trend, Range, Breakout, Scalping identification
✅ Intelligent Trade Signals - Style-based trade recommendations with confidence levels
✅ Risk Management - Stop Loss and Take Profit calculations
✅ Comprehensive Table - Real-time analysis with 14 different metrics
How It Works:
The indicator uses advanced analysis:
• Multi-Timeframe - M1, M5, M15, M30 trend analysis
• Style Detection - Automatic trading style identification
• S/R Analysis - Fibonacci-based support/resistance levels
• Weighted Scoring - EMA (2.0), RSI (1.5), MACD (1.5), BB (1.0), Volume (1.0)
• Intelligent Signals - Style-based trade recommendations
Trading Style Detection:
• TREND TRADING - Strong trend + aligned timeframes (Green)
• RANGE TRADING - Low volatility + sideways movement (Yellow)
• BREAKOUT TRADING - High volume + near levels (Orange)
• SCALPING - High volatility + quick moves (Red)
Information Table (14 Metrics):
Real-time display showing:
• ATR volatility with signal (HIGH/MED/LOW/NORMAL VOL)
• Divergence status with strength percentage
• S/R Distance with Fibonacci levels
• Stop Loss (2.0:1 ratio) and Take Profit 1 (1.5:1 ratio)
• Multi-Timeframe analysis (M1, M5, M15, M30)
• Scalping signals with confidence levels
• Current trend with strength percentage
• Intelligent trade recommendations
Trade Recommendations:
• TREND BUY/SELL - All timeframes aligned (High confidence)
• SHORT-TERM BUY/SELL - M5 signal only (Medium confidence)
• SCALPING BUY/SELL - M5 vs higher timeframes (Low confidence)
• WAIT - No clear signal (No confidence)
Support/Resistance Analysis:
• Fibonacci Levels: 23.6%, 38.2%, 50% retracements
• Distance Categories: Very Near (Red), Near (Orange), Medium (Yellow), Far (Green)
• ATR-based distance measurement
• Real-time proximity alerts
Scalping Detection:
Specialized signals based on:
• High volatility (ATR ratio > 1.5)
• Quick price moves (fast momentum)
• Volume confirmation (high volume spikes)
• RSI extremes (oversold/overbought)
Settings:
• EMA - Fast (9), Slow (21), Trend (50)
• RSI - Length (14), Overbought (70), Oversold (30)
• MACD - Fast (12), Slow (26), Signal (9)
• Bollinger Bands - Length (20), Multiplier (2.0)
• ATR - Length (14) for volatility measurement
• Volume Threshold - 1.5x average volume
• Divergence - Lookback (3), Threshold (0.5)
Best Practices:
🎯 Adapt strategy to detected trading style
📊 Use multi-timeframe analysis for confirmation
⚡ Monitor S/R distances for entry timing
🛡️ Always use calculated Stop Loss levels
🔍 Watch for divergence signals
📈 Follow intelligent trade recommendations
Pro Tips:
• Table provides all essential information in one place
• Trading style detection helps adapt your strategy
• S/R distance shows proximity to key levels
• Confidence levels indicate signal reliability
• Multi-timeframe alignment increases success rate
• Scalping signals work best in high volatility
Alerts:
• Trend Change Alert - "Trend changed across timeframes"
• Divergence Alert - "Divergence detected"
• Scalping Alert - "Scalping opportunity"
• Trade Signal Alert - "Trade recommendation available"
Version 2.0 Improvements:
• Advanced multi-timeframe analysis (M1, M5, M15, M30)
• Intelligent trading style detection
• Comprehensive support/resistance analysis
• Professional trade recommendations with confidence levels
• Scalping detection with specialized signals
• Risk management with calculated SL/TP levels
• 14-metric comprehensive information table
Created with ❤️ for the trading community
This indicator is free to use for both commercial and non-commercial purposes.

Complexity v3.2Complex Trend Analyzer v6.1 v3.2
Advanced multi-indicator trend analysis with dynamic timeframe adaptation!
Overview:
This sophisticated indicator combines multiple technical analysis tools for comprehensive trend analysis. It features EMA crossovers, RSI momentum, MACD signals, Bollinger Bands, volume analysis, divergence detection, and multi-timeframe analysis with dynamic parameter adaptation based on market volatility.
Key Features:
✅ Multi-Indicator Analysis - EMA, RSI, MACD, Bollinger Bands, Volume, ATR
✅ Divergence Detection - Bullish and bearish divergence with strength calculation
✅ Dynamic Timeframe Adaptation - Parameters adjust automatically based on timeframe
✅ Trend Tracking - Complete trend lifecycle with BUY/SELL/END signals
✅ Multi-Timeframe Analysis - M5, M15, M30 trend comparison
✅ Risk Management - Volatility filtering and warning system
✅ Visual Clarity - Clean labels, trend lines, and information table
How It Works:
The indicator uses a weighted scoring system:
• EMA (2.0) - Primary trend direction
• RSI (1.5) - Momentum confirmation
• MACD (1.5) - Trend momentum
• Bollinger Bands (1.0) - Volatility context
• Volume (1.0) - Volume confirmation
• Price Action (0.5 each) - Higher highs/lows
Signal Logic:
• BUY - Weighted score > threshold + filters passed
• SELL - Weighted score > threshold + filters passed
• END - Trend reversal conditions met
Visual Elements:
• 🟢 BUY - Green label with trend tracking
• 🔴 SELL - Red label with trend tracking
• ⚫ END - Gray label marking trend end
• × BUY - Green crosses for bullish divergence
• × SELL - Red crosses for bearish divergence
• ⚠️ - Warning signals for trend reversals
Information Table:
Real-time display showing:
• ATR volatility with signal (HIGH/MED/LOW/NORMAL VOL)
• Divergence status with strength percentage
• BUY/SELL signal count and overall signal
• Multi-Timeframe analysis (M5, M15, M30)
• Current trend with strength percentage
• Detailed trend strength analysis
Dynamic Adaptation:
Parameters automatically adjust based on timeframe:
• M1 - Fastest reaction (1.5-7.5 bars)
• M3 - Quick response (2-10 bars)
• M5 - Standard setting (3-15 bars)
• M15 - Slower, more reliable (4-20 bars)
Settings:
• EMA - Fast (9), Slow (21), Trend (50)
• RSI - Length (14), Overbought (70), Oversold (30)
• MACD - Fast (12), Slow (26), Signal (9)
• Bollinger Bands - Length (20), Multiplier (2.0)
• ATR - Length (14) for volatility measurement
• Volume Threshold - 1.5x average volume
Best Practices:
🎯 Works best in trending markets
📊 Use as overlay on main chart
⚡ Combine with price action analysis
🛡️ Always use proper risk management
🔍 Watch for divergence signals
⚠️ Pay attention to warning signals
Pro Tips:
• Green background = Strong uptrend, Red background = Strong downtrend
• Orange background = Risk zone (high volatility/RSI extremes)
• × marks indicate divergence opportunities
• ⚠️ warnings signal potential trend reversals
• Use multi-timeframe analysis for confirmation
• Monitor the information table for comprehensive market view
Alerts:
• BUY Alert - "BUY signal detected"
• SELL Alert - "SELL signal detected"
• Divergence Alert - "Divergence detected"
• Warning Alert - "Trend warning"
Version 3.2 Improvements:
• Enhanced multi-indicator analysis
• Improved divergence detection with strength calculation
• Advanced dynamic timeframe adaptation
• Comprehensive risk management system
• Professional visual presentation
• Weighted scoring system for better accuracy
Created with ❤️ for the trading community
This indicator is free to use for both commercial and non-commercial purposes.

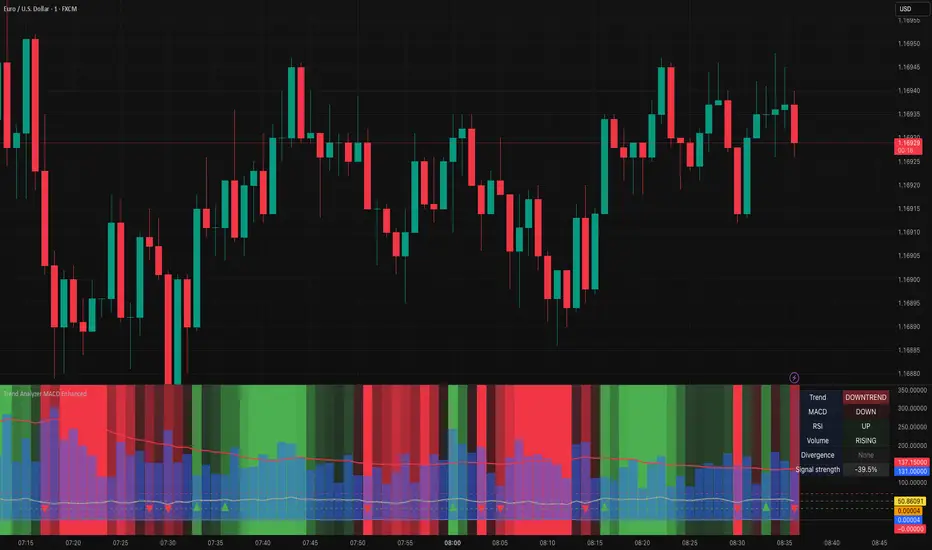
Trend Analyzer MACD EnhancedTrend Analyzer MACD Enhanced
Advanced trend analysis with MACD, RSI, Volume and Divergence detection!
Overview
This comprehensive indicator combines multiple technical analysis tools into one powerful visualization. It features dynamic background coloring, real-time signal strength calculation, and automatic divergence detection for complete market analysis.
Key Features
✅ Multi-Indicator Analysis- MACD, RSI, and Volume in one indicator
✅ Divergence Detection - Automatic bullish and bearish divergence identification
✅ Dynamic Background - Color-coded trend zones with smooth transitions
✅ Signal Strength - Weighted calculation showing overall market sentiment (0-100%)
✅ Trend Change Detection - Visual markers for trend reversals
✅ Information Table - Real-time status of all indicators
How It Works
The indicator calculates signal strength using weighted analysis:
- MACD (50%) - Primary trend momentum
- RSI (30%) - Overbought/oversold conditions
- Volume (20%) - Volume confirmation
Signal Strength Range: -100% to +100%
Visual Elements
Background Colors:
- 🟢 **Green** - Uptrend (intensity based on signal strength)
- 🔴 **Red** - Downtrend (intensity based on signal strength)
- ⚪ **Gray** - Neutral/sideways market
Trend Markers:
- 🔺 **Green Triangle Up** - Start of new uptrend
- 🔻 **Red Triangle Down** - Start of new downtrend
- 📏 **Vertical Lines** - Trend change confirmation
Information Table
Real-time display showing:
- Trend - Current trend state with color coding
- MACD - Direction and crossover status
- RSI - Level and overbought/oversold status
- Volume - Level and trend direction
- Divergence - Current divergence status
- Signal Strength - Overall percentage
Alerts
Built-in alerts for:
- Strong Buy/Sell Signals - High probability setups
- Divergence Signals - Early reversal warnings
Settings
MACD:Fast (12), Slow (26), Signal (9)
RSI:Length (14), Overbought (70), Oversold (30)
Volume:MA Length (20), Threshold (1.5x)
Display:Toggle RSI, Volume, and Table visibility
Best Practices
🎯 Works best in trending markets
📊 Use in separate window below main chart
⚡ Combine with price action analysis
🛡️ Always use proper risk management
Pro Tips
- Green background = Strong uptrend, Red background = Strong downtrend
- Signal strength > 50% = Very bullish, < -50% = Very bearish
- Watch for divergence signals for early reversal warnings
- Use the information table for quick market assessment
---
Created with ❤️ for the trading community
This indicator is free to use for both commercial and non-commercial purposes.
Supertrend Channel Histogram OscillatorThis histogram is based on the script "Supertrend Channels "
The idea of the indicator is to visually represent the interaction of price with several different supertrend channels of various lengths in an oscillator in order to make it much more clear to the trader how the longer trends are interacting with shorter trends of the price movement of an asset. I got this idea from the "Kurutoga Cloud" and "Kurutoga Histogram" by D7R which is based on the centerlines of 3 Donchian Channels, however after I started using the Supertrend Channel by LuxAlgo I found that it was a more reliable price range channel than a standard Donchian Channel and I made this indicator to accompany it.
This indicator plots a positive value above 0 when the price is above the centerline of the supertrend channel and a negative value below 0 when the price is below the centerline.
The first supertrend's length and multiple can be adjusted in the settings.
The given supertrend input is then doubled and quadrupled in both length and multiplication so that a supertrend histogram with the values of 3, 3 will be accompanied by 2 additional supertrend histograms with the values of 6, 6 and 12, 12.
The larger price trend histograms are clearly visible behind the short term supertrend channel's histogram, giving traders a balanced view of short and long term trends interacting. The less visible columns of the larger trend remain above or below the 0 line behind the more visible short term channel trend, helping to spot pullbacks within a larger trend.
Additionally, when the 3 separate histograms are all positive or all negative but the histogram columns are separating from each other this can indicate a potential trend exhaustion leading to reversal or pullback about to happen.
The overbought and oversold lines at 50 and -50 are representative primarily of the short term trend with above 50 or below -50 indicating that the price is pushing the boundary and potentially beginning a new short term supertrend in the opposite direction. If values do not noticably exceed these levels, then the current short term trend movement can be viewed as a pullback within a larger trend, with continuation potentially to follow.
I have had troubles converting the original code to v6 so this will be published here in v5 of pinescript to be used in conjunction with the original. I was intending to create a companion indicator for this oscillator that represents 3 supertrends with corresponding 2x and 4x calculations based on LuxAlgo's script, but I can't seem to get it to work correctly in v5.
For best visualization of the trends 3 LuxAlgo Supertrend channels with 2x and 4x values should be used in conjunction with each other to fully visualize the histogram.
Used in conjunction with other indicators this can be a very effective strategy to capture larger trend moves and pullbacks within trends, as well as warn of potential price trend exhaustion.
Penguin Volatility State StrategyThe Penguin Volatility State Strategy is a comprehensive technical analysis framework designed to identify the underlying "state" or "regime" of the market. Instead of just providing simple buy or sell signals, its primary goal is to classify the market into one of four distinct states by combining trend, momentum, and volatility analysis.
The core idea is to trade only when these three elements align, focusing on periods of volatility expansion (a "squeeze breakout") that occur in the direction of a confirmed trend and are supported by strong momentum.
Key Components
The strategy is built upon two main engines
The Volatility Engine (Bollinger Bands vs. Keltner Channels)
This engine detects periods of rapidly increasing volatility. It measures the percentage difference (diff) between the upper bands of Bollinger Bands (which are based on standard deviation) and Keltner Channels (based on Average True Range). During a volatility "squeeze," both bands are close. When price breaks out, the Bollinger Band expands much faster than the Keltner Channel, causing the diff value to become positive. A positive diff signals a volatility breakout, which is the moment the strategy becomes active.
The Trend & Momentum Engine (Multi-EMA System)
This engine determines the market's direction and strength. It uses:
A Fast EMA (e.g., 12-period) and a Slow EMA (e.g., 26-period): The crossover of these two moving averages defines the primary, underlying trend (similar to a MACD).
An Ultra-Fast EMA (e.g., 2-period of ohlc4): This is used to measure the immediate, short-term momentum of the price.
The Four Market States
By combining the Trend and Momentum engines, the strategy categorizes the market into four visually distinct states, represented by the chart's background color. This is the most crucial aspect of the system.
💚 Green State: Strong Bullish
The primary trend is UP (Fast EMA > Slow EMA) AND the immediate momentum is STRONG (Price > Fast EMA).
Interpretation: This represents a healthy, robust uptrend where both the underlying trend and short-term price action are aligned. It is considered the safest condition for taking long positions.
❤️ Red State: Strong Bearish
Condition: The primary trend is DOWN (Fast EMA < Slow EMA) AND the immediate momentum is WEAK (Price < Fast EMA).
Interpretation: This represents a strong, confirmed downtrend. It is considered the safest condition for taking short positions.
💛 Yellow State: Weakening Bullish / Pullback
Condition: The primary trend is UP (Fast EMA > Slow EMA) BUT the immediate momentum is WEAK (Price < Fast EMA).
Interpretation: This is a critical warning signal for bulls. While the larger trend is still up, the short-term price action is showing weakness. This could be a minor pullback, a period of consolidation, or the very beginning of a trend reversal. Caution is advised.
💙 Blue State: Weakening Bearish / Relief Rally
Condition: The primary trend is DOWN (Fast EMA < Slow EMA) BUT the immediate momentum is STRONG (Price > Fast EMA).
Interpretation: This signals that a downtrend is losing steam. It often represents a short-covering rally (a "bear market rally") or the first potential sign of a market bottom. Bears should be cautious and consider taking profits.
How the Strategy Functions
The strategy uses these four states as its foundation for making trading decisions. The entry and exit arrows (Long, Short, Close) are generated based on a set of rules that can be customized by the user. For instance, a trader can configure the strategy to
Only take long trades during the Green State.
Require a confirmed volatility breakout (diff > 0) before entering a trade.
Use the "RSI on Diff" indicator to ensure that the breakout is supported by accelerating momentum.
Summary
In essence, the Penguin Volatility State Strategy provides a powerful "dashboard" for viewing the market. It moves beyond simple indicators to offer a contextual understanding of price action. By waiting for the alignment of Trend (the State), Volatility (the Breakout), and Momentum (the Acceleration), it helps traders to identify higher-probability setups and, just as importantly, to know when it is better to stay out of the market.
License / disclaimer
© waranyu.trkm — MIT License. Educational use only; not financial advice.

Gann Fan Strategy [KedarArc Quant]Description
A single-concept, rule-based strategy that trades around a programmatic Gann Fan.
It anchors to a swing (or a manual point), builds 1×1 and related fan lines numerically, and triggers entries when price interacts with the 1×1 (breakout or bounce). Management is done entirely with the fan structure (next/previous line) plus optional ATR trailing.
What TV indicators are used
* Pivots: `ta.pivothigh/ta.pivotlow` to confirm swing highs/lows for anchor selection.
* ATR: `ta.atr` only to scale the 1×1 slope (optional) and for an optional trailing stop.
* EMA: `ta.ema` as a trend filter (e.g., only long above the EMA, short below).
No RSI/MACD/Stoch/Heikin/etc. The logic is one coherent framework: Gann price–time geometry, with ATR as a scale and EMA as a risk filter.
How it works
1. Anchor
* Auto: chooses the most recent *confirmed* pivot (you control Left/Right).
* Manual: set a price and bar index and the fan will hold that point (no re-anchoring).
* Optional Re-anchor when a newer pivot confirms.
2. 1×1 Slope (numeric, not cosmetic)
* ATR mode: `1×1 = ATR(Length) × Multiplier` (adapts to volatility).
* Fixed mode: `ticks per bar` (constant slope).
Because slope is numeric, it doesn’t change with chart zoom, unlike the drawing tool.
3. Fan Lines
Builds classic ratios around the 1×1: 1/8, 1/4, 1/3, 1/2, 1/1, 2/1, 3/1, 4/1, 8/1.
4. Signals
* Breakout: cross of price over/under the 1×1 in the EMA-aligned direction.
* Bounce (optional): touch + reversal across the 1×1 to reduce whipsaw.
5. Exits & Risk
* Take-profit at the next fan line; Stop at the previous fan line.
* If a level is missing (right after re-anchor), a fallback Risk-Reward (RR) is used.
* Optional ATR trailing stop.
Why this is unique
* True numeric fan: The 1×1 slope is calculated from ATR or fixed ticks—not from screen geometry—so it is scale-invariant and reproducible across users/timeframes.
* Deterministic anchor logic: Uses confirmed pivots (with your L/R settings). No look-ahead; anchors update only when the right bars complete.
* Fan-native trade management: Both entries and exits come from the fan structure itself (with a minimal ATR/EMA assist), keeping the method pure.
* Two entry archetypes: Breakout for momentum days; Bounce for range days—switchable without changing the core model.
* Manual mode: Lock a session’s bias by anchoring to a chosen swing (e.g., day’s first major low/high) and keep the fan constant all day.
Inputs (quick guide)
* Auto Anchor (Left/Right): pivot sensitivity. Higher values = fewer, stronger anchors.
* Re-anchor: refresh to newer pivots as they confirm.
* Manual Anchor Price / Bar Index: fixes the fan (turn Auto off).
* Scale 1×1 by ATR: on = adaptive; off = use ticks per bar.
* ATR Length / ATR Multiplier: controls adaptive slope; start around 14 / 0.25–0.35.
* Ticks per bar: exact fixed slope (match a hand-drawn fan by computing slope ÷ mintick).
* EMA Trend Filter: e.g., 50–100; trades only in EMA direction.
* Use Bounce: require touch + reverse across 1×1 (helps in chop).
* TP/SL at fan lines; Fallback RR for missing levels; ATR Trailing Stop optional.
* Transparency/Plot EMA: visual preferences.
Tips
* Range days: larger pivots (L/R 8–12), Bounce ON, ATR Multiplier \~0.30–0.40, EMA 100.
* Trend days: L/R 5–6, Breakout, Multiplier \~0.20–0.30, EMA 50, ATR trail 1.0–1.5.
* Match the TV Gann Fan drawing: turn ATR scale OFF, set ticks per bar = `(Δprice between anchor and 1×1 target) / (bars) / mintick`.
Repainting & testing notes
* Pivots require Right bars to confirm; anchors are set after confirmation (no look-ahead).
* Signals use the current bar close with TradingView strategy mechanics; real-time vs. bar-close can differ slightly, as with any strategy.
* Re-anchoring legitimately moves the structure when new pivots confirm—by design.
⚠️ Disclaimer
This script is provided for educational purposes only.
Past performance does not guarantee future results.
Trading involves risk, and users should exercise caution and use proper risk management when applying this strategy.

Interval Highlighter with High/Low AlertsInterval Highlighter with High/Low Alerts
Overview:
This Pine Script indicator enhances chart analysis by highlighting specific time intervals and marking the highest and lowest prices within those periods. It supports three customizable modes:
Date Range: Highlight a user-defined period with background shading and plot the highest and lowest prices.
Days of the Week: Highlight specific weekdays with background colors and plot the highest and lowest prices for each day.
Intraday Interval: Highlight a specific intraday time range (e.g., 12:30 PM to 4:30 PM) with background shading and plot the highest and lowest prices within that interval.
Alerts are triggered when the price touches any of the highlighted high or low levels, providing real-time notifications for potential trading opportunities.
High and low lines extend to the right and remain visible after the interval ends. This ensures they act as actionable reference points for alerts between intervals, allowing users to monitor critical levels until a new interval of the same category forms.
Features:
Customizable Time Intervals: Define specific date ranges, weekdays, or intraday intervals to highlight on the chart.
High/Low Tracking: Automatically plots the highest and lowest prices within the defined intervals.
Real-Time Alerts: Set up alerts to notify when the price touches any of the highlighted high or low levels.
Actionable Lines: High/low lines remain visible after interval completion to serve as reference points for alerts.
Visual Enhancements: Customize background colors and line styles for each interval type.
Usage:
Apply the indicator to your chart.
Configure the desired modes (Date Range, Days of the Week, Intraday Interval) in the settings.
Customize the appearance settings to match your preferences.
Set up alerts based on the highlighted high/low levels.
Disclaimer:
This indicator is designed to assist in identifying potential areas of interest based on historical high and low levels within specified intervals. It is not intended as a standalone trading signal. Users should employ additional technical analysis tools and conduct thorough research before making trading decisions.

Plot_4_Key_LevelsBollinger Bands (upper & lower)
- computes 12-bar Bollinger Bands on the chart’s current timeframe, with a 3σ (standard-deviation) multiplier.
- computes vwap
- computes VWMA(HL2, 36)—a smoothed, volume-weighted average price—plotted as a line.

All-In-One MA Stack ScalperWhat is this Indicator?
This tool is an advanced, multi-layered breakout and trend-following indicator designed for lower timeframes. It identifies high-conviction buy and sell signals by combining moving average stacking with a suite of professional-grade filters.
How Does It Work?
A signal is generated only when ALL of the following conditions are met:
Moving Average Stack (5M Chart):
Buy: The close price is above all five moving averages (MAs: 100, 48, 36, 24, 12).
Sell: The close price is below all five MAs.
Volatility Filter (ATR):
Signals only print when the current ATR (14) is at least 80% of its 100-period average, ensuring you only trade in actively moving markets.
Candle Structure Filter:
The current candle must have a real body that is at least 35% of the candle’s total range, filtering out dojis and indecision bars.
Big Candle Filter:
The candle’s total range must be at least 40% of the current ATR, avoiding signals on minor, insignificant moves.
Volume Filter:
The current volume must be at least 80% of its 50-period average, filtering out signals during illiquid or quiet market conditions.
Minimum Distance from All MAs:
Price must be a minimum distance (20% ATR) away from each MA, confirming a clean breakout and avoiding signals in tight MA clusters or ranging markets.
RSI Momentum Filter:
Buy: RSI(14) must be greater than 55.
Sell: RSI(14) must be less than 45.
This ensures trades are only taken in the direction of momentum.
ADX Trend Filter:
ADX(14,14) must be above 20, ensuring signals only print in trending conditions (not in chop/range).
Minimum Bars Between Signals:
Only one signal per direction is allowed every 10 bars to avoid overtrading and signal clustering.
What Does This Achieve?
Reduces noise and false signals common in basic MA cross or stack systems.
Captures only strong, high-momentum, and high-conviction moves.
Helps you avoid chop, range, and news whipsaws by combining multiple market filters.
Perfect for advanced scalpers, intraday trend followers, or as a trade filter for algos/EAs.
How to Use It:
Apply to your 5-minute chart.
Green BUY signals: Only when all bullish conditions align.
Red SELL signals: Only when all bearish conditions align.
Use as a stand-alone system or as a filter for your own entries.
Recommended For:
Scalpers & intraday traders who want only the best opportunities.
EA and bot builders seeking reliable signal logic.
Manual traders seeking confirmation of high-probability breakouts.
Tip:
Adjust any of the filters (e.g., RSI/ADX thresholds, minBars, minDist) to make it more/less selective for your style or market.

MACD Positive & Negative AlertThe MACD (Moving Average Convergence Divergence) is a momentum and trend-following indicator that helps traders identify the strength and direction of a trend, spot potential reversals, and fine-tune entry/exit timing.
Core Components
- MACD Line:
The difference between the 12-period and 26-period EMA (Exponential Moving Averages). This line highlights shifts in momentum and identifies the prevailing trend direction.
- Signal Line:
A 9-period EMA of the MACD line, acting as a trigger for buy/sell signals. When the MACD line crosses above the signal line, it suggests a bullish signal; when it crosses below, it suggests a bearish one.
- Histogram:
Shows the difference between the MACD line and the signal line as a bar graph. The histogram helps traders gauge the strength of the momentum and can warn of possible reversals. A rapidly growing histogram means strengthening momentum, while a shrinking one indicates weakening momentum.
Main Uses
- Trend Identification:
A positive MACD value typically signals a bullish trend, while a negative value signals a bearish trend.
- Momentum Analysis:
Divergences between MACD and price can warn of upcoming reversals. Increasing MACD histogram bars confirm strong momentum; shrinking bars suggest consolidation or reversal.
- Signal Generation:
Crossovers between the MACD line and the signal line generate trade signals—bullish (buy) if the MACD moves above the signal, bearish (sell) if it falls below l.
Example Interpretation
- MACD Crossover:
If the MACD line crosses above the signal line, it's often considered a buy signal; a cross below is a sell signal.
- Zero Line Cross:
If the MACD histogram moves from below zero to above, this is considered a bullish momentum shift; above zero to below is a bearish move.
The MACD is most effective in trending markets and should ideally be used alongside additional indicators for robust trading decisions.
