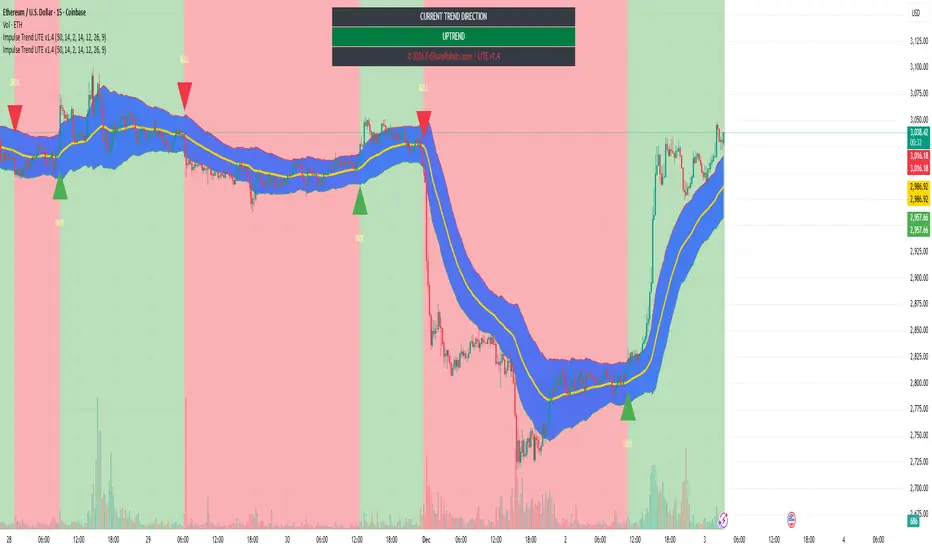
Impulse Trend Suite (LITE) — V1.4+ Plu🚀 Impulse Trend Suite (LITE) — v1.4+
Smart trend visualization with precise flip arrows. A lightweight, momentum-filtered trend tool designed to stay clean, avoid repeated signals, and keep you focused only on real market direction.
FULL PRO VERSION --> fxsharerobots.com
✨ What’s New in v1.4+
Minor upgrades mostly visual
Added Blue fill between MA lines
clearer labels
📌 Core Features
Trend flip arrows (no spam, 1 signal per turn)
Continuous background zones (gap-free trend shading)
Adaptive Baseline + ATR structure channel
RSI + MACD momentum filter (suppresses weak signals)
Trend Status Panel (UP, DOWN, NEUTRAL)
🔍 Quick Guide
BUY setup = green arrow + green background
SELL setup = red arrow + red background
Stay in the move while color doesn’t change
ATR channel helps avoid chasing overextended candles
🆚 LITE vs PRO
========================================================
Feature LITE PRO
--------------------- -------- ------------------------------
Trend shading + arrows ✔ ✔ + confirmations
Neutral trend state ✔ ✔ enhanced
Alerts ✖ ✔ full suite
Reversal Zones ✖ ✔ predictive boxes
HTF Filter ✖ ✔ smarter trend bias
Included strategies ✖ ✔ + PDF training
🔓 Upgrade to PRO
Reversal Zones • Alerts • HTF Filter • Trend Continuation Strategy
👉 FULL PRO VERSION --> fxsharerobots.com
📈 Works on Forex, Stocks, Crypto, Indices, Metals
⌚ Scalping • Intraday • Swing • Long-term
==========================================================
🌠FULL PRO VERSION --> fxsharerobots.com/impulse-trend-pro/
💾 ALL DOWNLOADS --> fxsharerobots.com/downloads/
Happy trading! — FxShareRobots Team
Signal


Impulse Trend Suite (LITE) — v1.4🚀 Impulse Trend Suite (LITE) — v1.4
Smart trend visualization with precise flip arrows. A lightweight, momentum-filtered trend tool designed to stay clean, avoid repeated signals, and keep you focused only on real market direction.
✨ What’s New in v1.4
Minor upgrades mostly visual
Added Blue fill between MA lines
clearer labels
📌 Core Features
Trend flip arrows (no spam, 1 signal per turn)
Continuous background zones (gap-free trend shading)
Adaptive Baseline + ATR structure channel
RSI + MACD momentum filter (suppresses weak signals)
Trend Status Panel (UP, DOWN, NEUTRAL)
🔍 Quick Guide
BUY setup = green arrow + green background
SELL setup = red arrow + red background
Stay in the move while color doesn’t change
ATR channel helps avoid chasing overextended candles
🆚 LITE vs PRO
Feature LITE PRO
--------------------- -------- ------------------------------
Trend shading + arrows ✔ ✔ + confirmations
Neutral trend state ✔ ✔ enhanced
Alerts ✖ ✔ full suite
Reversal Zones ✖ ✔ predictive boxes
HTF Filter ✖ ✔ smarter trend bias
Included strategies ✖ ✔ + PDF training
========================================================
🔓 Upgrade to PRO
Reversal Zones • Alerts • HTF Filter • Trend Continuation Strategy
👉 fxsharerobots.com/impulse-trend-pro/
📈 Works on Forex, Stocks, Crypto, Indices, Metals
⌚ Scalping • Intraday • Swing • Long-term
==========================================================
⚠️ LITE - Educational tool. Backtest before trading live.
Visit us for Full Trading Tools Collection here:
fxsharerobots.com/downloads/
Happy trading! — FxShareRobots Team

Impulse Trend Suite (LITE) — v1.4 source🚀 Impulse Trend Suite (LITE) — v1.4
Smart trend visualization with precise flip arrows. A lightweight, momentum-filtered trend tool designed to stay clean, avoid repeated signals, and keep you focused only on real market direction.
✨ What’s New in v1.4
Minor upgrades mostly visual
Added Blue fill between MA lines
clearer labels
📌 Core Features
Trend flip arrows (no spam, 1 signal per turn)
Continuous background zones (gap-free trend shading)
Adaptive Baseline + ATR structure channel
RSI + MACD momentum filter (suppresses weak signals)
Trend Status Panel (UP, DOWN, NEUTRAL)
🔍 Quick Guide
BUY setup = green arrow + green background
SELL setup = red arrow + red background
Stay in the move while color doesn’t change
ATR channel helps avoid chasing overextended candles
🆚 LITE vs PRO
Feature LITE PRO
--------------------- -------- ------------------------------
Trend shading + arrows ✔ ✔ + confirmations
Neutral trend state ✔ ✔ enhanced
Alerts ✖ ✔ full suite
Reversal Zones ✖ ✔ predictive boxes
HTF Filter ✖ ✔ smarter trend bias
Included strategies ✖ ✔ + PDF training
========================================================
🔓 Upgrade to PRO
Reversal Zones • Alerts • HTF Filter • Trend Continuation Strategy
👉 fxsharerobots.com/impulse-trend-pro/
📈 Works on Forex, Stocks, Crypto, Indices, Metals
⌚ Scalping • Intraday • Swing • Long-term
==========================================================
⚠️ LITE - Educational tool. Backtest before trading live.
Visit us for Full Trading Tools Collection here:
fxsharerobots.com/downloads/
Happy trading! — FxShareRobots Team
Systematic Swing Trading Model (2–10 Day)The Systematic Swing Trading Model (2–10 Day) is a simplified institutional-style trend-following system designed to capture multi-day directional moves in equities, ETFs, and crypto.
It identifies moments where a strong trend, volatility compression, and a breakout event align — creating high-probability multi-day swing opportunities.
Core Components
1. Trend Structure (20/50/200 EMA Alignment)
The model only signals long when:
Price > 20 EMA
20 EMA > 50 EMA
50 EMA > 200 EMA
This ensures that trades occur only in established uptrends, avoiding counter-trend signals and reducing drawdown.
2. Volatility Compression (Bollinger Width Squeeze)
Periods of tightening volatility often precede expansion.
The indicator detects when Bollinger Band Width drops below a threshold, signaling a coil/reset phase in the trend.
This helps avoid late entries and identifies setups before the breakout occurs.
3. Breakout Detection (High-Based Break + BB Break)
A long entry requires price to break:
Above the squeeze zone
Above short-term structure (10-bar range high)
This captures early breakout momentum and begins the 2–10 day swing window.
4. ADX Trend Strength (Wilder Method)
A custom ADX engine (based on Wilder’s original formulation) confirms when trend strength is sufficient.
This prevents signals during low-momentum periods or chop.
5. Buy/Exit Signals (Visual)
The indicator plots:
BUY labels below the bar when all conditions align
EXIT labels above the bar when trend momentum is lost
This keeps charts clean and provides actionable, minimal signals.
6. Dashboard Panel
A compact dashboard summarizes:
Trend status
Volatility condition
Breakout readiness
ADX strength
ADX value
This allows quick system checks at a glance.
Ideal Use Cases
This model is designed for:
2–10 day swing trades
Daily timeframe signals
4H chart entry refinement
Trend continuation setups
High-momentum markets
Stocks, ETFs, crypto
It is not intended for scalping or mean-reversion environments.
Recommended Timeframes
Daily (1D) → main signal chart
4H → early entry confirmation
Weekly (1W) → macro trend filter

FREE BUY SELL GOLD SCALPING 1m 3m
BUY SELL GOLD SCALPING is a dedicated tool built exclusively for gold traders working on ultra-short timeframes.
It delivers fast, clean, and easy-to-read market guidance designed specifically for XAUUSD on the 1-minute and 3-minute charts.
🔥 Why Use This Indicator?
Provides instant clarity during the fastest gold movements.
Helps you spot high-velocity opportunities in real time.
Gives you a simple visual workflow with no settings to adjust.
Designed to stay stable and responsive during rapid price swings.
Supports confident scalping by highlighting key moments of strength and exhaustion.
Removes noise and guesswork so you can stay focused on execution.
✔️ Who Is It Designed For?
Gold scalpers who need fast, decisive chart information.
Traders who prefer a plug-and-play indicator with no customization.
Anyone looking for a clean tool that enhances short-term timing.
Intraday traders who want to simplify market interpretation.
⚙️ Zero Configuration Required
All settings are fully optimized internally.
There are no inputs and nothing to tweak — simply add it to the chart and trade.
🔒 Usage Restriction
This indicator works only on:
Symbol: XAUUSD
Timeframes: 1-minute and 3-minute
If used on any other symbol or timeframe, it will not work.
⚠️ Disclaimer
No indicator can guarantee results under all market conditions.
Always use responsible risk management.

Impulse Trend Suite (LITE) — v1.3🚀 Impulse Trend Suite (LITE) — v1.3
Smart trend visualization with precise flip arrows. A lightweight, momentum-filtered trend tool designed to stay clean, avoid repeated signals, and keep you focused only on real market direction.
✨ What’s New in v1.3
Minor upgrades mostly visual
Added Blue fill between MA lines
clearer labels
📌 Core Features
Trend flip arrows (no spam, 1 signal per turn)
Continuous background zones (gap-free trend shading)
Adaptive Baseline + ATR structure channel
RSI + MACD momentum filter (suppresses weak signals)
Trend Status Panel (UP, DOWN, NEUTRAL)
🔍 Quick Guide
BUY setup = green arrow + green background
SELL setup = red arrow + red background
Stay in the move while color doesn’t change
ATR channel helps avoid chasing overextended candles
🆚 LITE vs PRO
Feature LITE PRO
--------------------- -------- ------------------------------
Trend shading + arrows ✔ ✔ + confirmations
Neutral trend state ✔ ✔ enhanced
Alerts ✖ ✔ full suite
Reversal Zones ✖ ✔ predictive boxes
HTF Filter ✖ ✔ smarter trend bias
Included strategies ✖ ✔ + PDF training
========================================================
🔓 Upgrade to PRO
Reversal Zones • Alerts • HTF Filter • Trend Continuation Strategy
👉 fxsharerobots.com/impulse-trend-pro/
📈 Works on Forex, Stocks, Crypto, Indices, Metals
⌚ Scalping • Intraday • Swing • Long-term
==========================================================
⚠️ LITE - Educational tool. Backtest before trading live.
Visit us for Full Trading Tools Collection here:
fxsharerobots.com/downloads/
Happy trading! — FxShareRobots Team

Gravestone Doji ScannerSpeaks for itself. Set it on the chart. Use Arrow Keys to move through the watchlist.

Support Line [by rukich]🟠 OVERVIEW
The indicator displays a floating line that acts as a support level. It's important to remember that any support level can be broken.
🟠 COMPONENTS
The indicator is based on the percentage difference between the closes of the n-th bar back and the current bar. The resulting percentage is smoothed to remove noise.
The indicator is displayed as a green-red line (the colors don’t carry meaning — they are used just for visual variety). When the price touches the support level, the bar background turns green.
For convenience, there is a label on the right side of the indicator showing the current value of the line.
🟠 HOW TO USE
The indicator includes several settings that can be adjusted, though optimal defaults are provided.
Settings:
Timeframe — specifies which timeframe’s data is used to calculate the line.
Candles back — specifies how many bars back from the current one are used.
The indicator should be used according to general support-zone logic. Since no support zone guarantees a price bounce, the optimal approach is to confirm the reaction after the price touches the line.
Example of use:
In the current example, the Timeframe in the indicator settings is set to 1 hour, and the currently open chart is 5 minutes. This means that on the 5-minute chart we see a 1-hour line. After the price touches the support line, you need to see a confirmation of the reaction to understand whether the support zone is holding the price.
In the examples, reaction confirmation is shown through: the formation of an M5 shift and the invalidation of an FVG M5- (the latter is more risky than the M5 shift):
🟠 CONCLUSION
The indicator shows a floating support zone, and when tested, you should confirm the reaction on a lower timeframe.

Maximus imbalance
Maximus imbalance – Indicator Description
Maximus Precision Arrows is an advanced directional signal tool designed for high-accuracy intraday trading.
It detects early BUY and SELL shifts by combining:
• Delta Imbalance Analysis
• Volume-Normalized Pressure (Buy vs Sell Power)
• Trend Confirmation (MA20 / MA50)
• Signal Strength Ratio Filtering
• Smart Gap Control to avoid over-signaling
How it works
The indicator measures real-time buying and selling pressure (Delta), normalizes it by volume, and filters it through trend direction and strength-ratio logic.
Signals only appear when there is:
• A strong directional imbalance
• Confirmed trend alignment
• Valid momentum breakout
• Enough distance from the previous signal (noise reduction)
What the arrows mean
• Green Triangle (BUY):
Strong positive delta shift + bullish imbalance + price aligned with trend.
• Red Triangle (SELL):
Strong negative delta shift + bearish imbalance + price aligned with downtrend.
Best use
• Intraday scalping (1m–15m)
• Options trading (SPX, QQQ, NVDA, AAPL, futures)
• Identifying early reversals & continuation spots
• Filtering noise during consolidation
Important notes
• Signals are filtered to avoid choppy conditions.
• Works on any market, including equities, indices, futures, and CFDs.
• Not a repainting indicator.

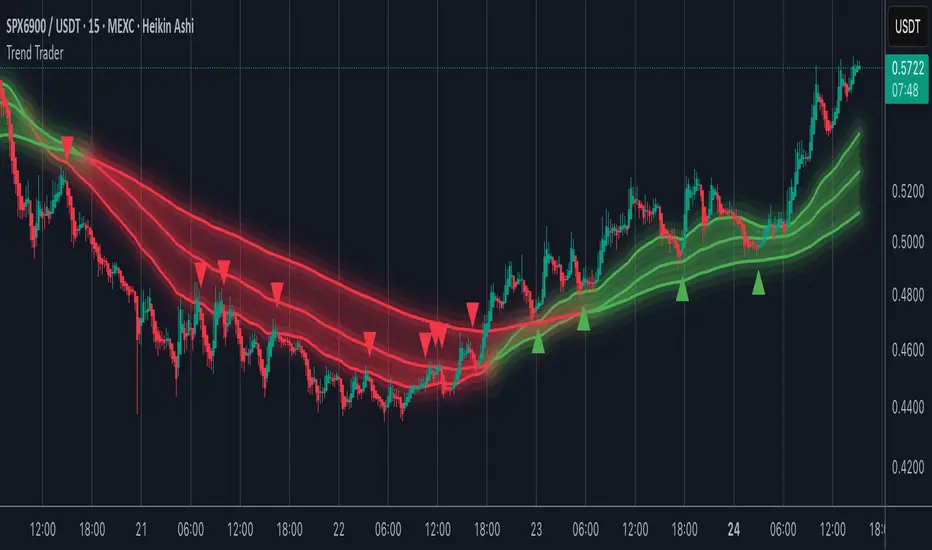
Trend TraderMost trend indicators don’t offer continuation signals or accurate bounce points, so I created this indicator that uses one of the most common trading levels (EMAs). This indicator uses the 50, 100, and 200 EMAs along with WaveTrend signals to trade trends. Buy Signals are filtered so that they only show up when the 100 EMA is above the 200. And Inverse for Sell Signals.
This indicator works well with both Stocks and Crypto. Default settings work best on 15 min, 1H, 2H, and 4H.
(Chart examples are using Heikin Ashi Candles, on Log Scale.)
*Buy and Sell Signals do not repaint.
Settings:
- Ability to show all buy and sell signals regardless of trend.
- To change the sensitivity of the buy and sell signals, change the “Average Length”
- (The lower the number the more sensitive, the higher the number the less they pop up)
- Ability to change EMA Lengths
imgur.com
Tactical Deviation🎯 TACTICAL DEVIATION - Volume-Backed VWAP Deviation Analysis
What Makes This Different?
Unlike basic VWAP indicators, Tactical Deviation combines:
• Multi-timeframe VWAP deviation bands (Daily/Weekly/Monthly)
• Volume spike intelligence - signals only appear with volume confirmation
• Pivot reversal detection at deviation extremes
• Optional multi-VWAP confluence system
• Smart defaults for quality over quantity
This unique combination filters weak setups and identifies high-probability entries at extreme price deviations from fair value.
📊 DEFAULT SETTINGS (Ready to Use)
✅ Daily VWAP with ±2σ deviation bands
✅ Volume spike detection (1.5x average required)
✅ 2σ minimum deviation for signals
❌ Weekly/Monthly VWAPs (enable for multi-timeframe)
❌ Pivot reversal requirement (enable for stronger signals)
❌ Fill zones (optional visual enhancement)
Why: Daily VWAP is most relevant for intraday trading. 2σ bands catch meaningful moves. Volume spikes ensure conviction. Clean chart focuses on what matters.
🚀 HOW TO USE
BASIC USAGE:
• Green triangles (below bars) = Long signals at oversold deviations
• Red triangles (above bars) = Short signals at overbought deviations
SIGNAL QUALITY:
• Normal size, bright colors = Volume spike (best quality)
• Small size, lighter colors = Volume momentum
• Tiny size = No volume confirmation
DEVIATION ZONES:
• ±2σ = Extreme deviation (signals appear here)
• ±1σ to ±2σ = Extended but not extreme
• Within ±1σ = Normal range
TRADING APPROACHES:
Mean Reversion:
→ Enter when price reaches ±2σ with volume spike
→ Target: Return to VWAP or opposite band
→ Stop: Beyond extreme deviation
Trend Continuation:
→ Use bands to identify pullbacks
→ Enter pullback to VWAP in trending market
→ Volume confirms continuation
Reversal Trading:
→ Enable "Require Pivot Reversal" for stronger signals
→ Signals only when deviation + pivot reversal occur
→ Higher probability, fewer signals
⚙️ EXPLORE SETTINGS FOR FULL USE
VWAP SETTINGS:
• Show Weekly/Monthly VWAP = Multi-timeframe context
• Show ±1σ Bands = Normal deviation range
• Show ±3σ Bands = Extreme extremes (rare but powerful)
SIGNAL SETTINGS:
• Min Deviation: 1σ (more signals) | 2σ (default) | 3σ (fewer, extreme only)
• Require Pivot Reversal: OFF (default) | ON (stronger but fewer)
• Volume Spike Threshold: 1.5x (default) | 2.0x+ (major spikes) | 1.2x (more signals)
CONFLUENCE SETTINGS:
• Require Multi-VWAP Confluence: OFF (default) | ON (2+ VWAPs must agree)
• Min VWAPs: 2 (Daily + Weekly/Monthly) | 3 (all must agree)
VISUAL SETTINGS:
• Show Fill Zones = Shaded areas between bands
• Fill Opacity = Transparency adjustment
• Line Widths = Customize thickness
💡 PRO TIPS
1. Start with defaults, then enable features as you learn
2. Volume spike requirement filters weak moves - keep it enabled
3. Enable Weekly/Monthly VWAPs for higher timeframe context
4. Enable confluence for swing trading setups
5. Pivot reversals: ON for reversals, OFF for continuations
6. Check top-right info table for current deviation levels
🎨 VISUAL GUIDE
• Cyan Line = Daily VWAP (fair value)
• Cyan Bands = Daily deviation zones
• Orange Line = Weekly VWAP (if enabled)
• Purple Line = Monthly VWAP (if enabled)
• Green Triangle = Long signal (oversold)
• Red Triangle = Short signal (overbought)
⚠️ IMPORTANT
Educational purposes only. Always use proper risk management. Signals are based on statistical deviation, not guarantees. Volume confirmation improves quality but doesn't guarantee outcomes. Combine with your own analysis.
The unique combination of VWAP deviation analysis, volume profile confirmation, pivot identification, and multi-timeframe confluence in a single clean interface makes Tactical Deviation different from basic VWAP indicators.
Happy Trading! 📈

DPPSI A+ FINDPPSI is a precision-driven ORB-based confirmation indicator built from the DPPS Framework (Databased Probable Profitable System) — a rule-based trading process backed by real data, real backtests, and real forward results.
DPPSI helps traders identify A-grade breakouts using three core pillars:
Opening Range Logic (ORB)
Automatically detects your morning OR window and plots OR High, Low, and EQ.
Volume Confirmation
Filters breakouts using relative volume strength (customizable).
Smart Retest Logic
Signals only when price breaks the OR and pulls back with clean retest structure.
Optional filters include Fair Value Gaps, signal limits per session, and adjustable sensitivity.
Designed for traders who want clean, rule-based setups without clutter or random noise.
DPPSI doesn’t replace your strategy it confirms the highest-probability moments inside it.

Kalman Trend Sniper# KALMAN TREND SNIPER
## ORIGINALITY STATEMENT
The Kalman Trend Sniper combines adaptive trend detection with precision entry validation to identify high-probability trading opportunities. Unlike static moving averages that use fixed parameters, this indicator adapts to changing market volatility through ATR-based gain adjustment and distinguishes trending from ranging markets using ADX regime detection.
The indicator's unique contribution is its three-phase entry validation system: signals must hold for three bars, undergo a pullback test to the signal level, and receive confirmation through price action before generating an entry. This structured approach helps traders enter established trends at favorable retracement levels rather than chasing momentum.
---
## TECHNICAL METHODOLOGY
### Kalman Filter Implementation
This indicator implements an Alpha-Beta variant of the Kalman filter, a recursive algorithm that estimates trend from noisy price data:
1. Prediction: kf = kf + velocity
2. Error calculation: error = price - kf
3. Correction: kf = kf + gain * error
4. Velocity update: velocity = velocity + (gain * error) / 2
The gain parameter determines filter responsiveness. Higher gain values track price more closely but increase noise sensitivity, while lower values provide smoother output but lag price changes.
### Adaptive Gain Mechanism
The indicator adjusts gain dynamically based on volatility:
Volatility Factor = Current ATR / Long-term ATR
Adaptive Gain = Base Gain * (0.7 + 0.6 * Volatility Factor)
This ATR ratio increases responsiveness during high-volatility periods and reduces sensitivity during consolidations, addressing the fixed-parameter limitation of traditional moving averages. The volatility factor is bounded between configurable minimum and maximum values to prevent extreme adjustments.
### Regime Detection
The indicator uses the Average Directional Index (ADX) to distinguish market conditions:
- Trending markets (ADX above threshold): Full gain applied, signals generated
- Ranging markets (ADX below threshold): Gain reduced 25%, fewer signals
This regime awareness helps reduce whipsaw signals during sideways consolidation periods.
### Signal Line Validation System
When the Kalman line changes direction in trending conditions, the indicator draws a horizontal signal line at the low (for long signals) or high (for short signals) of the signal candle. This line represents a potential support or resistance level.
The validation system then monitors three phases:
Phase 1 - Hold Period: Price must remain above (long) or below (short) the signal line for three consecutive bars. This requirement filters weak signals where price immediately violates the signal level.
Phase 2 - Test: After the hold period, the system waits for price to pull back and touch the signal line, with configurable tolerance for volatile instruments.
Phase 3 - Confirmation: Within eight bars of the test, a confirmation candle must close above (long) or below (short) the test candle's body, demonstrating renewed momentum. If confirmation does not occur within eight bars, the validation attempt expires.
Successful validation generates an R label at the entry point. This three-phase structure helps identify entries where trend direction and support/resistance validation align.
---
## USAGE INSTRUCTIONS
### Signal Interpretation
Triangle Signals:
- Upward triangle (teal): Kalman line turns bullish in trending market (ADX above threshold)
- Downward triangle (red): Kalman line turns bearish in trending market
Signal Lines (horizontal):
- Teal line: Potential long support level at signal candle low
- Red line: Potential short resistance level at signal candle high
- Gray line: First opposite-color candle after signal (initial reversal pressure)
R Labels (optional, disabled by default):
- Green R below price: Validation complete for long entry
- Red R above price: Validation complete for short entry
Stop Levels:
- Red dots: Long stop level (Kalman line minus ATR multiplier)
- Teal dots: Short stop level (Kalman line plus ATR multiplier)
### Dashboard Information
The dashboard displays real-time indicator state:
- Trend: Current Kalman direction (BULL/BEAR)
- Regime: Market classification (Trending when ADX exceeds threshold, Ranging otherwise)
- Gain: Current adaptive gain value
- Vol Factor: Volatility ratio (current ATR / long-term ATR)
- ADX: Trend strength (higher values indicate stronger trends)
- Z-Score: Standard deviation distance from Kalman line (when enabled)
- Stop Dist: Current ATR-based stop distance
- Lines: Number of active signal lines displayed
- R-Status: Validation system state (Idle / Waiting / Testing)
### Trading Applications
Trend Following Approach:
1. Wait for triangle signal in trending market (ADX above threshold)
2. Enter immediately at signal candle close or wait for pullback
3. Place stop at displayed stop level
4. Trail stop using Kalman line as dynamic support/resistance
Validation Entry Approach (conservative):
1. After triangle signal, observe three-bar hold period
2. Wait for pullback to signal line (test phase)
3. Enter on R label confirmation
4. Place stop below/above signal line
5. Provides higher probability entries but reduces trade frequency
Z-Score Mean Reversion (when enabled):
1. Watch for Z-Score exceeding entry threshold (default +/-2.0)
2. Consider counter-trend entries when price touches Kalman line
3. Target return to Kalman line (Z-Score near zero)
4. Use Z-Score threshold as stop level for extreme continuation
### Optimal Conditions
The indicator performs optimally in clearly trending markets where ADX consistently exceeds the threshold. Performance degrades in sideways, choppy conditions.
Recommended timeframes:
- 1-5 minute charts: Use Crypto_1M preset (faster adaptation)
- 15-60 minute charts: Use Crypto_15M preset (balanced)
- Hourly charts: Use Forex preset (smoother)
- Daily charts: Use Stocks_Daily preset (long-term trends)
Market conditions:
- High volatility (Vol Factor above 1.5): Expect faster adaptation, wider stops needed
- Normal volatility (Vol Factor 0.7-1.5): Standard behavior
- Low volatility (Vol Factor below 0.7): Expect slower adaptation, tighter stops possible
---
## PARAMETER DOCUMENTATION
### Kalman Filter Settings
Preset Mode: Select optimized configuration for specific markets
- Custom: Manual parameter control
- Crypto_1M: Base Gain 0.05, ATR 7 (fast response for 1-5 minute crypto charts)
- Crypto_15M: Base Gain 0.03, ATR 14 (balanced for 15-60 minute crypto charts)
- Forex: Base Gain 0.02, ATR 14 (standard for forex pairs)
- Stocks_Daily: Base Gain 0.01, ATR 20 (smooth for daily stock charts)
Base Gain (0.001-0.2): Core Kalman filter responsiveness parameter. Higher values increase sensitivity to price changes. Low values (0.01-0.02) provide smooth output with fewer whipsaws but slower trend changes. High values (0.06-0.08) offer fast response with more signals but increased whipsaw risk.
Adaptive (checkbox): When enabled, automatically adjusts gain based on ATR ratio. Recommended to keep enabled for dynamic volatility adaptation.
ATR (5-50): Short-term Average True Range period for current volatility measurement. Default 14 is industry standard. Lower values respond faster to volatility changes.
Long ATR (20-200): Long-term ATR period for baseline volatility comparison. Default 50 provides stable reference. The ratio between ATR and Long ATR determines adaptive adjustment magnitude.
Regime Filter (checkbox): Enables ADX-based trending/ranging detection. When enabled, reduces gain by 25 percent during ranging markets to minimize false signals.
ADX Period (7-30): Period for ADX calculation. Default 14 is standard. Lower values respond faster to trend strength changes.
Threshold (15-40): ADX level distinguishing trending from ranging markets. Default 25. Above threshold: trending (generate signals normally). Below threshold: ranging (reduce sensitivity).
Min Vol / Max Vol (0.3-3.0): Bounds for volatility factor adjustment. Prevents extreme gain changes during unusual volatility spikes or quiet periods. Default minimum 0.5, maximum 2.0.
Stop ATR x (1.0-3.0): Multiplier for ATR-based stop loss distance. Default 2.0 places stops two ATRs from Kalman line. Use 1.5 for tight stops (intraday), 2.5-3.0 for wide stops (swing trading).
Show Signals (checkbox): Displays triangle signals when Kalman changes direction in trending markets. Disable to use indicator purely as dynamic support/resistance without signals.
Z-Score (checkbox): Enables mean-reversion signal generation based on statistical deviation from Kalman line.
Period (10-100): Lookback period for Z-Score standard deviation calculation. Default 20 bars. Longer periods produce smoother, less sensitive readings.
Entry (1.5-3.5): Standard deviation threshold for Z-Score signals. Default 2.0 generates signals at plus/minus two standard deviations (approximately 95th percentile moves).
Bull / Bear Colors: Customize Kalman line colors for uptrend (default teal) and downtrend (default red).
Fill (checkbox): Shows semi-transparent fill between price and Kalman line for visual trend emphasis.
### Signal Line System Settings
Signal Lines (checkbox): Displays horizontal signal lines at low (long) or high (short) of signal candles. These function as dynamic support/resistance levels.
Reverse Lines (checkbox): Shows gray horizontal lines at first opposite-colored candle after signal. Helps identify initial resistance points in new trends.
Max Lines (0-20): Maximum number of signal lines to display simultaneously. Older lines are removed as new signals appear. Use 1-2 for clean charts, 3-5 for recent support/resistance history.
Style (Solid/Dotted/Dashed): Visual style for signal and reverse lines. Dotted provides subtle appearance, solid is most prominent.
Line % / Label % (0-100): Transparency percentage for lines and labels. Zero is fully opaque, 100 is invisible.
R Labels (checkbox): Shows R labels when validation confirmation occurs. Default disabled. Enable if you want visual confirmation of successful pullback entries.
Tolerance % (0-1.0): Price deviation tolerance for test candle detection. Zero requires exact touch. 0.5 allows 0.5 percent deviation for volatile instruments.
### Dashboard Settings
Show Dashboard (checkbox): Toggles visibility of information panel. Disable for clean chart presentation.
Position: Choose dashboard location from nine positions (Top/Middle/Bottom combined with Left/Center/Right).
---
## LIMITATIONS AND WARNINGS
This indicator is a technical analysis tool that processes historical price data. It does not predict future price movements.
Inherent limitations:
1. Lagging nature: Like all trend indicators, the Kalman filter lags price. Signals occur after trend changes begin, not before.
2. Ranging markets: Generates fewer signals and reduced performance when ADX falls below threshold. Not optimized for sideways consolidation.
3. Whipsaw risk: In choppy, indecisive markets near ADX threshold, signals may reverse quickly despite regime filtering.
4. Parameter sensitivity: Inappropriate Base Gain settings can cause over-trading (too high) or missed trends (too low).
5. Validation requirement: The three-phase confirmation system provides higher accuracy but significantly reduces trade frequency. Not all trends produce valid pullback entries.
Not suitable for:
- Scalping strategies requiring instant signals (Kalman filter has intentional smoothing)
- Ultra-high frequency trading (indicator updates once per bar close)
- Markets with extreme overnight gaps (stops may be exceeded)
- Strategies requiring signals on Heikin Ashi, Renko, Kagi, Point and Figure, or Range charts
Risk management requirements:
This indicator provides trend direction and signal levels but does not incorporate position sizing, risk management, or account balance considerations. Users must implement appropriate position sizing, maximum daily loss limits, and portfolio diversification. Past performance does not indicate future results.
Optimal usage:
- Works optimally in clearly trending markets where ADX consistently exceeds threshold
- Performance degrades in sideways, choppy conditions
- Designed for swing trading and position trading timeframes (15-minute and above)
- Requires confirmation from price action or additional technical analysis
---
## NO REPAINT GUARANTEE
This indicator operates on bar close confirmation only. All signals, signal lines, and validation labels appear exclusively when candles close. Historical signals remain exactly where they appeared. This makes the indicator suitable for automated trading and reliable backtesting. What you see in historical data matches what appeared in real-time.
---
## ALERTS
The indicator provides eight alert conditions:
1. Kalman Buy Signal: Fires when upward triangle appears (bullish trend change in trending market)
2. Kalman Sell Signal: Fires when downward triangle appears (bearish trend change in trending market)
3. Trend Change to Bullish: Fires whenever Kalman line changes to bullish (regardless of ADX)
4. Trend Change to Bearish: Fires whenever Kalman line changes to bearish (regardless of ADX)
5. SCT-R Long Retest Confirmed: Fires when green R label appears for long validation
6. SCT-R Short Retest Confirmed: Fires when red R label appears for short validation
7. SCT Test Long Detected: Fires when test candle appears for long signal (before confirmation)
8. SCT Test Short Detected: Fires when test candle appears for short signal (before confirmation)
Alert messages include context about bar close confirmation and current price levels.
---
## CALCULATION TRANSPARENCY
While complete proprietary optimization methodology is not disclosed, the core technical approach is fully explained: Alpha-Beta Kalman filter with ATR-based adaptive gain adjustment and ADX regime detection. The signal line validation system uses a three-phase structure (hold, test, confirmation) with configurable parameters. Users can understand indicator functionality and make informed decisions about application.
---
## DISCLAIMER
This indicator is provided as a technical analysis tool. It does not constitute financial advice, trading recommendations, or performance guarantees. All trading decisions carry risk. Users are responsible for their own trading decisions and risk management. Past results do not indicate future performance.

HalfTrend + Trend AliThis indicator combines the structural logic of the HalfTrend system with a trend filter built on the Hull Moving Average to provide a clearer view of potential market turning points.
The HalfTrend method reacts to price extremes using adaptive deviations, offering a dynamic representation of local highs and lows. By integrating a Hull MA trend filter, the script focuses only on signals that appear in harmony with the prevailing directional bias, helping reduce noise that may occur during counter-trend fluctuations.
🔹 How It Works
The HalfTrend algorithm tracks price swings using amplitude-based detection and ATR-derived channel deviation.
A trend switch is detected when price moves beyond the boundaries of the current swing structure.
The Hull Moving Average acts as a fast-reacting trend reference. Only signals that align with the Hull direction are highlighted.
To maintain clarity and avoid clustered notifications, the script displays only one signal per confirmed trend phase.
🔹 What the Signals Represent
Buy signals appear when the HalfTrend structure shifts upward and the Hull MA confirms an uptrend.
Sell signals appear when the structure shifts downward and the Hull MA confirms a downtrend.
Both signal types include optional alerts for traders who want to be notified immediately when conditions change.
🔹 Purpose
This tool is intended for traders who want to observe structural trend shifts together with a clean and responsive trend filter. It does not attempt to predict the market; instead, it highlights moments when short-term reversals and broader trend direction are aligned.
🔹 Notes
The indicator does not repaint the signals once confirmed.
It can be applied to any market or timeframe.
Users may combine it with their own risk management or additional confirmation tools.

Liquidity Hunt Detector PDH/PDL [SmartFoxy]Liquidity Hunt Detector PDH/PDL
The Liquidity Hunt Detector (LHD) is designed to identify and anticipate liquidity grabs around the:
• Previous Day High (PDH);
• Previous Day Low (PDL).
It builds dynamic trigger levels that highlight where price may deliver its first impulse before reaching PDH/PDL.
The Liquidity Hunt Detector (LHD) identifies high-probability reversals and continuations around the Previous Day High (PDH) and Previous Day Low (PDL).
It dynamically tracks the market’s move from the session open, builds trigger levels toward PDH/PDL, and highlights where liquidity is most likely to be taken.
When price taps a Trigger Up/Down level, the indicator generates Long/Short signals with optional confirmation from the integrated MA Ribbon , ensuring only high-quality, trend-aligned setups are shown.
When price interacts with these trigger levels, the indicator generates signals that help traders evaluate the market structure and prepare for potential entries.
Designed for Forex, Crypto, Indices, Stocks , the LHD provides a clean and intuitive structure for navigating intraday liquidity grabs, session impulses, and directional bias shifts.
The indicator is built from three fully independent modules, each of which can be used separately:
Liquidity Hunt Detector (LHD)
Moving Average Ribbon (MA Ribbon)
Previous Day High/Low (PDH/PDL) levels
Liquidity Hunt Detector (LHD) Logic
1.1 Display LHD – Enables or disables the entire Liquidity Hunt Detector module.
1.2 Max Days – Number of previous days used to generate PDH/PDL levels.
1.3 GMT – Corrects all time-based calculations based on your broker/session timezone.
1.4 Calculation Method (Point A Logic)
1) Static Method
Point A = the session’s opening price.
Trigger lines are calculated strictly as a percentage of the move A → PDH or A → PDL.
Intraday fluctuations do not affect the calculation.
2) Dynamic Method
Point A updates using the current intraday high/low:
• If price forms a new low, Point A updates for the PDH-side calculations;
• If price forms a new high, Point A updates for the PDL-side calculations.
This produces trigger lines that reflect the true live market structure rather than a fixed opening reference.
1.5 Main OTT Time (Operational Trading Time)
This is the core time window during which the indicator:
• updates Point A;
• calculates trigger levels;
• validates PDH/PDL;
• draws AB / AC movement structure;
• generates entry signals.
Outside this window, no new signals or recalculations occur.
⚠ If your broker’s first candle opens at a non-standard time (e.g., 00:08), adjust the OTT start time to avoid visual artifacts.
1.6 Show Line A – Displays the opening price level (Point A) until the end of the OTT window.
Style, width, and color are customizable.
1.7 Show Line AB — Price Movement Toward PDH.
Static Method – Single line: A → PDH
Dynamic Method – Two segments:
• A → Daily Low;
• Daily Low → PDH.
If PDH is swept, the “B” label switches to Sweep PDH.
1.8 Show Line AC – Price Movement Toward PDL.
Static Method – Single line: A → PDL
Dynamic Method – Two segments:
• A → Daily High;
• Daily High → PDL.
If PDL is swept, the “C” label switches to Sweep PDL.
1.9 Show Trigger Up Line (LONG Trigger) – Defines the level where the Long signal can activate.
By default, at 50% of the A → PDH movement.
When price touches this line, the script may:
• show a LONG label;
• trigger an alert.
All visual parameters are customizable.
1.10 Show Trigger Up Line (LONG Trigger)
Same logic as Trigger Up, but based on A → PDL.
1.11 Show Main Zone (OTT Zone) – Visual background highlighting of the active OTT window.
Helps instantly see:
• whether signals are allowed;
• how much time remains in the trading window?
Color and opacity are adjustable.
1.12 Upper Zone (toward PDH) – Tracks the protected area towards PDH.
Updates dynamically with new highs.
1.13 Lower Zone (toward PDL) – Tracks the zone toward PDL.
Updates dynamically with new lows.
1.14 Show Labels – Displays reference labels (A, B, C, Trigger Up, Trigger Down).
Label size is customizable.
1.15 Add Price – Adds the exact price value to each label.
1.16 Change Color after Sweep PDH or PDL – After PDH or PDL is broken, the indicator automatically recolors lines and labels to visually confirm the sweep.
1.17 Show SHORT Label – Displays the SHORT entry label when all conditions for a bearish signal are met.
Style parameters are set in the previous blocks.
1.18 Alert on Bearish Trigger Down – Triggers an alert when the price activates the bearish trigger.
1.19 Show LONG Label – Displays the LONG entry label when bullish conditions are met.
Style parameters are set in the previous blocks.
1.20 Alert on Bullish Trigger Up – Triggers an alert when the price activates the bullish trigger.
1.21 Alerts Active Time – Defines a custom time interval during which trigger signals are allowed.
Even if price touches a trigger level,
❗ signals will NOT be generated outside this allowed time.
Useful for:
• avoiding Asian session signals;
• reducing noise in low-liquidity periods.
1.22 Labels and Alerts Display Mode
Two settings modes:
• On Trigger (Instant Mode) – Signals appear immediately when price touches the trigger.
• On Candle Close (Conservative Mode) – Signals form only after the candle closes beyond the trigger level.
A more conservative option.
1.23 Delay LHD Signal Until MA Ribbon Confirms Direction – If enabled, LHD signals will NOT fire until the MA Ribbon produces a matching directional signal.
Logic:
• Price hits the trigger → LHD conditions become “armed”;
• The indicator waits;
• When MA Ribbon confirms trend direction (Long/Short);
• The final LHD label + alert is generated.
This ensures LHD trades are filtered and aligned with MA-based trend confirmation.
⚠ Works only when the MA Ribbon module is active.

Liquidation Reversal Signals [AlgoAlpha]🟠 OVERVIEW
This tool detects potential liquidation-driven reversals by combining z-score analysis of up/down volume with the classic Supertrend. It watches for abnormal surges in directional volume (on a lower timeframe) and links them to trend flips on the main chart. When both align within a short window, it flags a probable reversal caused by forced liquidations. The goal is to help traders identify exhaustion points where aggressive liquidation moves may mark the end of a trend leg.
🟠 CONCEPTS
The logic revolves around Z-score normalization of up and down volume to locate statistical extremes. When up-volume z-scores exceed a threshold during a bearish Supertrend, it implies trapped shorts being squeezed; the opposite applies for long liquidations. The script tracks these liquidation spikes and monitors whether a Supertrend regime change follows soon after. If confirmed within the allowed timeout, a colored signal marks the event.
In essence:
Z-score outliers = potential forced liquidations.
Supertrend = structural regime context.
Combined = statistically confirmed reversal signals, not random flips.
This pairing reduces false positives by ensuring that both volatility structure and order-flow extremes agree before flagging a reversal.
🟠 FEATURES
Z-score detection for liquidation spikes with adjustable lookback and threshold.
Confirmation logic linking liquidations to Supertrend flips.
Alerts for liquidation spikes and confirmed reversal starts.
On-chart “No Volume” warning to avoid misreads on illiquid assets.
🟠 USAGE
Setup : Add the script to your main chart. Choose a lower timeframe (default 15m) to capture more granular liquidation flows. Adjust Z-Score Length to control how far back the script measures normal behavior and Threshold to decide what counts as extreme. Keep Timeout Bars low (e.g. 20–50) for faster reversals, or higher for slower markets.
Read the chart :
• Circles appear below bars when long liquidations occur; above bars for short liquidations.
• A Supertrend flip with a recent liquidation spike will display an arrow and color shift.
• Fills between candles and trend lines show which side dominates: green for bullish reversal, red for bearish.
• Candle color fades based on the magnitude of liquidation pressure.
Settings that matter :
• Z-Score Length : Longer smooths noise but delays signal; shorter reacts faster.
• Z-Score Threshold : Higher means only extreme liquidations trigger; lower finds smaller squeezes.
• Timeout Bars : Defines how long after a liquidation the Supertrend flip remains valid.
• Lower Timeframe : Determines the precision of volume readings; too low may increase noise.

Daniel.Yer Volume Breakout Signal🧠 Summary – Daniel.Yer Volume Breakout Signal
The indicator only works on time frames of minutes.
An indicator that detects high-volume breakouts after the market opens and highlights potential entry zones.
Based on sampling the opening volume window and comparing it to the session’s volume peak.
Visually marks preparation areas (colored background) and plots BUY/SELL triangles for confirmation candles.
Includes real-time alert conditions for leading tickers: SPY, AAPL, MSFT, META, AMD, TSLA, NVDA, PLTR, GOOG, and AMZN.
Optimized for day trading — provides actionable alerts even when the user is offline.

Volume Sentiment Breakout Channels [AlgoAlpha]🟠 OVERVIEW
This tool visualizes breakout zones based on volume sentiment within dynamic price channels . It identifies high-impact consolidation areas, quantifies buy/sell dominance inside those zones, and then displays real-time shifts in sentiment strength. When the market breaks above or below these sentiment-weighted channels, traders can interpret the event as a change in conviction, not just a technical breakout.
🟠 CONCEPTS
The script builds on two layers of logic:
Channel Detection : A volatility-based algorithm locates price compression areas using normalized highs and lows over a defined lookback. These “boxes” mark accumulation or distribution ranges.
Volume Sentiment Profiling : Each channel is internally divided into small bins, where volume is aggregated and signed by candle direction. This produces a granular sentiment map showing which levels are dominated by buyers or sellers.
When a breakout occurs, the script clears the previous box and forms a new one, letting traders visually track transitions between phases of control. The colored gradients and text updates continuously reflect the internal bias—green for net-buying, red for net-selling—so you can see conviction strength at a glance.
🟠 FEATURES
Volume-weighted sentiment map inside each box, with gradient color intensity proportional to participation.
Dynamic text display of current and overall sentiment within each channel.
Real-time trail lines to show active bullish/bearish trend extensions after breakout.
🟠 USAGE
Setup : Add the script to your chart and enable Strong Closes Only if you prefer cleaner breakouts. Use shorter normalization length (e.g., 50–80) for fast markets; longer (100–200) for smoother transitions.
Read Signals : Transparent boxes mark active sentiment channels. Green gradients show buy-side dominance, red shows sell-side. The middle dashed line is the equilibrium of the channel. “▲” appears when price breaks upward, “▼” when it breaks downward.
Understanding Sentiment : The sentiment profile can be used to show the probability of the price moving up or down at respective price levels.

Statistical Price Deviation Index (MAD/VWMA)SPDI is a statistical oscillator designed to detect potential price reversal zones by measuring how far price deviates from its typical behavior within a defined rolling window.
Instead of using momentum or moving averages like traditional indicators, SPDI applies robust statistics - a rolling median and Mean Absolute Deviation (MAD) - to calculate a normalized measure of price displacement. This normalization keeps the output bounded (from −1 to +1 by default), producing a stable and consistent oscillator that adapts to changing volatility conditions.
The second line in SPDI uses a Volume-Weighted Moving Average (VWMA) instead of a simple price median. This creates a complementary oscillator showing statistically weighted deviations based on traded volume. When both oscillators align in their extremes, strong confluence reversal signals are generated.
How It Works
For each bar, SPDI calculates the median price of the last N bars (default 100).
It then measures how far the current bar’s midpoint deviates from that rolling median.
The Mean Absolute Deviation (MAD) of those distances defines a “normal” range of fluctuation.
The deviation is normalized and compressed via a tanh mapping, keeping the oscillator in fixed boundaries (−1 to +1).
The same logic is applied to the VWMA line to gauge volume-weighted deviations.
How to Use
The blue line (Price MAD) represents pure price deviation.
The green line (VWMA Disp) shows the volume-weighted deviation.
Overbought (red) zones indicate statistically extreme upward deviation -> potential short-term overextension.
Oversold (green) zones indicate statistically extreme downward deviation -> potential rebound area.
Confluence signals (both lines hitting the same extreme) often mark strong reversal points.
Settings Tips
Lookback length controls how much historical data defines “normal” behavior. Larger = smoother, smaller = more sensitive.
Smoothing (RMA length) can reduce noise without changing the overall statistical logic.
Output scale can be set to either −1..+1 or 0..100, depending on your visual preference.
Alerts and color fills are fully customizable in the Style tab.
Summary:
SPDI transforms raw price and volume data into a statistically bounded deviation index. When both Price MAD and VWMA Disp reach joint extremes, it highlights probable market turning points - offering traders a clean, data-driven way to spot potential reversals ahead of time.

SZO - Signal Zone Oscillator ## Signal Zone Oscillator - SZO
**Created by:** @TraderCurses
**Version:** 1.0 (October 2025)
### ▌ OVERVIEW
The Signal Zone Oscillator (SZO) is a comprehensive momentum tool designed to provide a clearer, more nuanced view of market dynamics. It synthesizes three of the most powerful classic indicators—RSI, a unique MACD Ratio, and the Stochastic oscillator—into a single, unified signal.
The indicator's core feature is the **"Signal Zone"**: a colored area between the main oscillator line and its moving average filter. This zone makes it incredibly easy to visualize shifts in momentum, trends, and potential entry/exit points.
### ▌ KEY FEATURES
* **Composite Formula:** Combines RSI, MACD Ratio, and Stochastic using a weighted average to measure underlying market momentum.
* **The Signal Zone:** The flagship feature. The area between the SZO line and its filter is colored **green** in a bullish context (SZO above filter) and **red** in a bearish context (SZO below filter).
* **Dynamic Coloring:** Both the main SZO line and its filter change color dynamically, providing instant feedback on direction and strength.
* **Zero-Line Reference:** A dashed zero line acts as a classic equilibrium level, helping to confirm stronger bullish or bearish momentum.
* **Fully Customizable:** Every parameter is adjustable. You can change the lengths, sources, and even the weights of the core indicators from the settings menu.
* **Built-in Alerts:** Comes with pre-configured alerts for crossovers of the filter and the zero line, allowing you to automate your monitoring.
### ▌ HOW TO USE IT
The SZO provides several clear signals for traders:
1. **Bullish Signal:**
* The SZO line crosses **above** its filter.
* The Signal Zone turns **green**.
* A cross above the zero line can be used as further confirmation of strong bullish momentum.
2. **Bearish Signal:**
* The SZO line crosses **below** its filter.
* The Signal Zone turns **red**.
* A cross below the zero line can be used as further confirmation of strong bearish momentum.
3. **Divergences:**
* Like any oscillator, look for divergences between the SZO's peaks/troughs and the price action to spot potential reversals.
This tool is designed for traders who want to cut through the noise and get a clear, actionable signal from multiple momentum sources at once. Happy trading!

SEVENX Free|SuperFundedSEVENX — Modular Multi-Signal Scanner (SuperFunded)
What it is
SEVENX combines seven classic signals—MACD, OBV, RSI, Stochastics, CCI, Momentum, and an optional ATR volatility filter—into a modular gate. You can toggle each condition on/off, and a BUY/SELL arrow prints only when all enabled conditions agree. Text labels are optional.
Why this is not a simple mashup
・Most “combo” scripts just overlay indicators. SEVENX is a strict consensus engine:
・Each condition is binary and user-switchable.
・The final signal is the logical AND of all enabled checks (no hidden weights).
・Signals fire only on confirmed events (e.g., RSI crossing a level, Stoch K/D cross), which makes entries rule-driven and reproducible.
This yields a transparent, vendor-grade workflow where traders can start simple (2–3 gates) and tighten selectivity by enabling more gates.
How it works (concise)
・MACD: macd_line > signal_line (buy) / < (sell).
・OBV trend: OBV > OBV_MA (buy) / < (sell).
・RSI bounce/drop: crossover(RSI, Oversold) (buy) / crossunder(RSI, Overbought) (sell).
・Stoch cross: %K crosses above %D (buy) / below (sell).
・CCI rebound/pullback: crossover(CCI, -Level) (buy) / crossunder(CCI, +Level) (sell).
・Momentum: Momentum > 0 (buy) / < 0 (sell).
・ATR filter (optional): ATR > ATR_MA must also be true (both sides).
・Final signal: AND of all enabled conditions. If you enable none on a side, that side will not print.
Parameters (UI mapping)
Buy Signal (group: “— Buy Signal —”)
・MACD Golden Cross / OBV Uptrend / RSI Bounce from Oversold / Stochastic Golden Cross / CCI Rebound from Oversold / Momentum > 0 / ATR Volatility Filter (on/off)
Sell Signal (group: “— Sell Signal —”)
・MACD Dead Cross / OBV Downtrend / RSI Drop from Overbought / Stochastic Dead Cross / CCI Pullback from Overbought / Momentum < 0 / ATR Volatility Filter (on/off)
Indicator Settings
・MACD: Fast/Slow/Signal lengths.
・RSI: Length, Overbought/Oversold levels.
・Stochastics: %K length, %D smoothing, overall smoothing.
・CCI: Length, Level (±Level used).
・Momentum: Length.
・OBV: MA length for trend baseline.
・ATR: ATR length, ATR MA length (for the filter).
Display
・Show Text (BUY/SELL text on the markers), Buy/Sell Text Colors.
Practical usage
・Start simple: Enable 2 conditions (e.g., MACD + RSI). If signals are too frequent, add OBV or Momentum; if still frequent, enable ATR filter.
・Mean-reversion vs trend:
・For trend-following, prefer MACD/OBV/Momentum gates.
・For reversal bounces, add RSI/CCI gates and keep Stoch for timing.
・Tuning sensitivity:
・Raise RSI Oversold/Overbought thresholds to make bounces rarer.
・Increase ATR_MA length to smooth the volatility baseline.
・Risk first: Plan SL/TP independently (e.g., structure levels or R-multiples). SEVENX focuses on entry qualification, not exits.
Repainting & confirmation
Signals depend on cross events and are best treated on bar close. Intrabar flips can occur before a bar closes; for strict rules, confirm on closed bars in your strategy.
Disclaimer
No indicator can guarantee outcomes. News, liquidity, and spread conditions can invalidate signals. Trade responsibly and manage risk.
This indicator is being released on a trial basis and may be discontinued at our discretion.
SEVENX — モジュラー型マルチシグナル・スキャナー(日本語)
概要
SEVENXは、MACD / OBV / RSI / ストキャス / CCI / モメンタム / ATRフィルターの7条件を個別オン・オフで制御し、有効化した条件がすべて満たされたときだけBUY/SELL矢印を表示する、合意(AND)型シグナルインジです。テキスト表示も任意。
独自性・新規性
・各条件はブラックボックスではなく明示的なブール判定で、最終シグナルは有効化した条件のAND。
・RSIのレベルクロスやStochのK/Dクロスなど、確定イベントで判定するため、再現性の高いルール運用が可能。少数条件から始めて、必要に応じて段階的に厳格化できます。
動作要点
・MACD:線がシグナル上/下。
・OBV:OBVがOBVのMAより上/下。
・RSI:RSIがOSを上抜け(買い)/OBを下抜け(売り)。
・Stoch:%Kが%Dを上抜け/下抜け。
・CCI:CCIが**−Levelを上抜け**(買い)/+Levelを下抜け(売り)。
・Momentum:0より上/下。
・ATRフィルター(任意):ATR > ATR_MA を満たすこと(買い/売り共通)。
・最終サイン:有効化した条件のAND。そのサイドで1つも有効化していなければサインは出ません。
実践ヒント
・まずは2条件(例:MACD+RSI)でテスト → 多すぎるならOBV/MomentumやATRフィルターを追加。
・トレンド重視:MACD/OBV/Momentumを主軸に。
・押し目・戻り目狙い:RSI/CCIを追加、Stochでタイミング調整。
・感度調整:RSIのOB/OSを広げる、ATR_MAを長くする等で厳しめに。
・出口は別設計:SL/TPは価格帯やR倍数などで管理を。
再描画と確定
確定足基準で判断すると安定します。足確定前はクロスが行き来することがあります。
免責
シグナルの機能は保証されません。イベントや流動性で無効化する場合があります。資金管理のうえ自己責任でご利用ください。
このインジケーターは試験公開のため、弊社の裁量で公開を停止する場合があります。

BND Trader (By Vahid.Jz) 🇮🇷🎉 The first Persian indicator on TradingView, released for free to celebrate my daughter's birthday. 🎉
**Trading Assistant (by Vahid.Jz)** is an all-in-one tool designed to simplify analysis and improve accuracy. It acts as an intelligent trading partner.
**Features:**
- Market Structure detection
- Multi-Timeframe “Third Eye” analysis
- Professional Order Blocks recognition
- Fair Value Gaps (FVGs) detection
- Customizable alerts
- Fully Persian interface
- Create Custom Alarm
Developed with love by **Vahid.Jz**, a trader and Pine Script enthusiast.
*“Trading is not a destination; it’s the journey — a path of learning, growth, and experience.”*
