8 EMA & 5 SMA ComboA combination of 8 EMA & 5 SMA to use with more advanced MA strategies and de-cluttering of indicator list.
To identify lines, Color combination should be somewhat warmer/lighter to cooler/darker colors.
EMA have a thicker line than the SMA. Color pairs have lighter/darker in cases where there are slight variations (when using one over another).
Sma

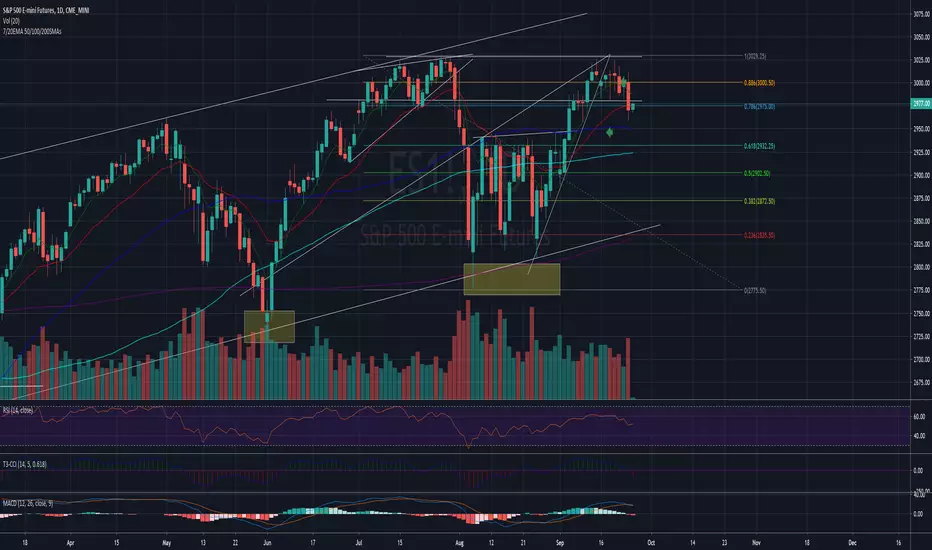
Moving Averages (21, 55, 200) with Parabolic SAR and Support/ ReA Simple indicator combining 3 of the most popular simple moving averages; (21,55, 200) with a tweaked Parabolic SAR as well as recent support & resistance points.
Developed to help see key areas of interest on COINBASE:BTCUSD quickly without needing to draw many manual trendlines in order to trade breakouts or bounces at key levels. But should be useful for any market.
This indicator is best used in combination with oscillators such as the MacD or RSI and also volume.

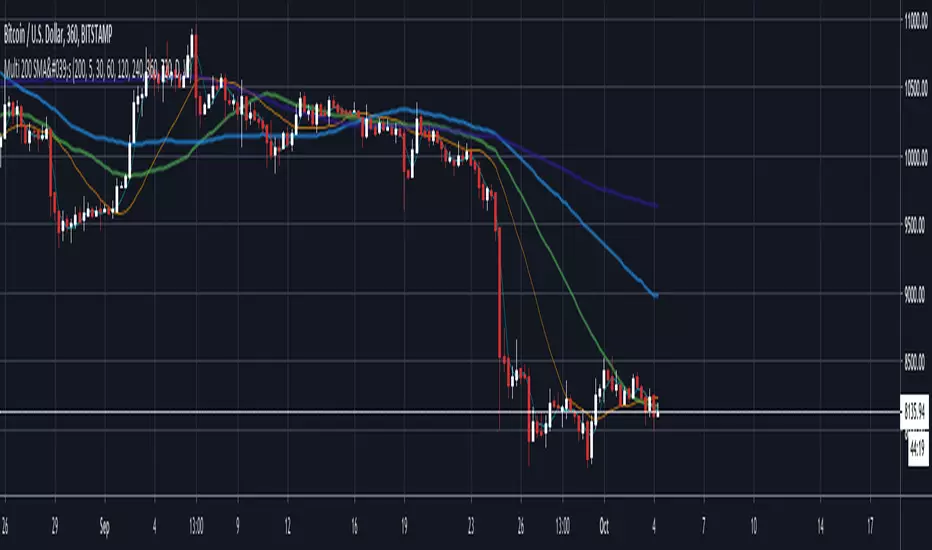
Multi 200 SMA'sIndicator that allows to print multiple timeframes MAs on a single chart instead of opening each timeframe separately
SMA colour changeThis SMA will change colour when the price crosses above and below.
When the Price is above, the SMA will be GREEN to indicate you should look for BUY entries.
When the Price is below, the SMA will be RED to indicate you should look for SELL entries.
The default is set to 50 SMA, this can be changed in the settings to suit your requirements.

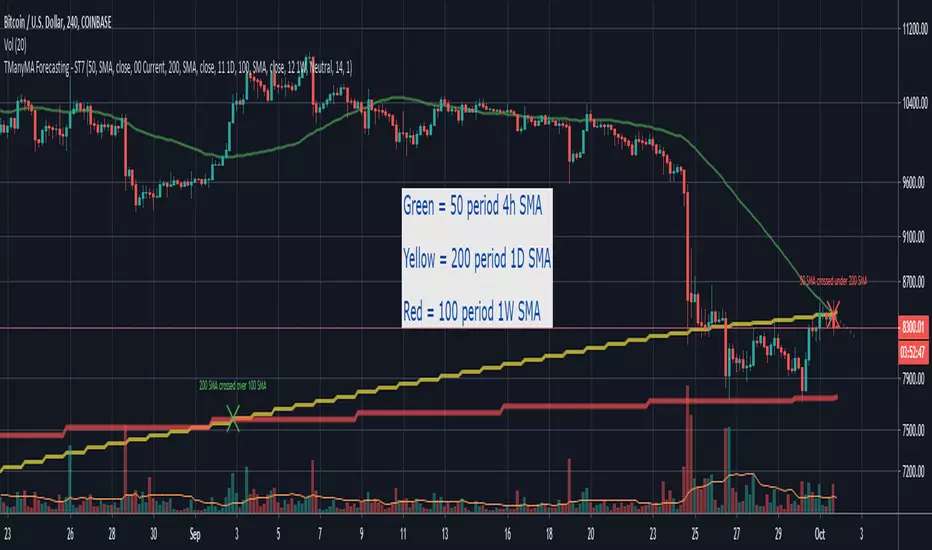
Scripting Tutorial 7 - Triple Many Moving Averages ResolutionsThis script is for a triple moving average indicator where the user can select from different types of moving averages, price sources, lookback periods and resolutions.
Features:
- 3 Moving Averages with variable MA types, periods, price sources, resolutions and the ability to disable each individually
- Crossovers are plotted on the chart with detailed information regarding the crossover (Ex: 50 SMA crossed over 200 SMA )
- Forecasting available for all three MAs. MA values are forecasted 5 values out and plotted as if a continuation to the MA.
- Forecast bias also applies to all forecasting. Bias means we can forecast based on an anticipated bullish, bearish or neutral direction in the market.
- To understand bias, please read the source code, or if you can't read the code just send me a message on here or Twitter. Twitter should be linked to my profile.
This script is meant as an educational script with well-formatted styling, and references for specific functions.
Multiple SMAs + X-Bar High/LowWhen starting my daily analysis, I typically open a daily chart and check where the price is compared to several SMAs, as well as check the high/low of today and the 10-day high/low. This indicator was designed to save chart space as well as make finding the highs and lows more efficient. Everything is adjustable, so you don't have to stick with my 10-bar rule.

別府 Multiple Moving AveragesThis is yet another script that implements multiple moving averages into one indicator. It also identifies SMA golden crosses and candles where price goes above or below the 200 SMA. It also has a few EMAs and SMAs with configurable periods in case you want to try something out and need a weird EMA or SMA. The default EMAs and SMAs use 50, 100, and 200 periods.


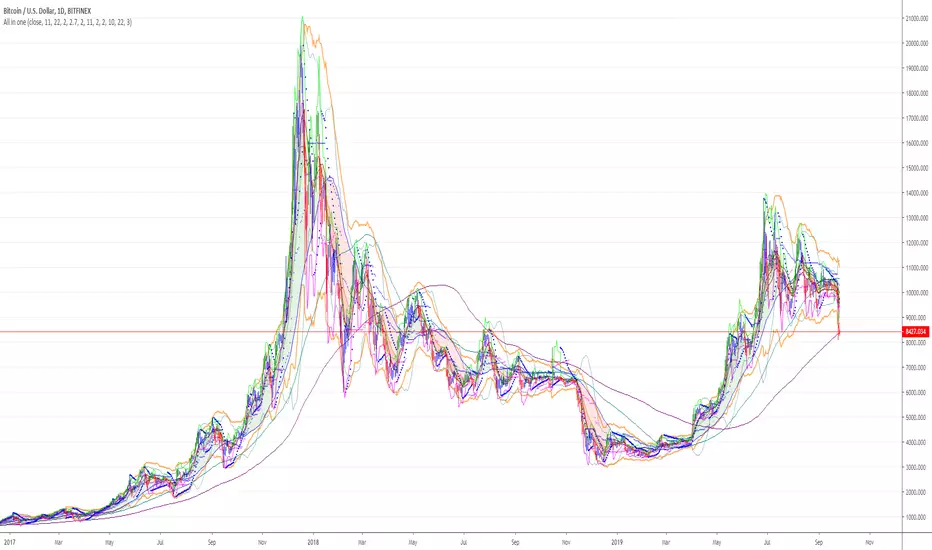
ENVELOPE BOLLINGER KELTN IMPULSE EMA SMA SAFEZONE SAR CHANDELIERALL THIS ALL IN ONE!
there are many options to check or uncheck to show only the tool that you need at that particular moment.
ENJOY!
ENVELOPE BOLLINGER KELTNER IMPULSE EMA SMA SAFEZONE SAR CHANDELIER
DT21 Moving Averages
I know a lot of people use the free version of TradingView, So I made a script to combine 5 Moving averages as 1 indicator for my followers
Scripting Tutorial 6 - Triple Many Moving Averages ForecastingThis script is for a triple moving average indicator where the user can select from different types of moving averages, price sources and lookback periods.
Features:
- 3 Moving Averages with variable MA types, periods, price sources and ability to disable each individually
- Crossovers are plotted on the chart with detailed information regarding the crossover (Ex: 50 SMA crossed over 200 SMA )
- Forecasting available for all three MAs. MA values are forecasted 5 values out and plotted as if a continuation to the MA.
- Forecast bias also applies to all forecasting. Bias means we can forecast based on an anticipated bullish, bearish or neutral direction in the market.
- To understand bias, please read the source code, or if you can't read the code just send me a message on here or Twitter. Twitter should be linked on my profile.
This script is meant as an educational script with well-formatted styling, and references for specific functions.

Volume-supported Fractal SRModified version of SynapticEX's Volume-supported Fractal S/R with EMA instead of SMA, pinescript 4 port, and EMA20/EMA50 defaults for support and resistance.
EMA20 = red/green
EMA50 = orange/yellow

MTF Bollinger Bands - ModifiedModified version of tansancrypto's MTF Bollinger to Pinescript 4 and removed limiters on BB1/BB2 max Sigma values.
Original Script:


MMA 20 50 200Multiple Moving Average 20 50 200 for quick access.
Copied from Tracks v1.0 05/20/2017.

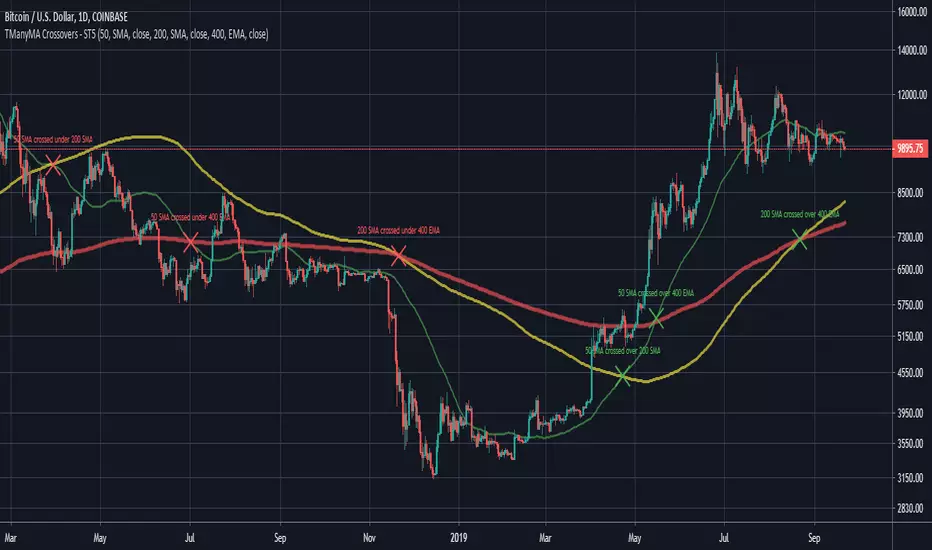
Scripting Tutorial 5 - Triple Many Moving Averages CrossoversThis script is for a triple moving average indicator where the user can select from different types of moving averages and periods. This script improves upon tutorial 3 by adding source selection for MAs and another option for an MA that is not built-in, the HMA . It is meant as an educational script with well formatted styling, and references for specific functions.
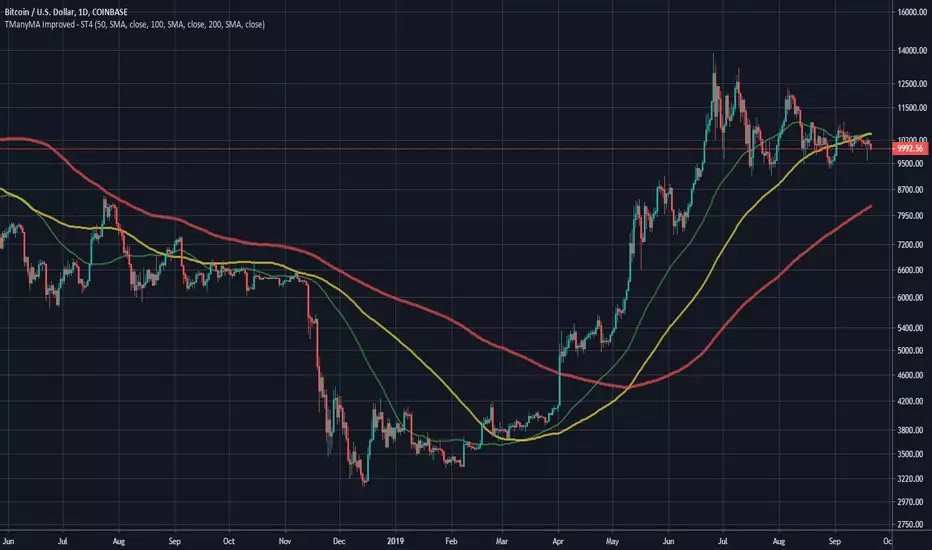
Scripting Tutorial 4 - Triple Many Moving Averages ImprovedThis script is for a triple moving average indicator where the user can select from different types of moving averages and periods. This script improves upon tutorial 3 by adding source selection for MAs and another option for an MA that is not built-in, the HMA. It is meant as an educational script with well formatted styling, and references for specific functions.
Scripting Tutorial 3 - Triple Many Moving AveragesThis script is for a triple moving average indicator where the user can select from different types of moving averages. It is meant as an educational script with well formatted styling, and references for specific functions.

Scripting Tutorial 1 - Simple Moving AverageThis script is for a simple moving average indicator. It is meant as an educational script with well formatted styling, and references for specific functions.

DT-21 Moving AveragesI know a lot of people use the free version of TradingView, So I made a script to combine 5 Moving averages as 1 indicator.

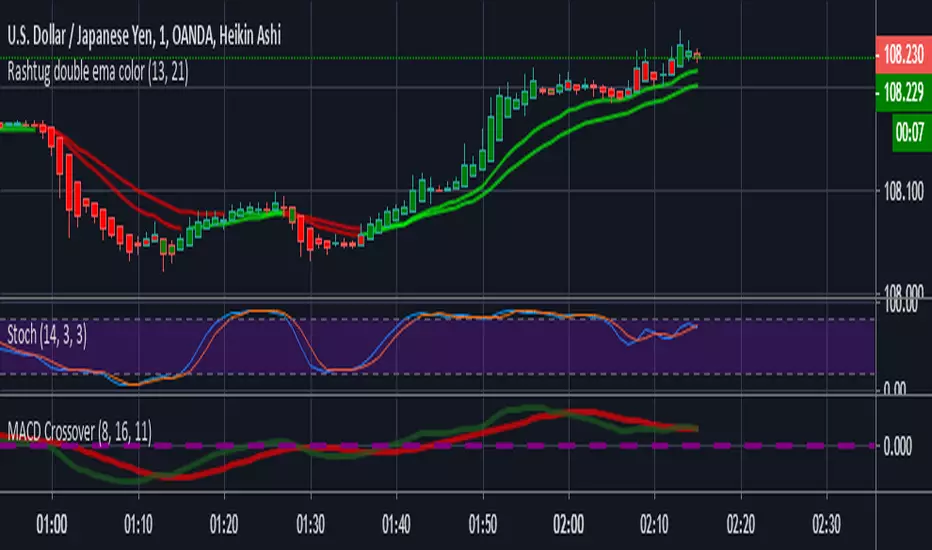
Rashtug double ema coloris a simple script with a 5 minute strategy
Timeline: 1M and 5M
Set the timeline to 1 minute when both line turn green BUY,
when both line turn red, SELL
when there is a break between the line, dont enter trade until both turn GREEN or RED
if you find it useful and you make money with it donate here
16jQEdTGmg2g6dmFCZzURXzaAYVxXWq167