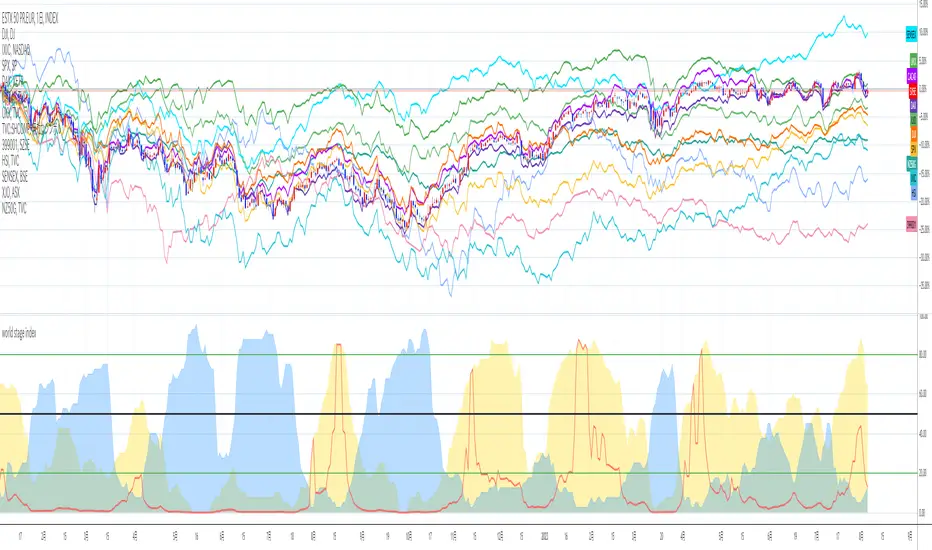
world stage index ver02This is an indicator that expresses the ratio of "stage1" and "stage4" of world index.
40 symbols are as follows
("TVC:SHCOMP" is revised to "SSE:000001")
(JAPAN, US, EUROPE, and CANADA)
OSE:NK2251!, DJ:DJI , NASDAQ:IXIC, SP:SPX , XETR:DAX, TVC:CAC40 , TVC:UKX, TSX:TSX
(ASIA)
SSE:000001, SZSE:399001, TVC:HSI, TWSE:TAIEX, BSE:SENSEX , OANDA:SG30SGD, INDEX:KSI, SET:SET
(EUROPE)
INDEX:SX5E, INDEX:FTSEMIB, SIX:SMI , BME:IBC, EURONEXT:BEL20, TVC:AEX, OMXCOP:OMXC25, XETR:0Q5X
(Pacific Ocean)
ASX:XJO, TVC:NZ50G, IDX:COMPOSITE, FTSEMYX:FBMKLCI, BMFBOVESPA:IBOV, BMV:ME , BVL:SPBLPGPT, BYMA:IMV
(Eastern Europe & Middle East)
MOEX:IMOEX, GPW:WIG20, OMXHEX:OMXH25, OMXSTO:OMXS30, DFM:DFMGI, TADAWUL:TASI, OSE:GNRI, EGX:EGX30
The criteria are as follows:
EMA5≧EMA20≧EMA40 : Stage1
EMA5≦EMA20≦EMA40 : Stage4
A.The sum of Stage1 was multiplied by 2.5 and drawn on a scale of 0 to 100, with yellow area
B.The Sum of Stage4 was multiplied by 2.5 and drawn on a scale of 0 to 100, with blue area.
C. The ratio of A/B was multiplied by 2.5 and drawn on a scale of 0 to 100, with red lines.
This idea is from Kojirou Kousi.
40 symbols of this script are partially different from Kojiro kousi's idea.
But he said the difference isn't matter.
tradingview社の上海総合指数の銘柄コード変更に合わせて、"TVC:SHCOMP" を "SSE:000001"に改訂しました。
「小次郎講師指数」に着想を得た、世界40カ国の株価指数stage状態です。
参考文献は、小次郎講師著書「世界一わかりやすい投資の勝ち方」です。
小次郎講師とは一部異なるシンボルを採用していますが、
多少の違いは余り大した問題では無いと御本人から教わった事があります。
先進国に関してはおそらくほとんど同じだと思います。
stage1の合計の%を黄色、stage4の合計の%を青色、stage1の合計/stage4の合計の%を赤で表示しています。
雰囲気で分かればいいので、正確な数字までは表示しませんでした。
個人的には現状分析以外にも、プラクティス時に世界情勢を把握するのに重宝しています。
株式
EPS DashboardThis script creates a little table in an indicator below your chart that allows you to view the earnings per share over the last year as well as calculates the year over year earnings per share growth. According to IBD, strong EPS growth is a great indicator of a potential super-performer stock so hopefully this will make it easier to keep an eye on this metric. Note it does not work on things without financial data like crypto, indexes, and ETFs.

S&P 500 Earnings Yield SpreadThis indicator compares the attractiveness of equities relative to the risk-free rate of return, by comparing the earnings yields of S&P 500 companies to the 10Y treasury yields. "Earnings yield" refers to the net income attributable to shareholders divided by the stock's price - effectively the inverse of the PE ratio. The tangible meaning of this metric is "the annual income received by (attributable to) shareholders as a percent of the price paid to receive said income." Therefore, earnings yield is comparable to bond yields, which are "the annual income received by bond holders as a percent of the price paid to receive said income."
This indicator subtracts the earnings yield of S&P 500 companies from the current 10-year treasury bond yield, creating a "spread" between the yields that determines whether equities are currently an attractive investment relative to bonds. That is, if the S&P 500 earnings yield exceeds the 10Y treasury yield, then equity investors are receiving more attributable income per dollar paid than bondholders, which could be an indication that equities are an attractive purchase relative to the risk-free rate. The same applies vice-versa; if the 10Y treasury yield exceeds that of the S&P 500 earnings yield, then equities may not be an attractive investment relative to the risk-free rate.
Since data on S&P 500 companies' earnings yields are pulled on a monthly basis, this indicator should be used on a monthly timeframe or longer. Historical data has shown that the critical zones for the indicator are at -4% and +3%, i.e. when equities are trading with a 4% greater yield than 10Y T-bonds and when equities are trading with a 3% lower yield than 10Y T-bonds, respectively. In the "Oversold" case (-4%), equities are trading at a steep discount to the risk-free rate and has often represented a strong buying opportunity. In the "Overbought" case (+3%), equities are trading at a premium to the risk-free rate, which may be an indication that caution should be exercised within the stock market. When the indicator first crosses into "Oversold" territory, this has historically been near a the bottom of a crash on the S&P 500. When the indicator first crosses into the "Overbought" territory, this has often precipitated a correction of 15% on the S&P 500.
Some notable "misses," crashes that this indicator missed, include the 1973 stock market crash and the 2008 global recession. However, both of these cases were largely precipitated by unprecedented economic events, as opposed to stocks simply being "Overbought" relative to treasury yields. Nonetheless, this indicator should form only a small portion of your fundamental analysis, as there are many macroeconomic factors that could lead to major corrections besides the impact of treasury yields. Furthermore, it should also be noted that since markets are "forward looking," future earnings growth or interest rate hikes may become "priced into" both the stock and bond markets, affecting the outputs of this indicator. However, since both the stock and bond markets should account for these factors simultaneously, the impact has historically been minimized.
I hope you find this indicator to be beneficial to your strategies. Stay safe, and happy trading.

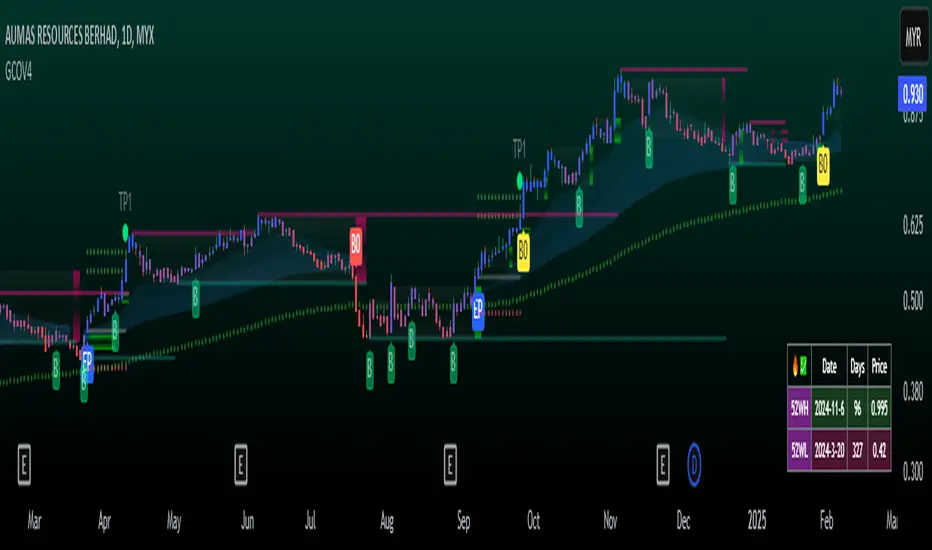
GCOV4 PROTECH GCOV4 PROTECH SYSTEM
This indicator is built specifically for SWING, PULLBACK and BREAKOUT strategy trading in the stocks/equity market. It uses an indicator instrument consisting of ATR TRAILING STOP (ATR), EXPONENTIAL MOVING AVERAGE(EMA), PIVOT POINT and VOLUME ANALYSIS.
The parameters that have been upgraded are to meet the needs of trading strategies whether short or long term trading. In addition, it is built to reduce the risk of trading activities and help traders to adhere to the best trading plan.
This transformation involves 3 trading strategy modes namely SWING PRO, PULL & BOUND and BREAKOUT STRATEGY.
Rebuild of Instrument & Parameter
This indicator is also an upgraded instrument that is sourced from the previous indicator, the GOLDENCO AIE2 INDICATOR.
This R&D of course to make trading activities more effective, dynamic and to increase the confidence of traders in current trading activities. The indicator has been upgraded in terms of parameters as well as additional instruments. Among them are;
1. ATR Trailing Stop
2. Exponential Moving Average – fastMA/slowMA Length
3. Label@Entry Price/Stoploss/Takeprofit line;
>The take profit and stop loss rates are based on percentages. However
traders can change the percentage rate according to their respective
trading plans.
>existing percentage rates have been set(build-in) for standard rate.
So you have to reset based on the type of stock/market cap either penny
stock or blue chip stock.
>The candle/bars have been colored to make it easier for traders to see price
trends whether in bullish or bearish conditions.
Hopefully with the upgrading of these indicators will make traders more successful in trading activities, especially in the equity markets.
DISCLAIMER;
ALL NOTES AND INDICATING TOOLS ARE FOR EDUCATIONAL ONLY AND AS A FACILITATOR AND PREPARATION IN TRADING ACTIVITIES. ADMIN IS NOT RESPONSIBLE FOR ANY RISKS IN YOUR TRADING ACTIVITIES. TAKE AT YOUR OWN RISK.
FunTrader/Aieyee @2022
[Joy] AladdinDirectly used for entertainment purposes in figuring out the market trend:
Sell/bearish sign: I open a short position on the candle's close. I am bearish on the instrument.
Buy/bullish sign: I open a long position on the candle's close. I am bullish on the instrument.
Red circle: If I run a long position, I take at least 50% unrealized profit into a realized profit on the close candle. I might even convert some portion of the underlying spot into stable coins. I am essentially taking profit along the way as the trend is developing.
Green circle: If I am running a bearish short position, I take at least 50% unrealized profit into a realized profit on the candle's close. I am essentially taking profit along the way as the trend is developing.
Below are used for indications only:
Down Arrows: It is not directly used in opening/closing positions. When the down arrow finishes and the candle close, it sometimes indicates a local top. It does not mean the macro trend has changed.
Up Arrows: It is not directly used in opening/closing positions. When the up arrow finishes and the candle close, it sometimes indicates a local bottom. It does not mean the macro trend has changed.
Red Crosses: It indicates a squeeze may be incoming. When the red crosses finish, the price may move significantly in any one direction. It does not say which direction. It only gives me caution.
Experimental - Below Work in Progress may be from the config only:
>> Jasmine - Tweak of Aladdin
>> Candle color - Logic is different from Aladdin
>> Background color - Logic is different from Aladdin
FAQs
Q: Does it use some EMA /MA/Ichimoku/Parabolic SAR, etc? Does it use any indicator with tweaked settings?
Answer: No.
Q: What does it mostly use?
Answer: Volume and gradual flow of non-interrupted data. The logic depends on the correlation between volume , price bars and the wicks.
Q: Can you make it free or make it open source?
Answer: There is no free lunch in this world. I will never reveal or share the source code or make it free for all!
Q: Do you provide ongoing support for the indicator?
Answer: Yes, I will continue updating the indicator as long as I can. However it depends entirely on me. I may stop updating as well.
Q: Are the bullish /buy & the bearish /sell markers automatic?
Answer: Yes. I do not control it!
Q: Is this financial advice?
Answer: Any views expressed by the indicator are personal entertainment views & shouldn't form a basis for making investment decisions, nor be construed as a recommendation or advice to engage in investment transactions. It is not financial advice. I highly recommend not even think of using this for actual real-life trading with real money. Neither I nor the indicator is responsible for any misuses, including any profit/loss. There is no warranty on this entertainment product

AnyChartI changed few lines of code from TradingView's original Open Interest indicator to make this one. I wanted to compare other charts to while entering my trade like looking at BTC when trading in alts. It has option to view any chart. Add other things to improve your analysis.

JPM VIX Signal - Non OverlayJPMorgan Chase & Co . strategists have identified what they say is a near bulletproof indicator to strengthen their argument that stock markets are poised to rally.
The buy signal is triggered when the Cboe Volatility Index ( VIX ) rises by more than 50% of its 1-month (30 day) moving average, which it last did on January 25th 2022, according to the strategists led by Mislav Matejka. The indicator has proven 100% accurate outside of recessions over the last three decades.
Instructions:
Symbol - SPY
Timeframe - Daily
Signal - Indicator exceeds horizontal line of 1.5

JPMorgan VIX Buy SignalJPMorgan Chase & Co. strategists have identified what they say is a near bulletproof indicator to strengthen their argument that stock markets are poised to rally.
The buy signal is triggered when the Cboe Volatility Index (VIX) rises by more than 50% of its 1-month (30 day) moving average, which it last did on January 25th 2022, according to the strategists led by Mislav Matejka. The indicator has proven 100% accurate outside of recessions over the last three decades.
Instructions:
Symbol - VIX
Timeframe - Daily
Red Triangle - Close / 30 Day SMA >= 1.5

HighLow Box Highlight between EarningsHighLow Box Highlight between Earnings
This is an indicator to highlight area between two earning periods and their highest and lowest points.
It also alternates the highlight color in each subsequent block.
Tested to work in 1D charts and 1M charts
Just drop a message, if you want this further developed with more features.
Note: This was requested by user Meatpye on a forum.

Session Levels - Ultimate Range IndicatorSession Levels - Ultimate Range Indicator
Primarily developed for trading the E-MINI Futures Markets like NQ or ES from the CME Group,
but also more than suitable for Crypto or other instruments.
This indicator highlights the chosen session, which can be Globex, Asian, London and New York.
It plots the important levels and also renders the Opening Range as it forms (a.k.a. Initial Balance).
After the 1st hour Opening Range is finished, it can plot the Standard Deviations / Projections.
See below for a complete feature list.
All Opening Ranges on chart and for the New York session the Range Projections are turned on:
s3.tradingview.com
How to use (example):
If you are trading the Nasdaq Futures (NQ!)
Enable the Globex Overnight session. Basically in the Futures Market, the Globex session is everything outside of US trading hours of Stocks. This draws the important overnight levels, like the Low, 25%, 50%, 75% and the High.
Enable the New York Session with Levels and Opening Range. Generally, 70% of the time the 1st hour will put a Low or High of the day.
If the price is trading above the Globex Low, most likely the Low of the Day is formed and the price target for the day will be 1.5x Standard Deviation and 2x Standard Deviation.
[*} Deviation of the Initial Balance depends on the volume ad overall market structure.
** This is not financial advice or any guarantee **
Features:
Show each Session Highlighted on Intraday chart in it's own color (each session can be turned off and has customizable times and color)
Show Line Levels of each session: Low, 25%, 50%, 75% and the High (customizable color)
Show the Opening Range (Initial Balance) of the Asian, London and New York session. Note: NY has more options.
Opening Range is displayed as a box with level lines (customizable color)
Levels are drawn to the end of the NY Cash session (customizable time)
Show IB Standard Deviations 0.5 - 3.0. Calculated from the Opening Range (Initial Balance)
Option to display Higher Timeframe levels: Previous Day Open/Close and Previous Week Open/Close
All level lines and OR boxes size dynamically as the session progresses
Built in Alerts for when price hits key levels. e.g. Alert when price crosses the NY Opening Range High. Or an Alert when the first STDEV is hit.
Option to toggle display of drawings for Today's trading session only, or Show all recent session levels. This keeps the chart clean or not.
Extras:
The NY Opening Range also has a 50% level line
The NY Opening Bar can be highlighted separately
The Level Lines can have small labels turned on/off. Values are only shown on mouse over to keep a clean chart
Keep in mind:
1) This indicator works on all instruments, but on instruments with limited market hours, your chart setting
has to be set to "Extended Hours" otherwise. For example TSLA on NASDAQ.
2) The Exchange Time Zone for the CME Group is Chicago UTC-6. So the session times you configure in the settings menu are based on that timezone too.
3) Globex opens at 5pm CST and closes when the US session starts 8:30CST.
4) When enabling the Alerts in the Indicator settings, be sure to also create an alarm for this indicator using the Alarm function of Tradingview.

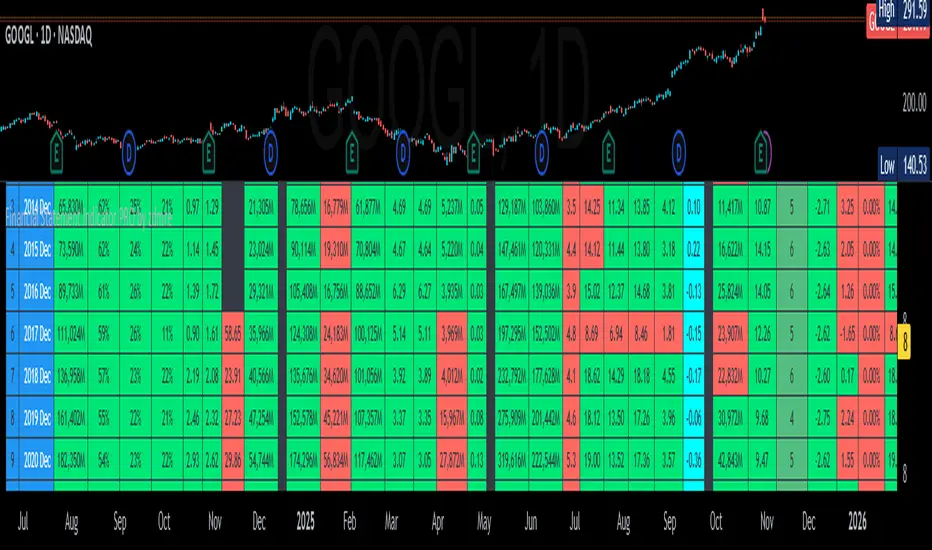
Financial Statement Indicator by zdmreKnowing how to work with the datas in a company's financial statements is an essential skill for stock investors. The meaningful interpretation and analysis of balance sheets, income statements, and cash flow statements to discern a company's investment qualities is the basis for smart investment choices.
You can access to the financials tables of the companies as a summary with this indicator.
3 Tables;
Income Statement Table:
Revenue
Net Profit
EPS
EPS-D
P/E
Balance Sheet Table:
Current Asset
Total Asset
Total Equity
Book Value per Share
Total Debt
Debt/Equity
Statistics & Cash Flow Table:
Return On Equity
Return On Asset
Return On Invested Capital
Quick Ratio
Free Cash Flow
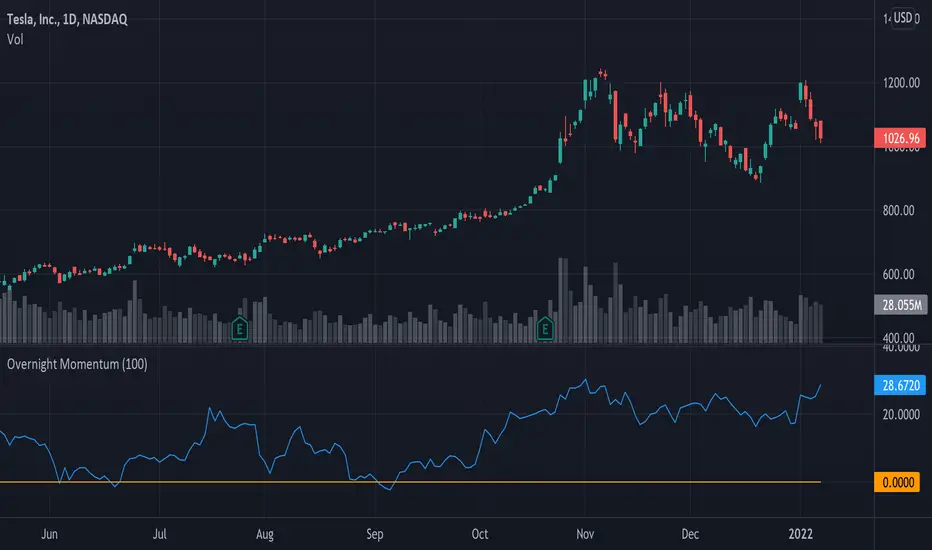
Overnight MomentumOvernight Momentum is an indicator designed to be used on stocks with the daily timeframe. It shows the total overnight return expressed as a % for the past 100 days by default, however this is a setting that can be changed by the user.
A lot of people don't realise that the vast majority of total stock market returns come from the overnight session, in fact research from the NY Times and plenty of other sources shows that since 1993 all of the returns from the S&P 500 Index $SPY have come overnight and cumulative intraday returns are actually in fact slightly negative. Furthermore, some stocks show much stronger overnight returns than others and at certain times too, generally speaking when the overall market is strongly trending up overnight returns are better. Research also shows that stocks that have good overnight return momentum tend to continue.
All this research lends itself to some trading strategies such as buy the close and sell the open on stocks with strong overnight momentum. The idea is to go through a screener of up-trending stocks each day and look for stocks with high readings above 30 on the Overnight Momentum Indicator, which means that the cumulative return for the past 100 days is above 30%. Then one could buy the closing price using a market-on-close order and then sell the next day using a market-at-open order, participating in the closing and opening auctions at stock exchanges which are the most liquid times of day with the most solid fills on offer. Some of the best returns from this overnight gap up strategy can come from smaller stocks with very strong short term momentum and prices that are closing near all time highs on days with much larger than usual volume.
This indicator can also be used to see which stocks have robust momentum overall, as sometimes there can be divergences between Overnight Returns and Total Returns, for example if the Overnight Momentum Indicator turned negative that could be a sign of a trend changing from bullish to bearish and vice versa. Generally speaking strong up-trending stocks are accompanied by strong overnight returns too.
Since forex, crypto and futures trade almost continuously it's not recommended to use this indicator on those markets, only use it on stocks which have clear closing and opening times in order for the indicator to measure overnight returns.
To get access PM or email me to my address shown below.
Enjoy :)
Disclaimer: All my scripts and content are for educational purposes only. I'm not a financial advisor and do not give personal finance advice. Past performance is no guarantee of future performance. Please trade at your own risk.
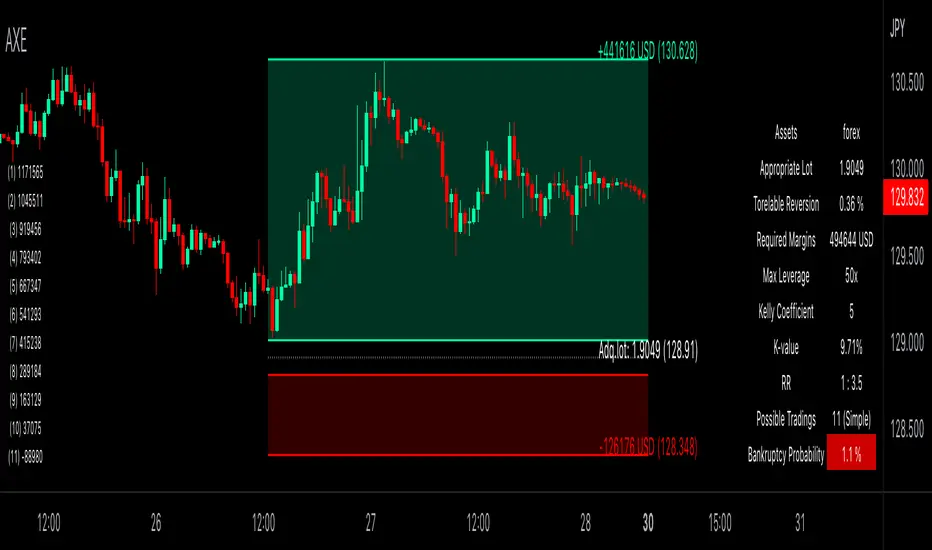
Auxiliary Equity Configurator (AXE)Auxiliary Equity Configurator (AXE) is a whole new level money management auxiliary that calculates statistically preferable lot based on the Account balance, Winning rate, Risk reward ratio, and Kelly multiplier configured a priori in the input panel.
On the chart, RR visualization bands, Expected balance history matrix in the worst successive trading loss (for displaying how many times you can trade with a given lot at simple/compound interest), and Info-table for the calculation details are shown.
Regarding RR visualization bands, whenever the Tolerable drawback input changes, the proper lot is calculated based on the given data. You can easily access how many lots you should possess and the take-profit/stop-loss price to set. A tolerable drawback can be placed in the quoted currency rate of the displayed chart, except the forex and part of CFD symbols (Gold, Silver, Platinum, WTI oil, Brent oil, Natural gas, and more in the future!) that is valued in Pips. Parameters are configurable in suit with the broker you are using. Also, RR visualization bands are brilliantly interactive, thanks to pine v5 interactive scripts.
The currency for Account balance and Tolerable drawback is automatically converted to USD for internal calculation; therefore, no mess-ups around thinking currency value conversion whatsoever! The design for each tool is highly customizable, too.
Unleash yourself from consuming the colossal amount of time thinking of money management with AXE!
Gap Absorption StrategyLike the nature, markets don't like the void, and this is something we can take advantage of by trading gaps on some markets.
This technique is well known, so I wanted to write a tiny script based on this strategy to get a bit more comfortable with it.
IMPORTANT: Default parameters wont give you good trades on every markets, you need to modify these parameters to see which proportions correspond to the stock you're trading.
This script triggers signals on predefined variation of a stock price after a gap, and allows its user to configure TP and SL prices corresponding to a specific percentage of this gap movement.
Note: We can observe that opening gaps are often the most interesting.
Options
Trigger: the price variation you want to trigger on (in % of the price)
Stop Loss : in % of the gap
Take profit : in % of the gap
A small table is displayed in the top right corner of the chart to give you TP/SL/Signal prices for each opportunity
SL (red line) and TP (green line) are also displayed on the chart when a signal is triggered
Information concerning the current opportunity is given at the bottom of the chart
Note: This script is based on the Gap-Size-Indicator that I published a few weeks ago.

SMART4TRADER - BREAKOUTThis indicator shows the breakthrough of extremes for the selected period. The default period is set = 3
The indicator checks on the current bar whether the maximum or minimum prices for the selected period are broken
----------------
Данный индикатор показывает прорыв экстремумов за выбранный период. По-умолчанию выставлен период = 3
Индикатор проверяет на текущем баре пробиты ли максимальные или минимальные значения цен за выбранный период

Trend intensity 65 TI65––––History & Credit
This indicator has been inspired by public videos of StockBee and his community. Stockbee is a famous successful trader, who has approach to detail and backtesting. The TI65 is a great confirmation tool for the trend strenght.
–––––What it does
TI65 is an indicator that measures trend and momentum over 65 days.
When there is a green cloud we have a confirmed uptrend with certain velocity.
The calculation is simple as it measures the ratio between the 7d SMA over the 65D sma.
–––––How to use it
Look for entry points when during green trade intensity.

Мarket Breadth LabelsHistory and credits
The idea about this indicator, came from a friend teodorgun. www.tradingview.com
Special thanks to QuantNomad, whose courses got me started on programming on PineScript. www.tradingview.com
What it does
The indicator plots various values from market breadth indicators.
It shows the % stocks above certain moving averages for different indexes.
The first 3 cells, display the Advance Decline Ratios:
1. Total Advance Decline Ratio
2. NYSE Advance Decline Ratio
3. Nasdaq Advance Decline Ratio
- coloring for these is simple (value > threshold = color is green, value < threshold = color is red)
The rest of the columns display % stocks above the moving averages.
For example a value of 20 in column 4 ("Stocks above 5D MA), means that only 20% of the stocks are above their 5D moving average.
Line 1 shows current value of the indexes.
Line 2 shows value 5days ago (assuming that 5 trading days = 1 trading week).
- Line 1 Coloring: coloring here is divided between 2 tresholds ( value < lower treshold = color is red, value > lower treshold AND value < higher treshold = color is yellow, value > higher treshold = color is green)
- Line 2 Coloring: no coloring logic is applied here.
How to use it
There are several techniques for breadth indicators, many can be read online, but generally these indicators are considered contrarian. This means that high values indicate overbought conditions and low values indicate oversold conditions.

Diluted Earnings Per Share Signal [AstrideUnicorn]Earnings Per Share (EPS) is a financial metric closely monitored by investors. The so-called "positive earnings surprise" - a situation when EPS reading for a stock beats the value forecasted by analysts gives a bullish signal for this stock. The EPS reading lower than the analysts' estimate gives a bearish signal.
The Diluted Earnings Per Share (Diluted EPS) metric calculates a company's potential earnings per share value in the case if all convertible securities get converted to common shares. Convertible securities include preferred shares, stock options, warrants, convertible debt, etc. Diluted EPS is a more scientific way to estimate earnings per share, and it is usually lower than the ordinary EPS.
The Diluted EPS Signal indicator (DEPSS) is a fundamental indicator that calculates trading signals by comparing the Diluted EPS to the EPS Estimate. In many cases, Diluted EPS gives better insight into how a reported EPS reading may impact the stock price.
HOW TO USE
For each earnings date, the indicator calculates the Diluted Earnings Surprise percentage value :
Diluted Earnings Surprise = (Diluted EPS - EPS Estimate)/ EPS Estimate.
Diluted Earnings Surprise higher than the specified threshold value is a bullish signal. In this case, the indicator displays a green triangle pointing up.
Diluted Earnings Surprise lower than the specified threshold value is a bearish signal displayed as a red triangle pointing down.
As one can see on the chart, there are a lot of situations where EPS readings with green labels (the ones that beat analysts' estimates) lead to down moves. The DEPSS indicator can spot weak earnings and give opposite signals.
SETTINGS
Earnings Surprise Threshold (%) : the threshold value (in percentage units) for the Diluted Earnings Surprise. The calculated Diluted Earnings Surprise must be higher than Earnings Surprise Threshold to be considered a BUY signal or lower than minus Earnings Surprise Threshold to be considered a SELL signal. The default value for Earnings Surprise Threshold is 20%.

Contrarian Scalping Counter Trend Bb Envelope Adx and StochasticContrarian Scalping is an trading strategy designed to take advanted of a counter-trend.
The advantage of these strrategies types is that they have a good profitability but with do not great gain (in relation at the time frame).
Indicators used:
Bollinger
Envelope
ADX
Stochastic
Rules for entry
For short: close of the price is above upper band from bb and envelope, adx is below 30 and stochastic is above 50
For long: close of the price is below lower band from bb and envelope, adx is below 30 and stochastic is below 50
Rules for exit
For short: either close of the candle is below lower band of bb or enveloper or stochastic is below 50
For long: either close o the candle is above upper band of bb or envelope or stochastic is above 50
If there are any questions let me know !

Triple CSWhat this indicator does:
This indicator will be scanning for ranges of extremity.
It measures multiple underlying factors in the financial markets like measuring levels of strength using RSI, momentum using Stochastics and extreme ranges using Bollinger Bands.
What is "extreme range" criteria: ranges above 70 or below 30 on RSI and Stoch are considered extreme, as well as moments of extreme volatility exceeding overbought and oversold levels on BBs.
All monitored data is to be plotted in a horizontal row, providing information about oversold, overbought and mid-range market conditions. This data will either meet the criteria simultaneously and plot a Red or Green indication or it will miss one or more requirements, plotting Gray indications.
This indicator is a real-time indicator, meaning it's updating live and due to this tracking in real-time, indications not yet 'printed' can give false readings. For performance purposes, it is best practice to allow all indication plots to 'print', meaning if a plot ever changes in color, it's best to allow that candle to fully close , ticking to 0:00 before confirming the accuracy of the indicator's findings.
How it works:
This indicator scans multiple sources of data simultaneously. When appropriate conditions within a trading range are met, the indicator will update it's color.
The indicator will plot Gray , Green , and Red indications which can be explained below.
-
Grey plots : No indication of full extremity, meaning one or more conditions being tracked has not met requirements, suggesting price is likely in mid-range.
-
Green plots : Extremity level lows have been simultaneously met, data indicates extreme oversold conditions are likely present.
-
Red plots : Extremity level highs have been simultaneously met, data indicates extreme overbought conditions are likely present.
What market will this indicator work on?
Stocks > Forex > Crypto
All the above are supported by this indicator.
Charts with more history have more data for the indicator to utilize. (Lack of data can result in poor performance.)
- This indicator performs best on 4H, 12H, D, and W timeframes, although you can use this indicator on any timeframe TradingView supports.
This indicator was created to find ranges of extreme trade which can help traders be more confident in their timing with the market.
Trading can be difficult, let an algorithm scan the market and monitor for early signs of volatility changes.
Past performance does not guarantee future results. Please do your due diligence when placing trades.

RSI Average Swing BotThis is a modified RSI version using as a source a big length(50 candles) and an average of all types of sources for candle calculations such as ohlc4, close, high, open, hlc3 and hl2.
In this case we are going to use a 0-1 scale for an easier calculation, where 0.5 is going to be our middle point.
Above 0.5 we consider a bullish possibility.
Below 0.5 we consider a bearish possibility.
I made a small example bot using that initial logic, together with 2 exit points for long or short positions.
If there are any questions, let me know !

Trendalix EntriesThis script is made to simplify the analysis of trends. It changes the mas based on whether you're looking at stocks or crypto. As these 2 markets currently move differently, they need a slightly different approach.
Crypto trends:
Can move much faster than stocks. Ideally the price should be bouncing above the williams alligators (about the 20-30 MAs).
Stocks:
These swing more than crypto so you need to get deep into these swing to be buying at the bottom of a move. The MAs are much larger, between the 50ma and 400ma. It's much more important here that the slower MAs are strong, i.e 200ma is above the 400ma, than it is that the faster MAs are okay.
For stocks an entry and stop line is drawn. These are only visible when the market is sufficiently in a pullback.

Smart Swing Strategy for StockSpecial indicator for stock but you can try another instrument.
Trend determination and buy/sell signals are using the Alligator system from Bill Williams .
To get maximum profit, the system uses the trailing stop technique using Average True Range (ATR) with 4 moving average options (RMA, SMA , EMA , WMA ).
Please leave comments if any opinions.
Disclaimer
The content is in any event provided with the intention of being for general circulation and availability only. As such it is not intended to and does not form part of any offer or recommendation directed at you specifically, or have any regard to your investment objectives, financial situation, or needs of yourself or any other specific person. Before committing to a trade or investment, please seek advice from financial or other professional advisers regarding the suitability of the trade for you. If you do not wish to seek such financial advice, please consider carefully whether the product is suitable for you as you alone remain responsible for your trading gains and losses.
