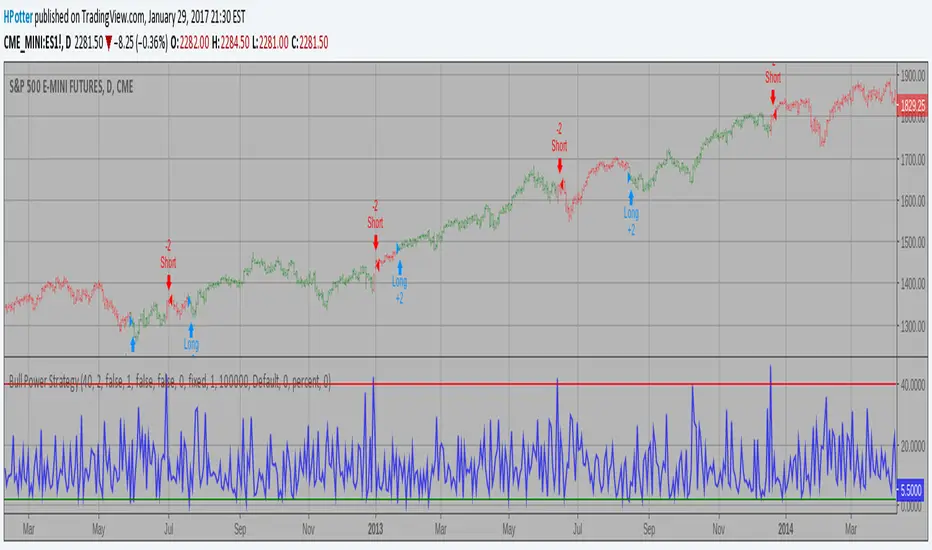
Bull Power Strategy Backtest Bull Power Indicator
To get more information please see "Bull And Bear Balance Indicator"
by Vadim Gimelfarb.
Strategy
Bear Power Strategy Backtest Bear Power Indicator
To get more information please see "Bull And Bear Balance Indicator"
by Vadim Gimelfarb.

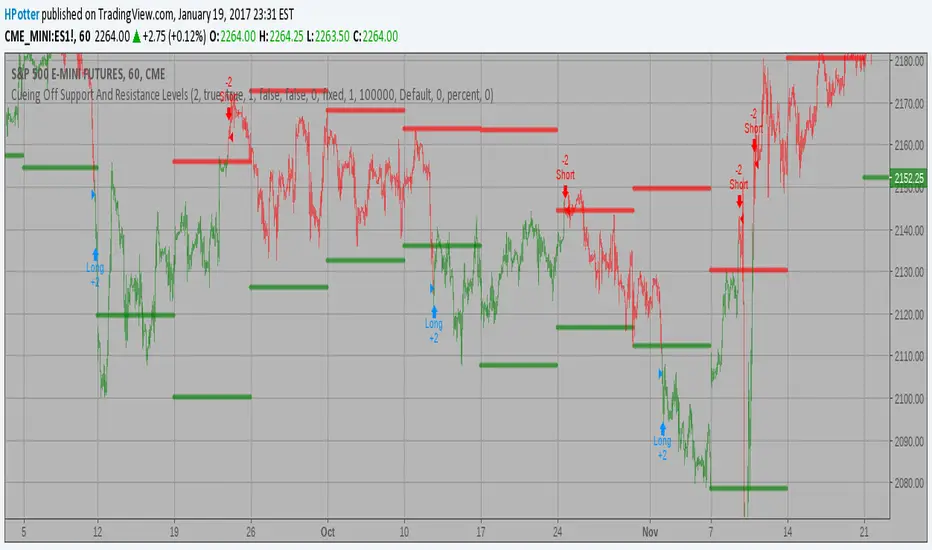
Cueing Off Support And Resistance Levels Backtest Cueing Off Support And Resistance Levels, by Thom Hartle
modified by HPotter for trade signals.
The related article is copyrighted material from Stocks & Commodities.
You can change long to short in the Input Settings
Please, use it only for learning or paper trading. Do not for real trading.
Z-Score Strategy Backtest The author of this indicator is Veronique Valcu. The z-score (z) for a data
item x measures the distance (in standard deviations StdDev) and direction
of the item from its mean (U):
z = (x-StdDev) / U
A value of zero indicates that the data item x is equal to the mean U, while
positive or negative values show that the data item is above (x>U) or below
(x Values of +2 and -2 show that the data item is two standard deviations
above or below the chosen mean, respectively, and over 95.5% of all data
items are contained within these two horizontal references (see Figure 1).
We substitute x with the closing price C, the mean U with simple moving
average (SMA) of n periods (n), and StdDev with the standard deviation of
closing prices for n periods, the above formula becomes:
Z_score = (C - SMA(n)) / StdDev(C,n)
The z-score indicator is not new, but its use can be seen as a supplement to
Bollinger bands. It offers a simple way to assess the position of the price
vis-a-vis its resistance and support levels expressed by the Bollinger Bands.
In addition, crossings of z-score averages may signal the start or the end of
a tradable trend. Traders may take a step further and look for stronger signals
by identifying common crossing points of z-score, its average, and average of average.
You can change long to short in the Input Settings
Please, use it only for learning or paper trading. Do not for real trading.

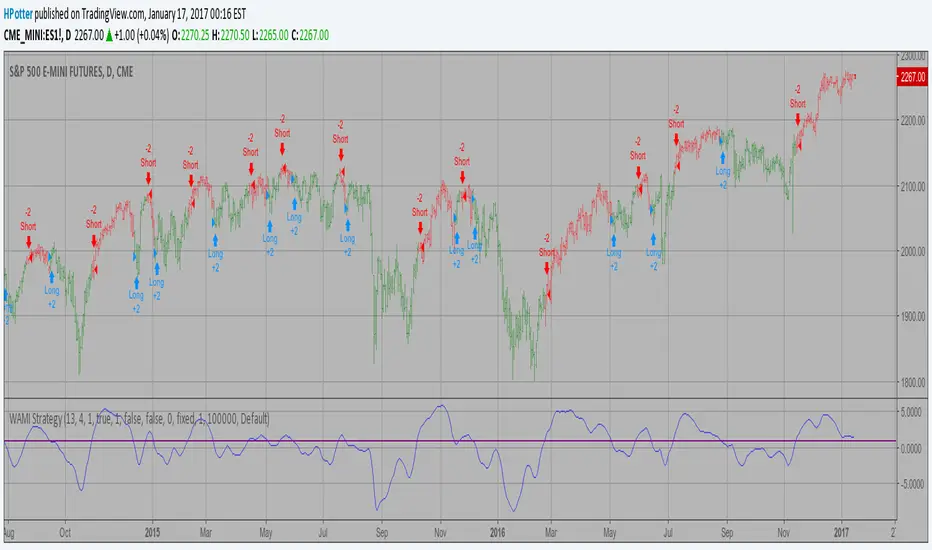
WAMI Strategy Backtest The WAMI-based trading lies in the application and iteration of the
optimization process until the indicated trades on past market data
give consistent, profitable results. It is rather difficult process
based on Fourier analysis.
You can to change Trigger parameter for to get best values of strategy.
You can change long to short in the Input Settings
Please, use it only for learning or paper trading. Do not for real trading.
Trend Trader Strategy Backtest This is plots the indicator developed by Andrew Abraham
in the Trading the Trend article of TASC September 1998
You can change long to short in the Input Settings
Please, use it only for learning or paper trading. Do not for real trading.

Strategy Stochastic Crossover Backtest This back testing strategy generates a long trade at the Open of the following
bar when the %K line crosses below the %D line and both are above the Overbought level.
It generates a short trade at the Open of the following bar when the %K line
crosses above the %D line and both values are below the Oversold level.
You can change long to short in the Input Settings
Please, use it only for learning or paper trading. Do not for real trading.

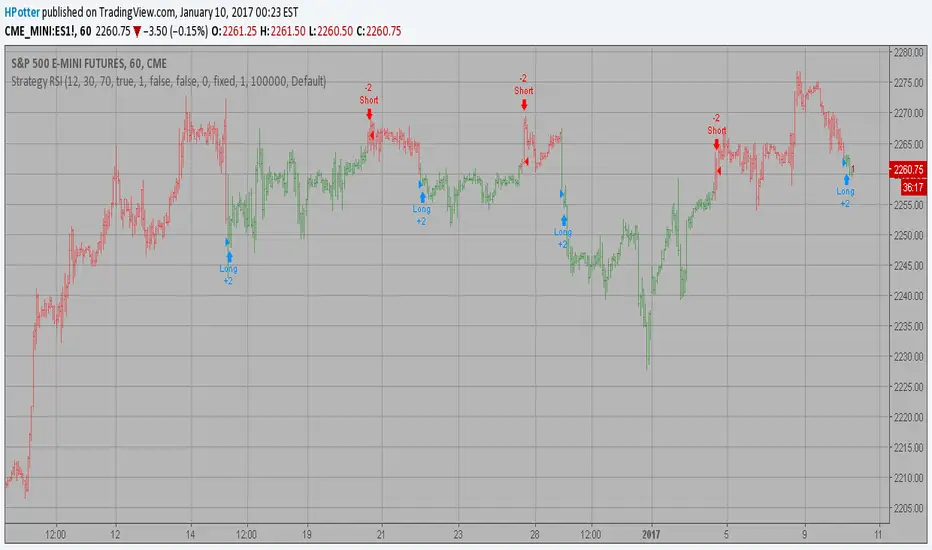
Strategy RSI Backtest The RSI is a very popular indicator that follows price activity.
It calculates an average of the positive net changes, and an average
of the negative net changes in the most recent bars, and it determines
the ratio between these averages. The result is expressed as a number
between 0 and 100. Commonly it is said that if the RSI has a low value,
for example 30 or under, the symbol is oversold. And if the RSI has a
high value, 70 for example, the symbol is overbought.
You can change long to short in the Input Settings
Please, use it only for learning or paper trading. Do not for real trading.
Percent change bar chart Strategy Backtest This histogram displays price or % change from previous bar.
Can be applied to any time frame.
This strategy buy if value above 0 and sell if value below 0.
You can change long to short in the Input Settings
Please, use it only for learning or paper trading. Do not for real trading.

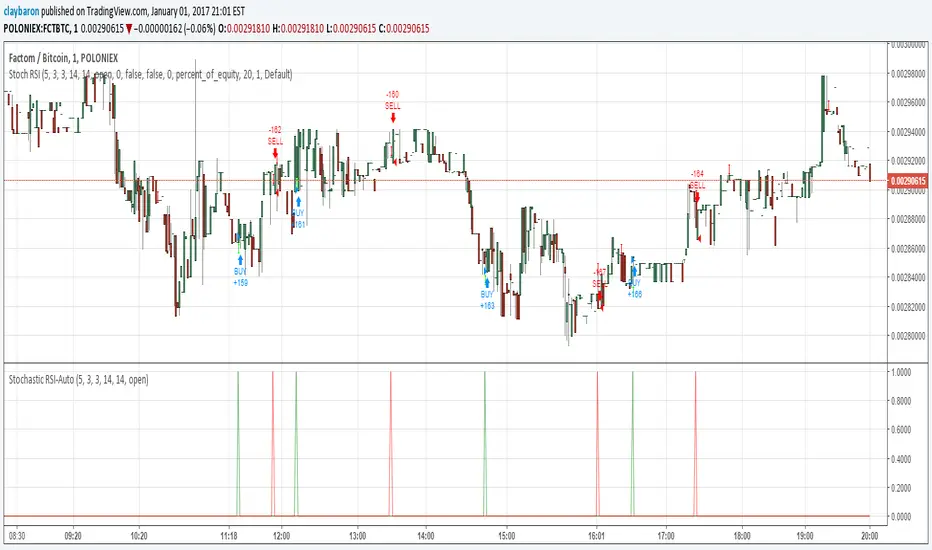
Stochastic RSI StrategyThis is an an adaption of Binary option 1 minute by Maxim Chechel to a strategy. I have had success with this on FCT/BTC on Poloniex.
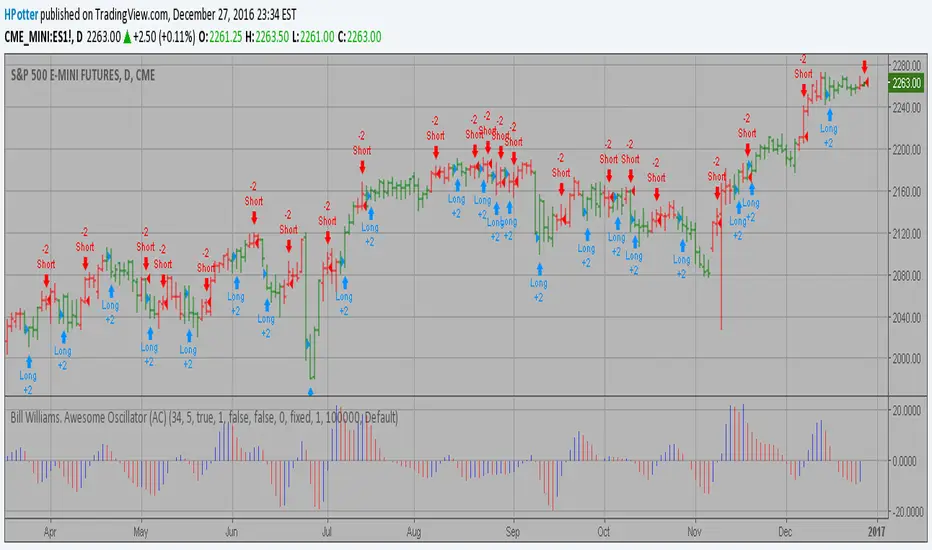
Bill Williams. Awesome Oscillator (AO) Backtest This indicator is based on Bill Williams` recommendations from his book
"New Trading Dimensions". We recommend this book to you as most useful reading.
The wisdom, technical expertise, and skillful teaching style of Williams make
it a truly revolutionary-level source. A must-have new book for stock and
commodity traders.
The 1st 2 chapters are somewhat of ramble where the author describes the
"metaphysics" of trading. Still some good ideas are offered. The book references
chaos theory, and leaves it up to the reader to believe whether "supercomputers"
were used in formulating the various trading methods (the author wants to come across
as an applied mathemetician, but he sure looks like a stock trader). There isn't any
obvious connection with Chaos Theory - despite of the weak link between the title and
content, the trading methodologies do work. Most readers think the author's systems to
be a perfect filter and trigger for a short term trading system. He states a goal of
10%/month, but when these filters & axioms are correctly combined with a good momentum
system, much more is a probable result.
There's better written & more informative books out there for less money, but this author
does have the "Holy Grail" of stock trading. A set of filters, axioms, and methods which are
the "missing link" for any trading system which is based upon conventional indicators.
This indicator plots the oscillator as a histogram where periods fit for buying are marked
as blue, and periods fit for selling as red. If the current value of AC (Awesome Oscillator)
is over the previous, the period is deemed fit for buying and the indicator is marked blue.
If the AC values is not over the previous, the period is deemed fir for selling and the indicator
is marked red.
You can change long to short in the Input Settings
Please, use it only for learning or paper trading. Do not for real trading.

Bill Williams. Awesome Oscillator (AC) Backtest This indicator plots the oscillator as a histogram where blue denotes
periods suited for buying and red . for selling. If the current value
of AO (Awesome Oscillator) is above previous, the period is considered
suited for buying and the period is marked blue. If the AO value is not
above previous, the period is considered suited for selling and the
indicator marks it as red.
You can change long to short in the Input Settings
Please, use it only for learning or paper trading. Do not for real trading.
2/20 Exponential Moving Average Backtest Strategy
This indicator plots 2/20 exponential moving average. For the Mov
Avg X 2/20 Indicator, the EMA bar will be painted when the Alert criteria is met.
You can use in the xPrice any series: Open, High, Low, Close, HL2, HLC3, OHLC4 and ect...
You can change long to short in the Input Settings
Please, use it only for learning or paper trading. Do not for real trading.

Historical Volatility Strategy Backtest Strategy buy when HVol above BuyBand and close position when HVol below CloseBand.
Markets oscillate from periods of low volatility to high volatility
and back. The author`s research indicates that after periods of
extremely low volatility, volatility tends to increase and price
may move sharply. This increase in volatility tends to correlate
with the beginning of short- to intermediate-term moves in price.
They have found that we can identify which markets are about to make
such a move by measuring the historical volatility and the application
of pattern recognition.
The indicator is calculating as the standard deviation of day-to-day
logarithmic closing price changes expressed as an annualized percentage.
Please, use it only for learning or paper trading. Do not for real trading.

Open Close Cross Strategy R5 revised by JustUncleLThis revision is an open Public release, with just some minor changes. It is a revision of the Strategy "Open Close Cross Strategy R2" originally published by @JayRogers.
*** USE AT YOUR OWN RISK ***
JayRogers : "There are drawing/painting issues in pinescript when working across resolutions/timeframes that I simply cannot fix here.. I will not be putting any further effort into developing this until such a time when workarounds become available."
NOTE: Re-painting has not been observed with the default set up, nor with Alternate resolution multiplier up to 5.
Description:
Strategy based around Open-Close Moving Average Crossovers optionally from a higher time frame.
Setup:
I have generally found that setting the strategy resolution to 3-5x that of the chart you are viewing tends to yield the best results, regardless of which MA option you may choose (if any) BUT can cause a lot of false positives - be aware of this. JustUncleL: using one of the Smoothed MA helps reduce false positives.
Don't aim for perfection. Just aim to get a reasonably snug fit with the O-C band, with good runs of green and red. JustUncleL: using SMMA (8 to 10) gives a good fit.
Option to either use basic open and close series data, or pick your poison with a wide array of MA types.
Optional Stop Loss and Target Profit for damage mitigation if desired (can be toggled on/off)
Positions get taken automatically following a crossover - which is why it's better to set the resolution of the script greater than that of your chart, so that the trades get taken sooner rather than later.
If you make use of the stops/target profit, be sure to take your time tweaking the values. Cutting it too fine will cost you profits but keep you safer, while letting them loose could lead to more draw down than you can handle.
Revsion R5 Changes by JustUncleL
Corrected cross over calculations, sometimes gave false signals.
Corrected Alternate Time calculation to allow for Daily,Weekly and Monthly charts.
Open Public release.
Revision R4 By JustUncleL
Change the way the Alternate resolution in selected, use a Multiplier of the base Time Frame instead, this makes it easy to switch between base time frames.
Added TMA and SSMA moving average options. But DEMA is still giving the best results.
Using "calc_on_every_tick=false" ensures results between back testing and real time are similar.
Added Option to Disable the coloring of the bars.
Updated default settings.
R3 Changes by JustUncleL:
Returned a simplified version of the open/close channel, it shows strength of current trend.
Added Target Profit Option.
Added option to reduce the number of historical bars, overcomes the too many trades limit error.
Simplified the strategy code.
Removed Trailing Stop option, not required and in my option does not work well in Trading View, it also gives false and unrealistic performance results in back testing.
R2 Changes by @JayRogers:
Simplified and cleaned up plotting, now just shows a Moving Average derived from the average of open/close.
Tried very hard to alleviate painting issues caused by referencing alternate resolution.

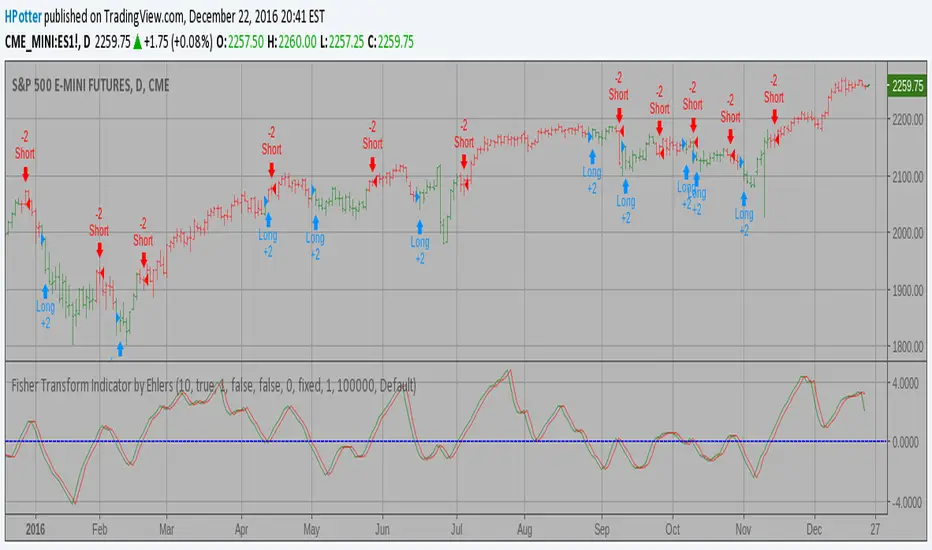
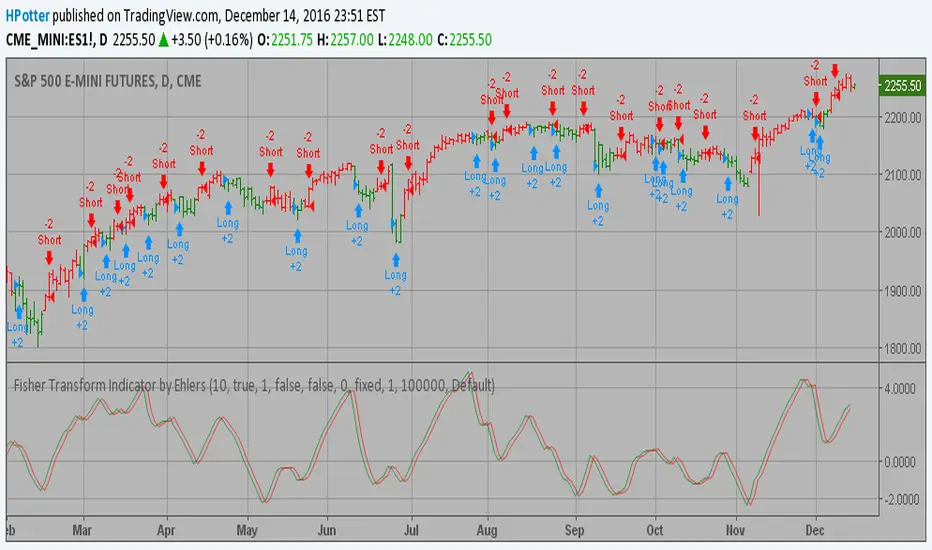
Fisher Transform Indicator by Ehlers Backtest v 2.0 Market prices do not have a Gaussian probability density function
as many traders think. Their probability curve is not bell-shaped.
But trader can create a nearly Gaussian PDF for prices by normalizing
them or creating a normalized indicator such as the relative strength
index and applying the Fisher transform. Such a transformed output
creates the peak swings as relatively rare events.
Fisher transform formula is: y = 0.5 * ln ((1+x)/(1-x))
The sharp turning points of these peak swings clearly and unambiguously
identify price reversals in a timely manner.
For signal used zero.
You can change long to short in the Input Settings
Please, use it only for learning or paper trading. Do not for real trading.
RSI HistoAlert Strategy This simple indicator modified RSI
You can use in the xPrice any series: Open, High, Low, Close, HL2, HLC3, OHLC4 and ect...
You can change long to short in the Input Settings
Please, use it only for learning or paper trading. Do not for real trading.

High - EMA Strategy Backtest This indicator plots the difference between the High (of the previous period)
and an exponential moving average (13 period) of the Close (of the previous period).
You can use in the xPrice any series: Open, High, Low, Close, HL2, HLC3, OHLC4 and ect...
It buy if indicator above 0 and sell if below.
You can change long to short in the Input Settings
Please, use it only for learning or paper trading. Do not for real trading.

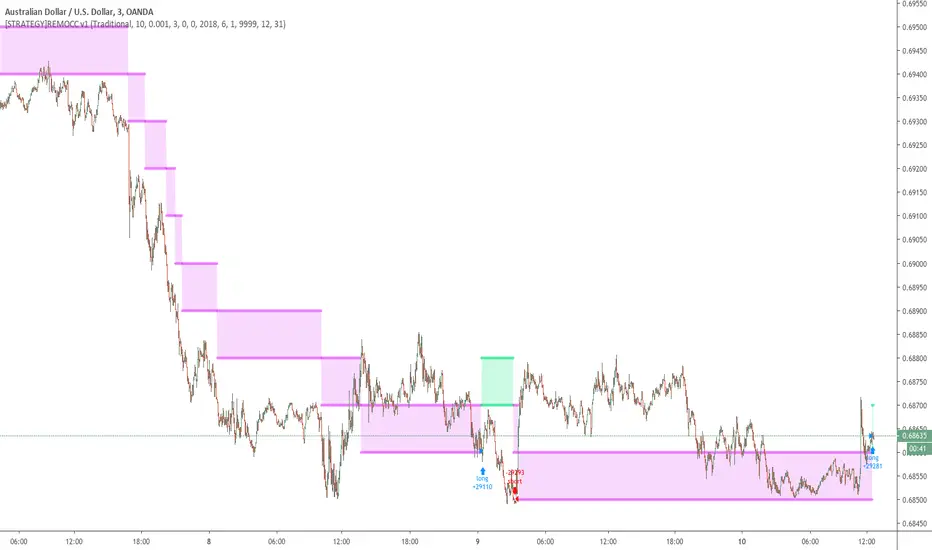
[STRATEGY]Renko Emulator OCC v1 by JustUncleLThis "Strategy" project has been created by request.
*** EXPERIMENTAL ***
*** USE AT YOUR OWN RISK ***
Description:
Strategy based around Renko Bar Chart emulator (ATR) with direction change used to signal long/short trades.
I have generally found that setting the strategy ATR resolution to 3-5x that of the chart you are viewing tends to yield the good results, regardless of which chart time used. Positions get taken automatically following THE Renko Bar after a crossover.
The emulated Renko bars can optionally be draw on the chart.
FX Sniper: T3-CCI Strategy Backtest This simple indicator gives you a lot of useful information - when to enter, when to exit
and how to reduce risks by entering a trade on a double confirmed signal.
You can use in the xPrice any series: Open, High, Low, Close, HL2, HLC3, OHLC4 and ect...
You can change long to short in the Input Settings
Please, use it only for learning or paper trading. Do not for real trading.

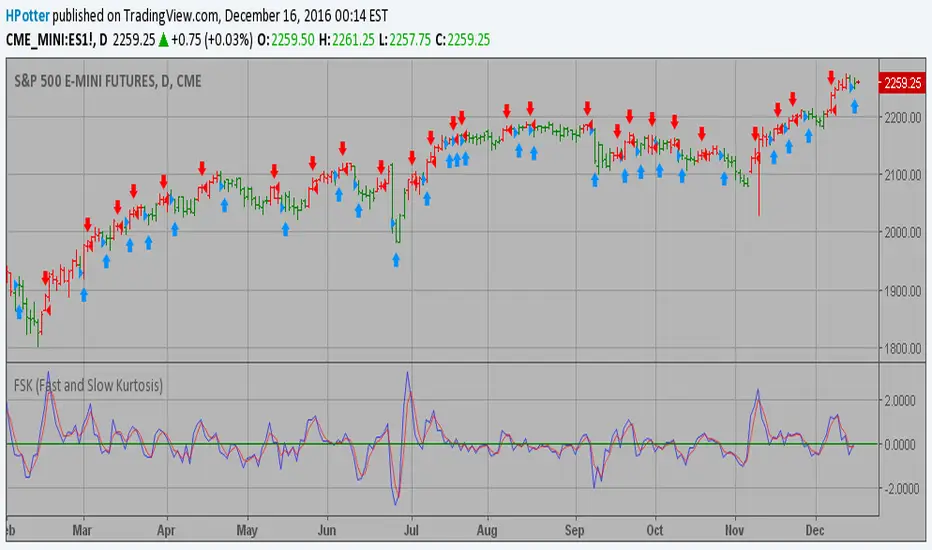
FSK (Fast and Slow Kurtosis) Backtest This indicator plots the Fast & Slow Kurtosis. The Kurtosis is a market
sentiment indicator. The Kurtosis is constructed from three different parts.
The Kurtosis, the Fast Kurtosis(FK), and the Fast/Slow Kurtosis(FSK).
You can change long to short in the Input Settings
Please, use it only for learning or paper trading. Do not for real trading.
Fisher Transform Indicator by Ehlers Backtest Market prices do not have a Gaussian probability density function
as many traders think. Their probability curve is not bell-shaped.
But trader can create a nearly Gaussian PDF for prices by normalizing
them or creating a normalized indicator such as the relative strength
index and applying the Fisher transform. Such a transformed output
creates the peak swings as relatively rare events.
Fisher transform formula is: y = 0.5 * ln ((1+x)/(1-x))
The sharp turning points of these peak swings clearly and unambiguously
identify price reversals in a timely manner.
You can change long to short in the Input Settings
Please, use it only for learning or paper trading. Do not for real trading.
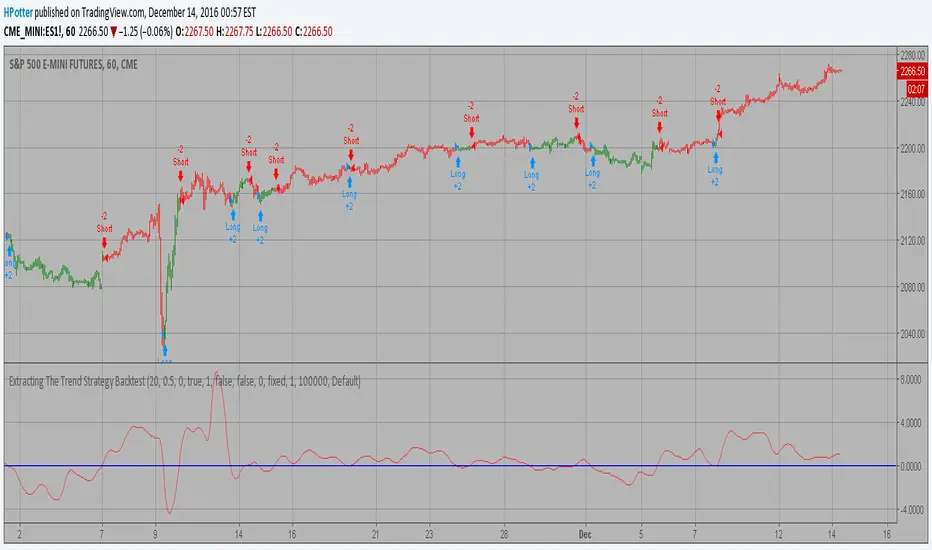
Extracting The Trend Strategy Backtest The related article is copyrighted material from Stocks & Commodities Mar 2010
You can use in the xPrice any series: Open, High, Low, Close, HL2, HLC3, OHLC4 and ect...
You can change long to short in the Input Settings
Please, use it only for learning or paper trading. Do not for real trading.