Ultra Key LevelsThe "Ultra Key Levels" indicator is a powerful tool designed for traders who seek to identify critical price levels in the market. This Pine Script™ indicator is optimized to plot significant pivot highs and lows directly on your chart, providing a clear visual representation of potential support and resistance zones.
Pivot Detection: Automatically identifies and marks pivot highs and lows using customizable parameters. Traders can fine-tune the length of the pivots, allowing for precise detection of significant price points.
Dynamic Boxes: The indicator draws dynamic boxes around each identified pivot high and low, highlighting key levels. These boxes are adjusted based on the Average True Range (ATR), ensuring they reflect the current market volatility.
Pivot Highs/Lows: Control the appearance and behavior of pivot points with options to adjust source data, length, transparency, and the maximum number of pivots displayed on the chart.
ATR Multiplier: Set the ATR multiplier to determine the size of the boxes around pivot points, helping you assess the strength of each level.
Debug Mode: Activate debug mode to visualize pivot points and fine-tune your settings for optimal performance.
Scalability: Supports up to 500 boxes, making it suitable for both short-term and long-term traders who need to track multiple levels across different timeframes.
The "Ultra Key Levels" indicator is ideal for traders who rely on technical analysis to make informed decisions. By automatically identifying and highlighting key price levels, this tool helps you anticipate potential market movements and optimize your trading strategy.
Support

[1] Dynamic Support and Resistance with breakout [Dr Future]This script appears to be designed to identify and visualize dynamic support and resistance levels on a price chart, along with potential breakout signals.
Key Components & Functionality (Inferred):
Dynamic Support and Resistance: The script likely employs algorithms to calculate and plot support and resistance levels that adjust in real-time as price action evolves.
Breakout Detection: The script probably incorporates logic to recognize when the price breaks out of these dynamic support or resistance zones. This could trigger alerts or visual cues on the chart.
Dr Future's Approach: It's worth noting the " " tag, suggesting the script might be based on specific methodologies or insights associated with a trader or analyst known as "Dr Future." Without more context on their strategies, it's difficult to pinpoint the exact techniques used.
Potential Benefits:
Adaptive Levels: Dynamic support and resistance can offer a more responsive approach compared to static levels, as they account for changing market conditions.
Breakout Opportunities: Identifying breakouts can help traders spot potential entry or exit points.
Visual Clarity: Plotting these levels directly on the chart can provide a clearer picture of the current market structure and potential turning points.
Caveats:
False Signals: Like any technical tool, dynamic support and resistance can generate false signals. Breakouts might not always lead to sustained trends.
Parameter Sensitivity: The script's effectiveness likely depends on how its parameters are configured. Fine-tuning might be required to suit different markets or timeframes.
"Dr Future" Factor: The script's performance could be tied to the specific strategies of "Dr Future," which might not be universally applicable.
Important Note:
Without access to the actual code and a deeper understanding of "Dr Future's" methods, this description is based on inference and general knowledge of technical analysis.
Recommendation:
If you're considering using this script, it would be prudent to:
Backtest Thoroughly: Test the script on historical data to assess its performance and identify potential pitfalls.
Understand the Parameters: Familiarize yourself with the script's settings and how they impact the plotted levels and breakout signals.
Combine with Other Tools: Use this script in conjunction with other technical indicators and risk management strategies for a more holistic trading approach.

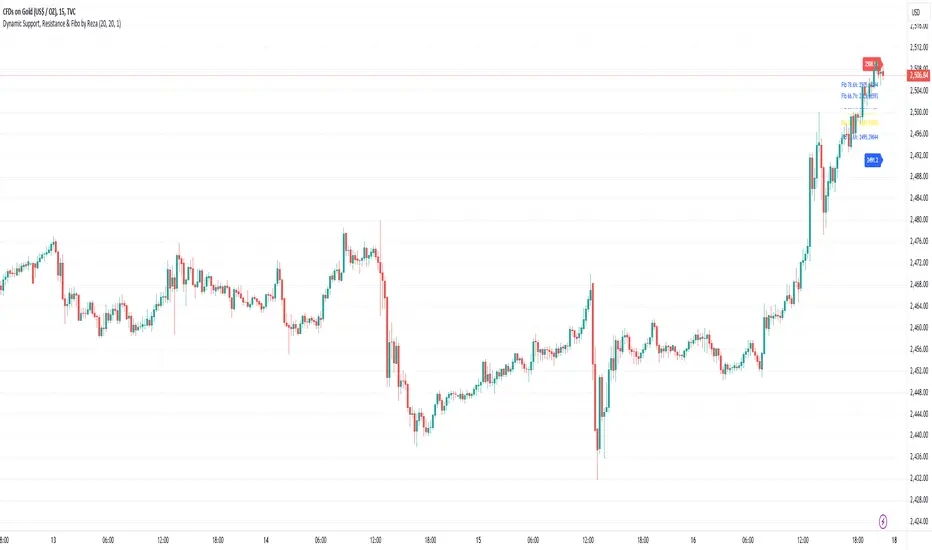
Dynamic Support, Resistance & Fibo by RezaDynamic Support, Resistance & Fibonacci Levels by Reza
This Pine Script indicator dynamically calculates and plots significant support and resistance levels, along with key Fibonacci retracement levels, based on recent price action. It provides traders with essential tools to identify crucial levels on the chart that may influence future price movements.
Key Features:
Dynamic Support and Resistance Lines:
The script identifies recent swing highs and swing lows within a customizable lookback period to determine dynamic support and resistance levels.
These levels are plotted as horizontal lines (blue for support, red for resistance) and are updated in real-time to reflect changes in the price structure.
Labels next to each line display the exact price level of the support and resistance, making it easy to identify them at a glance.
Fibonacci Retracement Levels:
The script calculates and plots Fibonacci retracement levels (23.6%, 38.2%, 50.0%, 55.9%, 61.8%, 66.7%, and 78.6%) between the identified support and resistance levels.
These Fibonacci levels are plotted as dotted lines, with customizable colors and labels for clarity.
The Fibonacci levels provide traders with potential retracement and extension levels, which are commonly used to predict price reversals, pullbacks, and continuation zones.
Customization:
Users can adjust the lookback period for swing high and swing low calculations to suit different trading styles and market conditions.
The script allows traders to enable or disable Fibonacci levels and choose whether or not to remove the background color of the labels for cleaner chart visuals.
Line width, highlight colors, and label colors are fully customizable for better integration with various chart styles and themes.
Real-Time Dashboard:
The indicator includes a real-time dashboard that calculates and displays the next potential target based on current market conditions, including potential retracement or continuation targets.
The dashboard dynamically updates based on trend direction and Fibonacci zones, giving traders valuable insights into potential price objectives.
How to Use:
This indicator is suitable for multiple timeframes, helping traders identify key levels in real-time as the market evolves.
By providing support and resistance zones along with Fibonacci retracement levels, this script offers a powerful combination of technical analysis tools for both novice and experienced traders.
The dynamic calculations help traders spot potential areas for entering or exiting trades, placing stop-loss levels, and identifying profit-taking zones.
Ideal for:
Traders who want to use support and resistance levels for trade planning.
Fibonacci enthusiasts looking for automated level plotting.
Anyone seeking to identify key price levels in real-time across different timeframes.
Script Author:
Reza – Bringing you dynamic, real-time support, resistance, and Fibonacci level plotting for more effective trading decisions.
ICT NWOG/NDOG Gaps [TradingFinder] New Opening Gaps🔵 Introduction
🟣 Understanding ICT Opening Gaps
In the realm of technical analysis, mastering the art of recognizing market behavior and pinpointing key price levels is vital for making sound trading decisions. Among the array of tools available, the concept of opening gaps stands out for its ability to provide crucial insights.
The ICT (Inner Circle Trader) methodology offers a distinctive approach to understanding the importance of New Day Opening Gaps (NDOG), New Week Opening Gaps (NWOG), and New Monthly Opening Gaps (NMOG).
These gaps, representing the price differences between the close of a previous period and the open of the next, serve as key reference points that can greatly impact price movements.
The ICT trading approach highlights these gaps as potential zones of support and resistance. Prices often respond to these areas, either bouncing off or passing through and then retesting them. Within these gaps, significant levels such as the high and low are particularly important.
Additionally, the Event Horizon PD Array (EHPDA) concept, which is an intermediate level calculated from the average of neighboring NWOGs or NDOGs, adds another layer to this analysis.
This guide delves into ICT's New Daily, Weekly, and Monthly Opening Ranges, showing how these gaps can be effectively utilized in trading. By grasping the nuances of these gaps, traders can better forecast market behavior, identify key support and resistance levels, and refine their trading strategies.
🟣 The Gaps
1. New Week Opening Gap (NWOG) : The NWOG is the price gap between Friday's closing price and Sunday's opening price. This gap is particularly crucial for traders who monitor weekly trends. Depending on the direction of the gap, the NWOG often serves as a pivotal support or resistance level.
2. New Day Opening Gap (NDOG) : The NDOG signifies the price difference between the closing price of the previous day and the opening price of the current day. Much like the NWOG, the NDOG is a key reference point for intraday traders.
Prices typically react to these levels, either reversing or continuing through the gap after a retest. NDOGs are instrumental in identifying short-term support and resistance levels, aiding traders in making decisions based on daily price movements.
3. New Monthly Opening Gap (NMOG) : The NMOG represents the gap between the closing price of the previous month and the opening price of the current month.
This gap is especially valuable for traders focusing on long-term trends and macroeconomic factors. As with NWOGs and NDOGs, the NMOG can act as a significant support or resistance level.
🔵 How to Use
Identifying Support and Resistance : Opening gaps often indicate potential zones where prices might reverse or find support/resistance. For example, if a new day opens below the previous day’s close (creating a NDOG), this gap could act as resistance, prompting traders to consider short positions if the price retests this level without breaking through.
Conversely, if the price opens above the previous day’s close, the gap might serve as support, offering a potential entry point for long trades.
Gap Fill Strategy : A popular strategy associated with opening gaps is the "gap fill" approach, where traders anticipate that the price will eventually return to fill the gap.
For instance, if there’s a significant NDOG at market open, a trader might expect the price to retrace back to the previous day’s close, effectively "filling" the gap. This strategy is particularly effective in markets that exhibit mean-reverting behavior.
Combining Gaps with Other Indicators : Traders often enhance their analysis of NDOG, NWOG, and NMOG by integrating other technical indicators. Aligning gap levels with tools such as Fibonacci retracements, moving averages, or existing support and resistance zones can provide additional confirmation for trade entries and exits.
🔵 Setting
Show and Color : You can control the display or non-display of the range as well as the color of the range.
Max Opening Range Update Method : You can control the number of ranges that are updated. If it is "All", all ranges that are not mitigated will be displayed. If "Custom", the ranges will be updated based on the number you specify.
Max Opening Range Update : The number of ranges to update.
🔵 Conclusion
The ICT New Daily, Weekly, and Monthly Opening Ranges provide traders with a systematic approach to understanding market dynamics and identifying critical support and resistance levels.
By analyzing these gaps, traders can gain deeper insights into potential price movements, spot high-probability trade setups, and strengthen their overall trading strategy. Whether you are focused on short-term day trading or long-term market trends, incorporating NDOG, NWOG, and NMOG analysis into your trading plan can be a powerful addition to your toolkit.

Price Close ProbabilityThe Price Close Probability Indicator is designed to help traders estimate the likelihood of price closing above or below specified levels within a given bar. By placing two levels on your chart, you can quickly gauge the probability of the current price bar closing above or below these levels in real-time.
Key Features:
Dynamic Probability Calculation: The indicator continuously updates the probability of price closing above or below your set levels as the current bar progresses, providing you with timely insights as the bar approaches its close.
Customizable Standard Deviation : Adjust the length of the Standard Deviation used in the calculations to tailor the probability estimates to your preferred settings.
User-Friendly Probability Table : A clean, easy-to-read table displays the calculated probabilities, helping you make informed trading decisions at a glance.
Assumptions and Considerations:
While the indicator assumes that returns are normally distributed, which may not fully reflect reality, it still offers a valuable approximation of the probabilities for price movement within the current bar.
Future Enhancements (Coming Soon):
Multi-Bar Probability: Calculate probabilities across multiple bars to enhance your forecasting capabilities.
Additional Levels: Set more than two levels for a broader analysis of price movements.
Refined Distribution Modeling: Improve the accuracy of probability calculations by adjusting for more realistic return distributions.
Disclaimer
Please remember that past performance may not be indicative of future results.
Due to various factors, including changing market conditions, the strategy may no longer perform as well as in historical backtesting.
This post and the script don’t provide any financial advice.

SPX Mapped Gaps [Mxwll]Hello traders 👋
This indicator "SPX Mapped Gaps" detects gaps from the SPX (or the trader's choice of index/asset) and plots them for the asset on your chart!
Features
Selectable comparison symbol
Gaps from the selected symbol (SPX by default) are plotted for the asset on your chart - serving as potential support/resistance levels!
Closest gaps from comparison symbol displayed in upper-right table
Overlapped gaps deleted automatically - less clutter!
How this script works
The "SPX Mapped Gaps" is designed to help traders determine price levels for the asset on their chart where a major index (any asset) gapped up or down.
Of course, a gap that occurs on SPX (4-digit price) is incompatible with the price chart of BTC (5-digit price). To circumvent this, the percentage distance of the gap from SPX is determined, and a gap level is drawn equidistantly (up/down) from the open price of the asset on your chart. With this method, the proportion of the gap is maintained at the price area it occurred for the asset on your chart!
The image above outlines functionality for the indicator!
Key points:
Up gaps are denoted by green boxes
Down gaps are denoted by red boxes
All gaps are listed with their start and end price for the comparison asset (SPX for the example). These labels can be hidden at the user's discretion.
Gaps are expected to act as support/resistance during their lifetime
The image above explains the output of the script, including line style indications!
Solid lines indicate that the leverage used for at your entry price constitutes an active trade. Dotted lines mean the trade has already achieved your profit target for that leverage, or stopped out.
The image above explains the table attached to the indicator!
This table displays the closest gaps to the current asset price. The status (up gap or down gap) from the gap to the current price is also detailed.
Why are gaps on the SPX, or major index, relevant to BTC and other assets?
When a gap on the major indices occurs, it's expected that strong aggregate buying or selling pressure will transpire for BTC and other coins. Due to this, the presence of a gap on a major index might correspond to increased activity on smaller market-cap assets with some degree of positive correlation to the index. Consequently, the price level for the asset at which a gap for the major index occurred may function as support/resistance for future price!
That is all for this - thanks traders!

Three Anchored Moving Averages (VWAP / SMA / EMA)
This indicator allows users to anchor three types of moving averages (Simple Moving Average (SMA), Exponential Moving Average (EMA), and Volume Weighted Average Price (VWAP)) to specific points in time (anchor points)
Key Features:
Select from three Moving Average Types:
Simple Moving Average (SMA): Averages the closing prices over a specified period.
Exponential Moving Average (EMA): Gives more weight to recent prices, making it more responsive to new information.
Volume Weighted Average Price (VWAP): Averages the price weighted by volume, useful for understanding the average price at which the asset has traded over a period.
Up to Three Anchor Points:
Users can set up to three different anchor points to calculate the moving averages from specific dates and times. This allows for analysis of price action starting from significant points or specific events. For example, you can anchor to the low and high of a move to identify key levels or to points where the price takes off from a previous anchored MA.
Customisable Sentiment Options:
Each anchor point can be associated with a sentiment input (Auto, Bull, Bear, None), which influences if the MAs are displayed as lines or zones/bands:
Auto: Automatically determines the sentiment based on whether anchor points are on pivot highs and lows. If anchored to a pivot high, the system will assume a bearish sentiment and display a red band or zone between the MA OHLC4 and High. Anchoring to a pivot low will display a green band (OHLC4 - Low).
Bull: Forces a bullish sentiment (Green Band - OHLC4 to Low)
Bear: Forces a bearish sentiment (Red Band - OHLC4 to High)
None: Ignores sentiment and displays a single line (OHLC4)
Chart Matching:
The indicator includes an option to display the moving averages only if the chart symbol matches a specified ticker. This feature ensures that the indicator is relevant to the specific asset being analysed.
How to Use the Indicator:
1. Set Anchor Points: When added to your chart, select three anchor points by point and click. If you only wish to anchor to a single point, click on that point three times and disable the other two in settings once the indicator is applied.
2. Select Moving Average Type: Choose between SMA, EMA, or VWAP using the dropdown menu. EMAs are the most responsive.
3. Enable/Disable Anchor Points: Use the checkboxes to enable or disable each anchor point.
4. Select Sentiment Type: Choose between Auto, Bull, Bear, or None.
5. Chart Matching: Optionally, specify a chart symbol to restrict the indicator's display to that particular asset.
6. Interpret the Plots: The indicator plots the high, mid, and low values of the selected moving average type from each anchor point. The fills between these plots help identify potential support and resistance zones. These should be used as points of interest for pullback reversals or potential continuation if the price breaks through.
Practical Applications:
Trend Analysis: Identify the overall trend direction from specific historical points.
Support and Resistance: Determine key dynamic support and resistance levels based on anchored moving averages.
Event-Based Analysis: Anchor the moving averages to significant events (e.g., earnings releases, economic data) to study their impact on price trends.
Multi Timeframe Analysis: Higher Timeframe Anchors can be used to identify longer term trend analysis. Switching to a lower timeframe for execution triggers at these points wont distort the MA levels as they are anchored to a specific point in time
Intraday or Swing Trading: trend analysis using anchor points can be used for any style of trading (Intraday / Swing / Invest). Use anchored levels as points of interest and wait for hints in price action to try and catch the next move.

DTFX Algo Zones [LuxAlgo]DTFX Algo Zones are auto-generated Fibonacci Retracements based on market structure shifts.
These retracement levels are intended to be used as support and resistance levels to look for price to bounce off of to confirm direction.
🔶 USAGE
Due to the retracement levels only being generated from identified market structure shifts, the retracements are confined to only draw from areas considered more important due to the technical Break of Structure (BOS) or Change of Character (CHoCH).
The simple action that causes a market structure shift occurs is price breaking above or below a specific swing point. When a market structure shift happens, a retracement is drawn from the point of break to the highest or lowest point since that point. Due to the price action necessary for a market structure shift, these retracements will not always be immediately actionable.
These retracement levels are intended to be used as points to watch for price to retrace to and bounce from, confirming the current direction of price.
In the example below, after the retracement is initiated, by bouncing off of the retracement levels formed from the previous market structure shift it would further confirm the bias of the market structure shift. A break going through these levels would display a weakness from the current market structure shift, implying that it could simply be noise.
🔶 DETAILS
The script uses standard SMC Market structure identification to determine Break of Structures (BOS) and Change of Characters (CHoCH). The specific swing points can be identified by the shapes placed above or below the specific swing high/low candle.
By unchecking the "Display All Zones" setting, users are able to specify the exact number of retracement zones to display using the "Show Last" parameter. This is handy for cleaning up the chart to stay focused on the most recent retracements.
Additionally, when displaying multiple zones, the "Clean-Up Level Overlap" setting may be helpful for decluttering as well. This option optimizes the display of retracement levels to minimize their overlap on other adjacent zones.
The script allows for up to 5 Fib levels to be displayed from each zone, with options for display, value, line style, and color for each of the 5.
The calculation for Fib Levels changes depending on the direction of market structure shifts. When an upwards (Bullish) zone is generated, the retracement is drawn with the bottom of the zone being 0 and the top of the zone being 1. This is reversed for downwards (Bearish) zones.
🔶 SETTINGS
Structure Length: Sets the SMC structure length to use for finding MMS.
Show Last: Displays this number of retracement zones. (Display All Zones Must be Unchecked)
Display All Zones: Ignores "Show Last" number and displays all historical MMS Retracement Zones.
Zone Display: Choose which zones to display, only bearish, only bullish, or both.
Clean-Up Level Overlap: Minimizes overlap between adjacent zones and levels.
Fib Levels: Settings to display and customize up to 5 Fib levels for each zone.

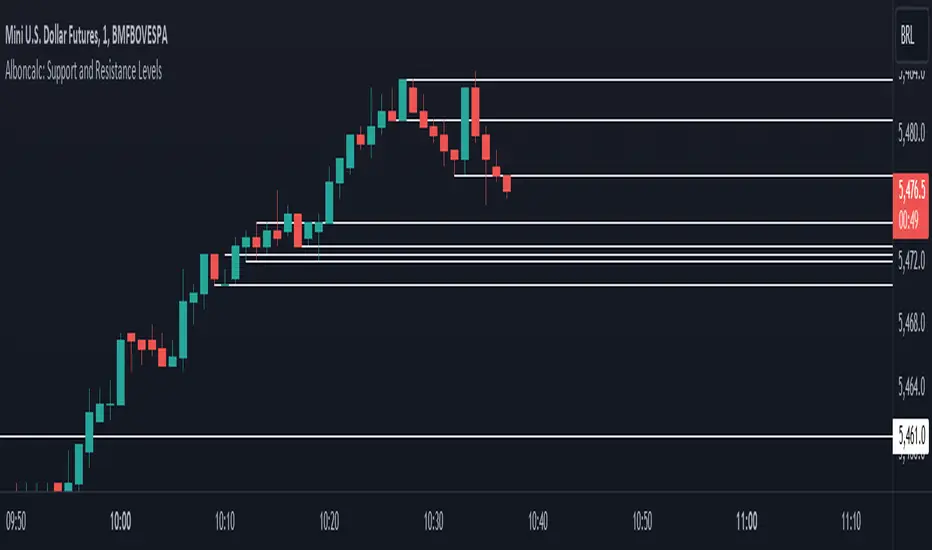
Alboncalc: Support and Resistance LevelsAlboncalc: Support and Resistance Levels
Description:
Alboncalc is an innovative TradingView indicator that identifies significant support and resistance levels based on patterns where two candles form equal highs and/or lows. This indicator automatically plots these critical levels on the chart, providing traders with clear visual cues of potential price reversal or consolidation points.
Originality and Usefulness:
Alboncalc stands out for its ability to detect specific candle patterns that indicate support and resistance, setting it apart from traditional support and resistance indicators. This specific method of price action analysis offers a unique and refined perspective for traders, adding value to the body of knowledge within the TradingView community.
How It Works:
Alboncalc analyzes historical prices to identify where two consecutive candles achieve equal highs or lows. When these conditions are met, the indicator automatically plots a support or resistance line on the chart. These levels are dynamically updated, ensuring that traders always have the most relevant and accurate information.
How to Use:
Installation: Add Alboncalc to your chart on TradingView.
Interpretation: Observe the plotted support and resistance lines. These lines indicate potential reversal or consolidation points.
Application: Use these levels to confirm breakout points or identify areas of price exhaustion. The clear visualization of technical levels helps enhance your trading strategies.
Underlying Concepts:
Alboncalc is based on price action analysis, focusing on specific candle patterns that signal important technical levels. The formation of two candles with equal highs or lows indicates a temporary balance between buyers and sellers, suggesting potential price direction changes.
Candle Body Support/Resistance [LuxAlgo]The Candle Body Support/Resistance indicator is a tool that provides Support/Resistance levels from high-volatility candles, a concept originally described by Steve Nison in "Beyond Candlesticks".
Users can define the candle body percentage used to set the detected support/resistance levels. Occurrences of price testing the returned levels are highlighted using user-customizable dots.
🔶 USAGE
Support/Resistance levels are drawn from volatile candles, that is candles having a body (range between opening and closing price) whose magnitude is larger than the Volatility Threshold , which is determined by the multiplicative factor of an ATR (Average True Range) using a user set length.
The level starts from the opening price +/- a percentage of the open-close range. Users can adjust the percentage of the candle body used as support/resistance levels respectively, with higher percentage values returning levels prone to get reached sooner by the price.
A test is considered valid when a wick passes through the Support/Resistance level while the closing price is not breaking it.
Two modes are included, Trailing and Historical , both affecting the displayed elements of the indicator, these are described in the sub-section below.
🔹 Historical
The Historical Mode will draw a separate line from every Volatile Candle . When this line is tested, a dot will be drawn.
In the above example, the red resistance line was tested once until a bullish volatile candle formed, which closed just below the resistance level. The resistance level was tested again, after which the newly created support level was broken quickly, and the price decreased. These levels proved helpful later, acting as resistance/support levels (illustrated by the extra manually drawn dashed white lines).
To prevent cluttering Support/Resistance , lines will be deleted when the line is mitigated and hasn't been tested.
When a Support/Resistance line reaches its Maximum Line Length , it will also be deleted when it has not been tested.
🔹 Trailing
When a new volatile candle of the same type (bullish/bearish) appears while the Support/Resistance isn't broken, this line will be updated with the values of the new volatile candle. This creates a trailing line and a less cluttered chart.
Unlike the Historical mode , a line will not be deleted after a while or when it is mitigated. Instead, the line won't be updated anymore. A new line will start from the next found volatile candle.
Using the same situation as the Historical Mode example, we can note the future significance of old support/resistance levels (illustrated by the extra manually drawn dashed white lines).
The user can switch between these 2 modes, each offering a unique perspective on the market. This provides a more in-depth examination of the market, enhancing the user's trading analysis.
Using a copy of our indicator while using both modes can also be helpful.
🔶 DETAILS
The Support level is the opening price of a bullish volatile candle plus a user-set percentage of the candle's body, while the Resistance level is the opening price of a bearish volatile candle minus a percentage of the candle's body.
The following example illustrates the ATR with the multiplicative factor (Volatility Threshold) where the body of Volatile candles exceeds the ATR limits. Changing the Volatility Threshold and ATR length gives users extra flexibility to adjust to their needs.
🔹 Max Line Length
When using the Historical Mode and the duration of a displayed level reaches the user-set Max Line Length value, the level will return to the last test or be deleted when it has not been tested.
🔶 SETTINGS
Display Mode: Display mode of the indicator.
Support %: Sets the distance of the Support Line from the opening price relative to the candle body.
Resistance %: Sets the distance of the Resistance Line from the opening price relative to the candle body.
🔹 Filter
Length ATR: Amount of bars for the calculation of the Average True Range.
Volatility Threshold: multiplicative factor of ATR.
Max Line Length: Maximum allowed duration/length (in bars) of a Support/Resistance level.

Spiral Levels [ChartPrime]SPIRAL LEVELS
⯁ OVERVIEW
The Spiral Levels [ ChartPrime ] indicator, designed for use on TradingView and developed with Pine Script™ , leveraging a combination of traditional pivot points and spiral geometry to visualize support and resistance levels on the chart. By plotting spirals from pivot points, the indicator provides a distinctive perspective on potential price movements.
It's an experiment inspired from spirals in the Pine documentation and the concept of using spirals to add padding/offsets to SR zones in a market (an idea we plan to expand on in the future).
◆ USAGE
● Identifying Pivot Points: The indicator identifies significant pivot highs and lows based on user-defined criteria.
● Filtered Pivot Points: Pivot points for spirals are filtered using volume and high/low thresholds to ensure they are significant.
● Spiral Visualization: Spirals are plotted from these pivots, indicating potential future support and resistance levels or as liquidity zones.
Additionally, the plotted levels can serve as liquidity zones where the price might attempt to grab liquidity, providing a deeper understanding of market behavior at significant volume levels.
● Volume-Based Coloring: Spirals are colored based on volume data, providing additional context about the strength of the price movement.
● Labeling and Line Extensions: Labels display volume information, and lines extend from the end of the spirals to the current bar for clarity.
● Spiral Rotation: By adjusting the "Number of spiral rotations" input, you can control the number of rotations each spiral makes around a pivot point, offering more detailed insights. This also allows you to control the distance of levels from a pivot. More rotations will extend the spiral further from the pivot point, potentially identifying support and resistance levels or liquidity zones at greater distances.
This modification emphasizes that the number of rotations not only provides more detailed insights but also affects the spatial distribution of the identified levels relative to the pivot point.
⯁ USER INPUTS
● Pivots
Left Bars: Determines the number of bars to the left of the pivot.
Right Bars: Determines the number of bars to the right of the pivot.
● Filter
Volume Filter: Sets the threshold for volume filtering.
High & Low Filter: Sets the threshold for filtering pivot highs and lows.
● Spiral
Spirals Shown: Specifies the number of spirals to be displayed on the chart.
Number of spiral rotations: Sets the number of rotations for each spiral.
X Scale: Adjusts the horizontal scale of the spirals.
Y Scale: Adjusts the vertical scale of the spirals, relative to the ATR(200).
Reverse Spirals: Option to reverse the direction of the spirals.
⯁ TECHNICAL NOTES
The indicator uses Pine Script's polyline feature for smooth spiral rendering.
It implements a custom cross detection function to manage line and label visibility.
The script is optimized to limit calculations to the last 1000 bars for performance.
It automatically manages the number of displayed elements to prevent clutter and ensure smooth performance.
The Spiral Levels ChartPrime indicator offers a unique and visually engaging method to identify potential support and resistance levels. By integrating volume data and pivot points with spiral geometry, traders can gain valuable insights into market dynamics and make more informed trading decisions.

Relative Equal Highs/LowsThis Pine script indicator is designed to create a visual representation of the relative equal highs & lows formed and automatically removed mitigated ones. Unlike indicators designed to show exact equal high/lows this indicator allows a small, configurable degree of variance between price to identify areas where price stops.
Relevance:
Relative Equal highs and lows can serve as valuable tools in identifying potential shifts in trend direction. They come into play when the price hits a support or resistance level and can’t advance further, signaling a possible reversal or pivot point. When the price sufficiently retreats from these levels, relative equal highs and lows can also indicate liquidity draws where buy/sell stops might be positioned, in accordance with SMC/ICT concepts.
How It Works:
The indicator tracks all unmitigated highs & lows within the chart’s present timeframe, limited to the user-defined max bars lookback for optimal performance. If the prices are within the configured variance they are marked as relatively equal and at that point are visually identified by a horizontal line, which connects the two (or more) points of price. Depending on configuration of the indicator, a line is rendered from the 1st, last or both values within the relatively equal range of price. A unique feature of this indicator is its ability to remove the line once the price mitigates the relative equal high/low by falling below the lows or rising above highs. This ensures the chart remains uncluttered and highlights only the currently relevant levels, setting it apart from other indicators providing similar functionality.
Configurability:
The indicator offers five style settings for complete customization of the lines that represent equal highs/lows. These settings include line style, color, and width, along with an option to extend the lines to the right of the chart for enhanced visibility of equal high/low levels. To optimize performance, the indicator allows users to configure the lookback length, determining how far back the price history should be examined. In most instances, the default setting of 500 bars proves more than adequate. Additionally, you can set thresholds via separate configs for stocks & indices that will determine if the price is relatively equal and lastly allow you to configure where the indicator line should be drawn, the first, last or all the values.
Additional notes:
This uses a different approach then my “equal highs/lows” indicator to identify price levels and because it focuses specifically on relative as opposed to exact values it is entirely different and may show “weaker”, but still important levels of liquidity. This indicator is more suited for analysis of stocks and indices or higher-timeframes where price-action rarely forms exact equal values instead more frequently forming almost equal values. My other indicator is more suited for smaller (15m or less) timeframe on indices where exact equal prices are often identical. Depending on situation different indicators should be used.

Log Regression Channel [UAlgo]The "Log Regression Channel " channel is useful for analyzing price trends and volatility in a financial instrument over a specified period. By using logarithmic scaling, this indicator can more effectively handle the wide range of price movements seen in many financial markets, making it particularly valuable for assets with exponential growth characteristics.
The indicator plots the central regression line along with upper and lower deviation bands, providing a visual representation of potential support and resistance levels.
🔶 Key Features
Logarithmic Regression Line: The central line represents the logarithmic regression, which fits the price data over the specified length using a logarithmic scale. This helps in identifying the overall trend direction.
Deviation Bands: The upper and lower bands are plotted at a specified multiple of the standard deviation from the regression line, highlighting areas of potential overbought and oversold conditions.
Customizable Parameters: Users can adjust the length of the regression, the deviation multiplier, the color of the labels, and the size of the text labels to suit their preferences.
R-Squared Display: The R-squared value, which measures the goodness of fit of the regression model, is displayed on the chart. This helps traders assess the reliability of the regression line.
🔶 Calculations
The indicator performs several key calculations to plot the logarithmic regression channel:
Logarithmic Transformation: The prices and time indices are transformed using the natural logarithm to handle exponential growth in price data.
Regression Coefficients: The slope and intercept of the regression line are calculated using the least squares method on the transformed data.
Predicted Values: The regression equation is used to calculate predicted values for each data point.
Standard Deviation: The standard deviation of the residuals (differences between actual and predicted values) is computed to determine the width of the deviation bands.
Deviation Bands: Upper and lower bands are plotted at a specified multiple of the standard deviation above and below the regression line.
R-Squared Value: The R-squared value is calculated to measure how well the regression line fits the data. This value is displayed on the chart to inform the user of the model's reliability.
🔶 Disclaimer
The "Log Regression Channel " indicator is provided for educational and informational purposes only.
It is not intended as investment advice or a recommendation to buy or sell any financial instrument. Trading financial instruments involves substantial risk and may not be suitable for all investors.
Past performance is not indicative of future results. Users should conduct their own research.

Support and Resistance [CryptoSea]The Support and Resistance Indicator is a powerful tool developed by CryptoSea for traders seeking to identify key market levels with precision. This script leverages advanced pivot and volume analysis to highlight support and resistance zones on the price chart.
Key Features
Multi-Source Pivot Analysis: Choose between wicks or body prices for calculating pivot points, providing flexibility in market analysis.
Volume Spike Detection: Automatically identifies volume spikes using a customizable threshold multiplier, enhancing the accuracy of support and resistance levels.
Dynamic Box Display: Configurable options for extending and graying out boxes based on price interaction, ensuring a clear visual representation of active and invalidated zones.
In the example below, we see a resistance box formed based on wick highs and a volume spike. The box extends to where we see price rejecting from it. In the settings you can change this so the box will stop if price touches it if you prefer.
How it Works
Pivot Point Calculation: The script determines pivot highs and lows using either wicks or body prices over a specified term (Short, Medium, Long), corresponding to 5, 15, or 30 bars.
Volume Analysis: Calculates average volume over twice the pivot length and identifies volume spikes exceeding the user-defined threshold, crucial for confirming support and resistance levels.
Box Management: Maintains arrays of support and resistance boxes, limiting the number based on user settings (All, Recent Few, Recent Several).
Settings Explained
Source: Choose between 'Wicks' or 'Bodies' to determine whether pivot points are calculated using candle wicks or body prices.
Pivot Term: Select 'Short' (5 bars), 'Medium' (15 bars), or 'Long' (30 bars) to adjust the distance for pivot calculation. Longer terms take more bars to confirm support/resistance.
Volume Threshold (multiplier): Set a multiplier of average volume to detect volume spikes, essential for validating support/resistance levels.
Extend Until Price Hits: Enable this to extend support/resistance boxes until the price touches them, providing dynamic levels.
Gray Out Boxes Once Hit: Enable this to gray out the boxes once the price interacts with them, indicating that they are no longer active.
Max Boxes Displayed: Choose 'All', 'Recent Few' (up to 3 boxes each for bull and bear), or 'Recent Several' (up to 10 boxes each for bull and bear) to control the number of visible boxes.
Invalidate Condition: Select 'Touch' to invalidate a box when the price touches it or 'Through' to invalidate when the price passes entirely through the box.
Candle Colors: Option to color candles based on neutral, bullish, or bearish conditions for easier visual analysis.
Application
Strategic Planning: Assists traders in pinpointing potential entry and exit points by marking significant support and resistance zones.
Trend Confirmation: Validates trend strength and potential reversals with volume-based analysis of support and resistance levels.
Customizable Settings: Tailors analysis to various trading strategies with extensive input settings for pivot source, term, volume threshold, and display preferences.
The Support and Resistance Indicator by is an essential addition to any trader’s toolkit, offering robust and customizable market level analysis for improved trading decisions.

Support and Resistance (High Volume Boxes) [ChartPrime]Support and Resistance (High Volume Boxes)
◆ Overview:
The "Support and Resistance" indicator identifies key support and resistance levels using pivot points and volume analysis. It visually represents these levels with dynamically colored boxes, indicating the strength of the volume. This helps traders recognize potential price reversals and key zones for buy and sell opportunities.
◆ Key Features:
Dynamic Support and Resistance Boxes:
The indicator plots support and resistance boxes based on pivot points and volume above threshold for positive volume boxes and below lower threshold for negative volume boxes.
Box colors change from transparent to more intense based on volume, reflecting the strength of support or resistance.
Boxes expands until a new box of the same type appears.
Volume-Based Color Coding:
Boxes are color-coded based on the amount of volume:
Green boxes indicate support levels with positive volume.
Red boxes indicate resistance levels with negative volume.
Hold Signals:
Green diamonds (◆) indicate when support holds, signaling potential buy opportunities.
Red diamonds (◆) indicate when resistance holds, signaling potential sell opportunities.
Breakout Labels:
If the price falls below a support level, that level will become resistance. If the price rises above a resistance level, it will often become support. As the price moves past a level of support or resistance, it is thought that supply and demand has shifted, causing the breached level to reverse its role.
Labels "Break Sup" and "Break Res" are displayed when support or resistance levels are broken, indicating significant market movements.
◆ Break Resistance:
◆Break Support:
◆ Usage Notes:
This indicator helps traders identify strong support and resistance levels, offering visual cues for potential price reversals.
By analyzing volume at these levels, traders can gauge the strength of these zones and make more informed trading decisions.
◆ Settings:
Lookback Period: The number of bars to look back for pivot points.
Delta Volume Filter Length: The length of the volume filter for more accurate volume analysis. (Higher input, will filter low volume boxes)
Adjust Box Width: Adjusts the width of the support and resistance boxes.
This indicator is designed to enhance your trading by providing clear visual cues for support and resistance levels based on volume, making it easier to spot potential price reversals and key trading opportunities.

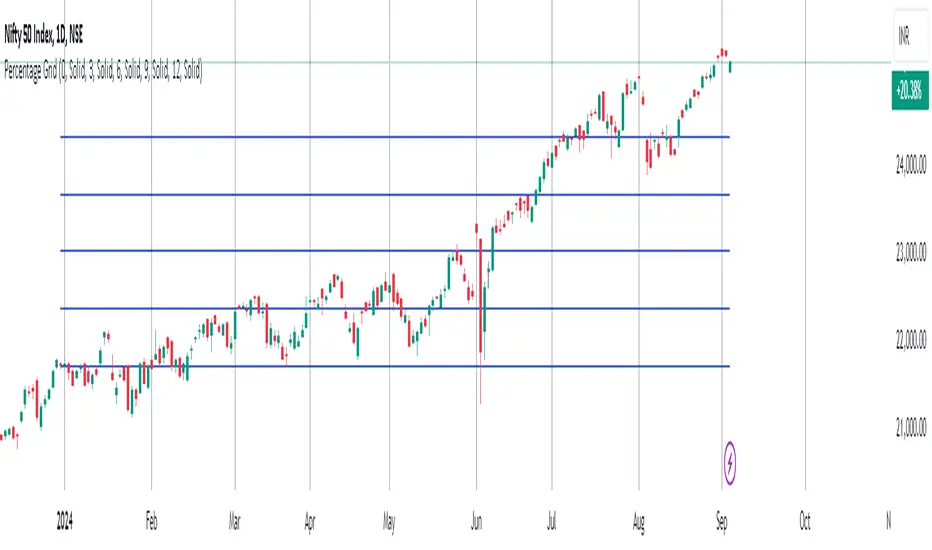
Percentage GridPercentage Grid Indicator
Description:
The Percentage Grid indicator is designed to assist traders in identifying significant support and resistance levels based on yearly percentage changes. This indicator plots horizontal lines on the chart from the start of the year, allowing you to customize how much percentage each line represents. Currently, you can set up to 5 horizontal lines, each representing a different percentage change from the beginning of the year.
For instance, when applied to the SBI Bank stock, you can customize the lines to display various percentage changes from the start of the year, such as 20%, 25%, and up to 35%, as the SBIN stock is currently trading around these levels. This visualization helps traders to easily identify key levels where price action tends to react, providing valuable insights for making trading decisions.
Principles of Trading Technical Analysis:
The Percentage Grid indicator is grounded in the principle of support and resistance levels, which are fundamental concepts in technical analysis. These levels are specific price points on a chart that tend to act as barriers, preventing the price from getting pushed in a certain direction. The indicator helps in:
Identifying Support Levels: Price levels where a downtrend can be expected to pause due to a concentration of buying interest.
Identifying Resistance Levels: Price levels where an uptrend can be expected to pause due to a concentration of selling interest.
By customizing and plotting percentage-based horizontal lines, the indicator highlights these critical levels based on the percentage change from the start of the year.
How to Use:
Add the Indicator to Your Chart:
Search for "Percentage Grid" in the TradingView indicator library and add it to your chart.
Customize Percentage Levels:
Access the indicator settings to customize the percentage change each line represents.
You can set up to 5 different percentage levels. For example, you can set lines at 20%, 25%, 30%, 35%, and 40%.
Interpret the Grid Lines:
The plotted lines will represent the specified percentage changes from the start of the year.
Use these lines to identify potential support and resistance levels where price action is likely to react.
Practical Application:
Look for price bounces or reversals around these levels, which can indicate strong support or resistance.
Combine the Percentage Grid with other technical analysis tools, such as moving averages or trend lines, to confirm potential trading opportunities.
Example:
In the accompanying screenshot, the Percentage Grid is applied to the SBI Bank stock. The lines are set to display 20%, 25%, 30%, 35%, and 40% changes from the start of the year. Notice how the price action respects these levels, providing clear areas where support and resistance are evident.
By incorporating the Percentage Grid into your trading strategy, you can enhance your ability to identify key price levels and make more informed trading decisions.
Happy Trading!
CARNAC Trading Support and Resistance LevelsOverview
The "Carnac Trading Support and Resistance Levels" indicator is a powerful tool designed to help traders identify key support and resistance levels across multiple timeframes. This tool enhances trading strategies by visually marking significant price levels and providing configurable stop-loss and alert features.
Features
Support and Resistance Levels: Automatically calculates and plots support and resistance levels for the following timeframes:
5 minutes (5M)
10 minutes (10M)
15 minutes (15M)
30 minutes (30M)
1 hour (1H)
2 hours (2H)
4 hours (4H)
6 hours (6H)
12 hours (12H)
1 day (1D)
1 week (1W)
1 month (1M)
Configurable Stop-Loss (SL) Levels: Adds a stop-loss line below each support level and above each resistance level with customizable padding (as a percentage).
Visual Labels: Clearly labels support, resistance, and stop-loss levels with the corresponding prices and timeframes for easy identification.
Line Customization:
Support Levels: Green lines with varying thickness based on the timeframe.
Resistance Levels: Red lines with varying thickness based on the timeframe.
Stop-Loss Levels: Gray dotted lines for clear distinction.
Alerts: Alerts trigger when the price gets to a configurable percentage from the support or resistance levels, helping you stay informed about potential buying and selling opportunities.
Visibility Toggling: Easily toggle the visibility of support and resistance levels for each timeframe (default enabled for 2H, 4H, and 1D).
How to Use
Add the Indicator:
Navigate to the TradingView Pine Editor.
Paste the provided Pine Script code and click "Add to Chart."
Configure Inputs:
Lookback Periods: Adjust the lookback periods for each timeframe to suit your analysis needs.
Padding Percentage: Set the padding percentage for the stop-loss levels to define the distance below the support levels and above the resistance levels.
Visibility: Toggle the visibility of the support and resistance levels for each timeframe as needed (default enabled for 2H, 4H, and 1D).
Alert Trigger Distance: Set the alert trigger distance as a percentage to determine when the alerts should be triggered.
Interpret the Plotted Levels:
Green Lines: Indicate support levels for the respective timeframes.
Red Lines: Indicate resistance levels for the respective timeframes.
Gray Dotted Lines: Represent the stop-loss levels below each support level and above each resistance level, with the specified padding.
Labels: Provide clear indications of the price levels and their respective timeframes in white text for visibility.
Identifying Buying and Selling Opportunities:
Buying Opportunities:
Look for the price to approach or bounce off a support level (green line).
Confirm the potential for a reversal by checking if the price is nearing a key support level from multiple timeframes.
Use the stop-loss level (gray dotted line) to set your stop-loss order below the support level to minimize risk.
Selling Opportunities:
Look for the price to approach or get rejected at a resistance level (red line).
Confirm the potential for a reversal by checking if the price is nearing a key resistance level from multiple timeframes.
Use the stop-loss level (gray dotted line) to set your stop-loss order above the resistance level to minimize risk.
Alerts:
Alerts will notify you when the price gets within the specified percentage distance from each support or resistance level.
Use these alerts to stay informed about potential buying and selling opportunities.

Breakouts with Tests & Retests [LuxAlgo]The Breakouts Tests & Retests indicator highlights tests and retests of levels constructed from detected swing points. A swing area of interest switches colors when a breakout occurs.
Users can control the sensitivity of the swing point detection and the width of the swing areas.
🔶 USAGE
When a Swing point is detected, an area of interest is drawn, colored green for a bullish swing and red when bearish.
A test is confirmed when the opening price is situated in the area of interest, and the closing price is above or below the area, depending on whether it is a bullish or bearish swing. Tests are highlighted with a solid-colored triangle.
A breakout is confirmed when the price closes in the opposite position, below or above the area, in which case the area will switch colors.
If the opening price is located within the area and the closing price closes outside the area, in the same direction as the breakout, this is considered a retest . Retests are highlighted with a hollow-colored triangle.
Note that tests/retests do not act on wicks. The main factor is that the opening price is in the area of interest, while the closing price is outside.
🔹 Area Of Interest Width
The user can adjust the width of the swing areas. Changing the " Width " is a fast and easy way to find different areas of interest.
A higher "Multiple" setting would return a wider area, allowing price to develop within it for a longer period of time and potentially provide later test signals.
When a swing area is broken, a higher "Width" setting can make it more complicated for the price to break it again, allowing a swing area to remain valid for a longer period of time thus potentially providing more retest signals.
🔶 DETAILS
Generally, only one bullish/bearish pattern can be active at a time. This means that no more than 1 bullish or bearish area will be active.
The " Display " settings, however, can help control how areas of different types are displayed.
Bullish AND Bearish: Both, bullish and bearish patterns can be drawn at the same time
Bullish OR Bearish: Only 1 bullish or 1 bearish pattern is drawn at a time
Bullish: Only bullish patterns
Bearish: Only bearish patterns
🔹 Test/Retest Labels
The user can adjust the settings so only the latest test/retest label is shown or set a minimum number of bars until the next test/retest can be drawn.
🔹 Maximum Bars
Users can set a limit of bars for when there is no test/retest in that period; the area of interest won't be updated anymore and will be available and ready for the next Swing.
An option for pulling the area back to the last retest is included.
🔶 SETTINGS
Display: Determines which swing areas are displayed by the indicator. See the "DETAILS" section for more information
Multiple: Adjusts the width of the areas of interest
Maximum Bars: Limit of bars for when there is no test/retest
Display Test/Retest Labels: Show all labels or just the last test/retest label associated with a swing area
Minimum Bars: Minimum bars required for a subsequent test/retest label are allowed to be displayed
Set Back To Last Retest: When after "Maximum Bars" no test/retest is found, place the right side of the area at the last test/retest
🔹 Swings
Left: x amount of wicks on the left of a potential Swing need to be higher/lower for a Swing to be confirmed.
Right: The number of wicks on the right of a potential swing needs to be higher/lower for a Swing to be confirmed.
🔹 Style
Bullish: color for test period (before a breakout) / retest period (after a breakout)
Bearish: color for test period (before a breakout) / retest period (after a breakout)
Label Size

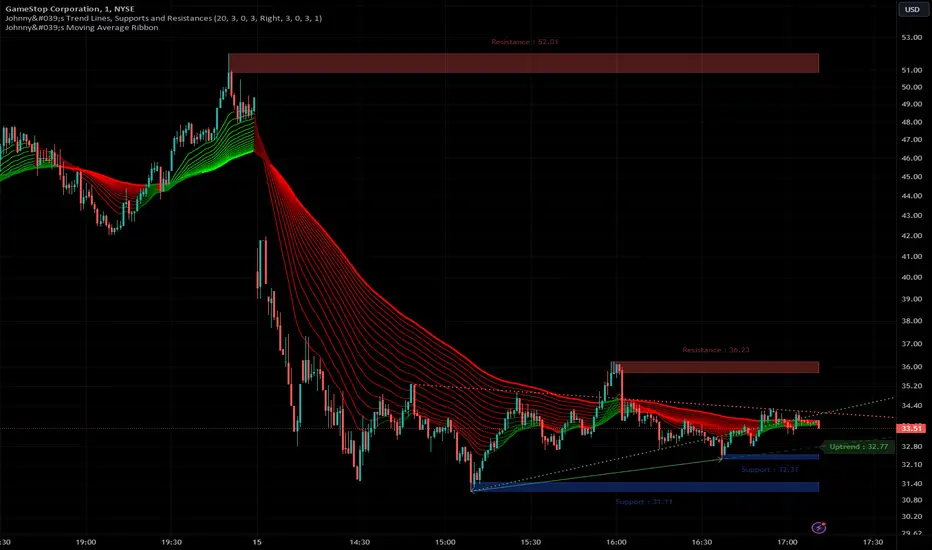
Johnny's Trend Lines, Supports and ResistancesInspired and based on ismailcarlik's Trend Lines, Supports and Resistances.
Additions include an overall upgrade to Pinescript v5, changes in the way resistance and support levels are calculated, improved visual queues, and additional customization options.
This indicator is meticulously crafted to provide traders with visual tools for identifying trend lines, support, and resistance levels, enhancing the decision-making process in trading activities.
Features and Functionality
Trend Lines: The indicator allows users to enable or disable trend lines, adjust the number of points to check for establishing a trend, and set parameters for trend validation, including the maximum violation and exceptions for the last bars.
Support and Resistance: It offers tools to identify and visualize key support and resistance levels based on recent pivot points. This includes adjustable parameters for the maximum violations allowed and the exclusion of recent bars from the analysis.
Pivot Points: Users can define the pivot length for calculating highs and lows, which helps in marking significant pivot points that are instrumental in trend analysis.
Alerts and Notifications: The indicator is equipped with customizable alerts for trend line breaches and pivot point formations, which can be set to trigger at different frequencies based on user preference.
How It Works
Input Flexibility: Users can adjust various settings like the length of trend lines and pivot points, enabling or disabling specific features like marking pivots, and managing alert settings directly from the indicator’s input panel.
Dynamic Analysis: By analyzing the price action relative to the calculated trend lines and pivot points, the indicator dynamically identifies potential trend reversals, continuations, and significant price levels.
Visualization: It plots trend lines and marks support and resistance levels directly on the chart, with options to extend these lines and add labels for better clarity. Violated trend lines can be visually differentiated by changing their style and width.
Practical Application
Trend Line Strategy: Traders can use the trend lines to determine the strength of the current market trend and to spot potential reversal points.
Support and Resistance Strategy: By marking where the price has historically faced resistance or found support, traders can plan entry and exit points, set stop-loss orders, or identify breakout opportunities.
Pivot Points Strategy: Pivot points serve as vital indicators for intraday trading or long-term trend analysis, providing insights into potential support and resistance levels.
Customization and Alerts
Custom Alerts: Traders can set alerts for when the price crosses trend lines or when new support or resistance levels are formed, helping them stay informed of critical market movements without having to continuously monitor the charts.
Visual Customization: Users can personalize the appearance of trend lines and labels, choosing from a variety of colors and styles to match their chart setup or preferences.
"Johnny's Trend Lines, Supports and Resistances" is an essential tool for traders who rely on technical analysis, offering detailed insights and real-time updates on market conditions, trend strength, and potential price barriers.
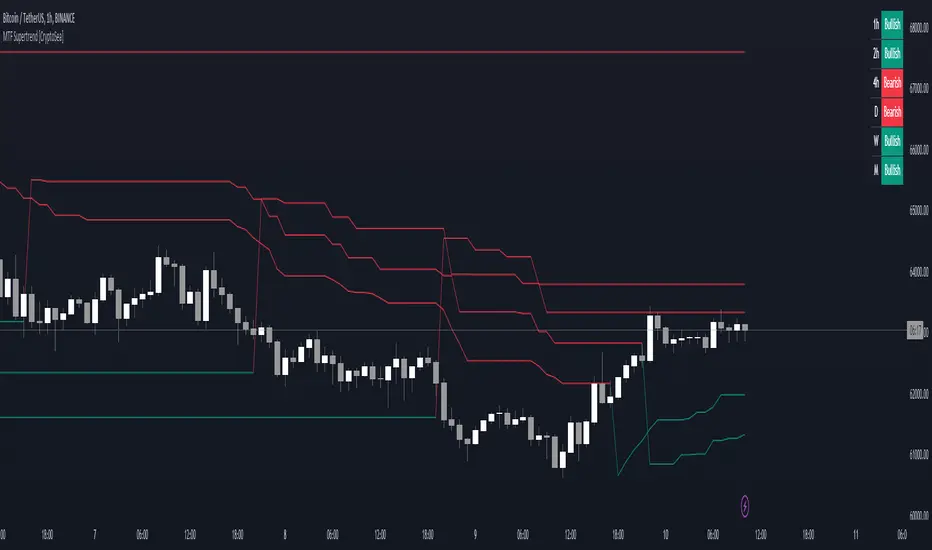
MTF Supertrend [CryptoSea]The MTF Supertrend Indicator is a versatile tool crafted to enhance trend analysis across multiple timeframes. Leveraging the reliable Supertrend formula, it provides traders with a comprehensive view of market trends and potential reversal points.
Key Features
Multi Timeframe Analysis: Tracks Supertrend signals over a variety of timeframes, offering a broad perspective on market direction.
Percentage Threshold Display: Filters out Supertrend data that is not within a specified percentage of the current price, keeping the display focused on relevant trends.
Adaptive Visual Display: Features a dynamic table that shows the current Supertrend status, which is fully customizable to the user's display preferences.
Customizable Sensitivity: Users can fine-tune the factor and ATR period settings, allowing for personalized trend sensitivity.
How it Works
Supertrend Calculation: Computes the Supertrend using the Average True Range (ATR) multiplied by a customizable factor, detecting changes in volatility and trend.
Higher Timeframe Filtering: Prioritizes higher timeframe trends over the current chart's timeframe to avoid chart clutter and focus on the most significant trends.
Colour-Coded Trends: Utilizes colour coding to clearly indicate bullish and bearish trends, aiding quick visual analysis.
Responsive Display Options: Includes a switchable table view to overlay trend information on the chart, with options for dark and light themes.
Benefits for Different Trading Styles
Day Traders: Use real-time updates to catch short-term trend reversals and ride the momentum for quick profits.
Swing Traders: Benefit from viewing medium to long-term trends to formulate strategies that span several days or weeks.
Position Traders: Utilize the monthly supertrend data to make long-term investment decisions based on prevailing market directions.
Application
Strategic Decision-Making: Assists traders in making informed decisions by providing a layered view of trend directions across timeframes.
Trend Confirmation: Reinforces trading strategies by confirming trends with higher timeframe Supertrend alignment.
Customized Analysis: Adapts to various trading styles with input settings that control the display and sensitivity of trend data.
The MTF Supertrend Indicator by is a powerful addition to the trader's toolkit, enhancing multi-timeframe trend analysis and contributing to a strategic trading approach in volatile markets.
Liquidations [ChartPrime]Liquidations Indicator:
The Liquidations indicator is a powerful tool designed to help traders identify significant liquidation levels in financial markets. By analyzing volume data over a specified lookback period, the indicator highlights potential areas where market participants with high leverage positions may face liquidation, providing valuable insights into market dynamics.
Usage:
Traders can use the Liquidations indicator to:
◈ Identify liquidity grab opportunities: Liquidation levels often attract price action as market participants with leveraged positions face the risk of forced liquidation. Traders can anticipate price movements as the market aims to trigger these stops, potentially leading to rapid price movements or reversals.
◈ Confirm trend strength: A cluster of liquidation levels in the same direction as the prevailing trend may confirm the strength of the trend, while divergences between liquidation levels and price movements may signal potential trend reversals.
Settings:
◈ Previous Value Bars Back: Specifies the number of previous bars used in calculating the liquidation levels.
◈ Show Leverage: Allows users to selectively display liquidation levels for different leverage multiples, including 5x, 10x, 25x, 50x, and 100x.
◈ Liquidation Levels Width: Sets the width of the lines representing liquidation levels on the chart.
◈ Short Liquidations Color: Specifies the color of the lines representing short liquidation levels.
◈ Long Liquidations Color: Specifies the color of the lines representing long liquidation levels.
◈ Bar Color: Sets the color of the background bar when the indicator is active.
Visual Representation:
◈ Liquidation levels are plotted as horizontal lines on the chart, with different colors representing short and long liquidation levels.
◈ Each liquidation level is labeled with the corresponding leverage multiple (e.g., 5x, 10x, etc.).
A dashboard displays the active liquidation levels for each leverage multiple, allowing traders to quickly assess the current market conditions.
◈ Time Window allows users to cut off unnecessary part of the chart and concentrate on a current active part of the chart to make better trading decisions:
Interpretation:
Market participants tend to place stop-loss orders near liquidation levels , creating clusters of pending orders. As price approaches these levels, it may trigger a cascade of stop-loss orders, providing liquidity for market orders and potentially leading to rapid price movements in the opposite direction.
Traders can anticipate price reversals or accelerations as price interacts with liquidation levels, using them as reference points for identifying potential entry or exit opportunities.
Note:
While the Liquidations indicator provides valuable insights into market dynamics, traders should use it in conjunction with other technical analysis tools and risk management strategies to make informed trading decisions.

Support Resistance base Volume RSIThe indicator displays support and resistance levels based on volume and the Relative Strength Index (RSI).
Variable and Input Assignment:
lookback: Determines the period for data lookback.
RsiVisible, RsilabelSize, OversoldForRsi, OverboughtForRsi: Various inputs to adjust RSI indicator parameters.
Indicator Calculation:
highestVol: Finds the highest volume within a certain period.
Rsi: Calculates the RSI value with a period of 14.
roc: Calculates the Rate of Change.
Support and Resistance Level Determination:
Uses a comparison between price change (roc) and RSI value to determine whether the price is rising or falling.
If the price is rising and the current volume is greater than the previous highest volume, a new resistance level is established.
If the price is falling and the current volume is greater than the previous highest volume, a new support level is established.
Support and Resistance Lines:
Creates lines indicating the latest support and resistance levels.
These lines are updated whenever there is a change in support or resistance levels.
RSI Labels:
Displays the RSI value above or below the price chart depending on whether the RSI is above or below the overbought or oversold levels.
If the RSI value is above the overbought level, the label is displayed above the price.
If the RSI value is below the oversold level, the label is displayed below the price.
Labels are removed if the corresponding conditions are not met.
Additional RSI Label:
Adds an additional label displaying the RSI value next to the price chart on the last bar.
The main purpose of this script is to assist traders in identifying support and resistance levels based on price movement, volume, and the RSI indicator. Thus, traders can use this information to make better trading decisions.

Previous Day and Week RangesI've designed the "Previous Day and Week Ranges" indicator to enhance your trading strategy by clearly displaying daily and weekly price levels. This tool shows Open-Close and High-Low ranges for both daily and weekly timeframes directly on your trading chart.
Key Features :
Potential Support and Resistance: The indicator highlights previous day and week ranges that may serve as key support or resistance levels in subsequent trading sessions.
Customizable Display Options: Offers the flexibility to show or hide daily and weekly ranges based on your trading needs.
Color Customization: Adjust the color settings to differentiate between upward and downward movements, enhancing visual clarity and chart readability.
This indicator is ideal for traders aiming to understand market dynamics better, offering insights into potential pivot points and zones of price stability or volatility.
