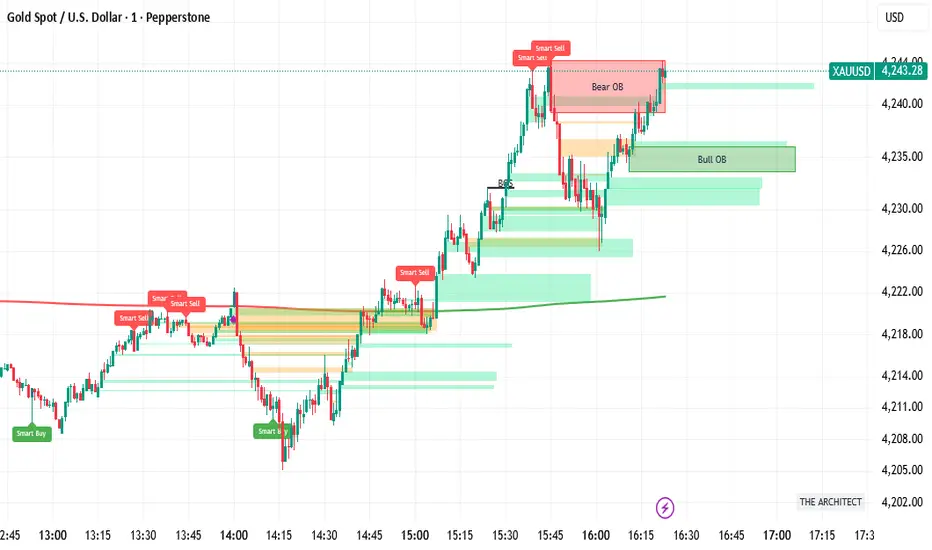
Sultan Weekly Level Manager XAUUSDThis script is a comprehensive "Level Management Utility" designed to help traders efficiently map, monitor, and react to their weekly Support and Resistance plans.
Instead of manually drawing rectangles and lines every week, this tool allows traders to input their specific price levels (Buy Zones, Sell Zones, and Invalidation Levels) into the settings. The script then automatically renders these zones, sets up alert conditions, and provides essential technical context (Trend and Momentum) in a single workspace.
Why this is a "Manager" (Use Case): Many traders execute "Level-to-Level" plans. This script streamlines that workflow by:
Visual Automation: Instantly drawing standardized zones based on user inputs.
Context Integration: Unlike simple drawing tools, this script integrates EMA Trend Filters (50/200 EMA) and RSI Momentum monitoring directly alongside the manual levels. This allows the trader to see if a price level is being approached with high momentum (RSI Overbought/Oversold) or against the major trend (EMA Cross), reducing the risk of blind limit orders.
Dashboard: A mini-dashboard tracks the current status (e.g., "Inside Buy Zone 1") so traders can assess the state of their plan at a glance.
How to Use:
Step 1: Open the settings and input your weekly Buy/Sell zone coordinates (High and Low prices). Note: The default values are placeholders; you must update them based on your analysis.
Step 2: Use the Trend Context (EMAs) to decide if you are trading with the flow or against it.
Step 3: Use the Momentum Context (RSI) to wait for overbought/oversold conditions before entering a zone.
Features:
Customizable Zones: 2 Buy Zones, 1 Sell Zone, 1 Invalidation Line.
Confluence Tools: Integrated 50/200 EMA and RSI readout.
Alerts: Built-in alert conditions trigger when price enters any of your defined zones.
Credits:
EMA and RSI logic are based on standard open-source library calculations.
Zone plotting logic utilizes standard Pine Script drawing functions.
サポート&レジスタンス

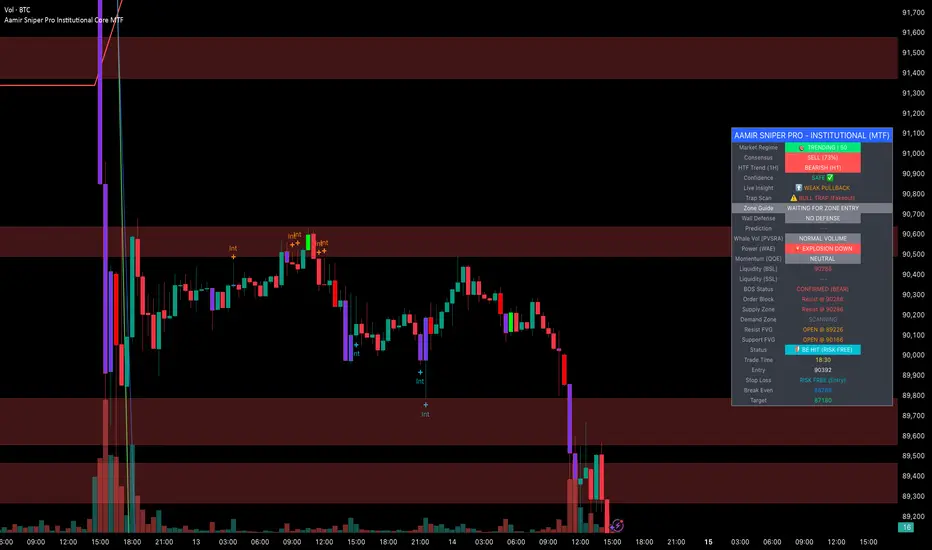
Aamir Sniper Pro Institutional Core MTFConcept & Utility: This script is a comprehensive "Multi-Factor Confluence System" designed to filter out market noise by requiring agreement between Trend, Momentum, Volatility, and Market Structure before generating a signal.
Many traders struggle with false signals generated by single indicators. This script solves that problem by using a Consensus Engine. Instead of relying on just one moving average or oscillator, this script aggregates data from over 20 different technical methods. It then applies strict filters (WAE, ADX, and MTF) to ensure that trades are only suggested during high-probability market conditions.
How the Components Work Together:
1. The Consensus Engine (The Core Logic): At the heart of the script is a voting system. It calculates the slope and direction of:
Fast/Slow EMAs, SMAs, WMAs, and Hull MA.
Ichimoku Cloud (Baseline/Conversion line).
SuperTrend and Parabolic SAR.
Oscillators (RSI, Stochastic, CCI).
Result: It generates a "Consensus Score" (0-100%). A signal is ONLY considered if the Bullish or Bearish score exceeds the user-defined threshold (Default: 70%).
2. The Filtering Layers (Why this is not just a mashup): A high consensus score alone is not enough. The script validates the signal through three mandatory filters:
Volatility Filter (WAE): Uses Waddah Attar Explosion logic to ensure there is enough volume/power to sustain the move.
Regime Filter (ADX): Checks the Average Directional Index. If the market is choppy (ADX < 25), the signal is blocked to prevent whipsaws.
MTF Filter: Checks the trend on a Higher Timeframe (Default: 1 Hour). It forces the user to trade only in the direction of the dominant trend.
3. Structural Context (SR Zones): We have integrated Dynamic Support & Resistance Zones based on Pivot Points.
Purpose: This provides immediate structural context. Even if the Consensus Engine gives a "BUY" signal, the trader can see if price is currently sitting at a "Resistance Box." This visual aid prevents buying into supply or selling into demand.
4. Institutional Volume (PVSRA): Candles are colored based on Volume Spread Analysis (PVSRA) concepts.
Purple/Blue Candles: Indicate "Whale Activity" (Volume > 200% of average). This helps confirm if institutional money is backing the move identified by the Consensus Engine.
5. Momentum Confirmation (QQE): The Qualitative Quantitative Estimation (QQE) is displayed on the dashboard to confirm short-term momentum direction, acting as the final trigger.
Features:
Sniper Mode: Option to wait for a candle retest before entry.
Dashboard: Displays the live Consensus Score, Market Regime, and Trend Status.
Risk Management: Auto-calculates SL/TP based on Swing High/Low or ATR.
Credits & Attribution:
WAE Logic: Adapted from the work of Waddah Attar.
PVSRA: Volume concepts adapted from the Traderathome/PVSRA community.
QQE: Adapted from standard open-source logic.
SR Zones: Logic derived from standard Pivot Point calculations.
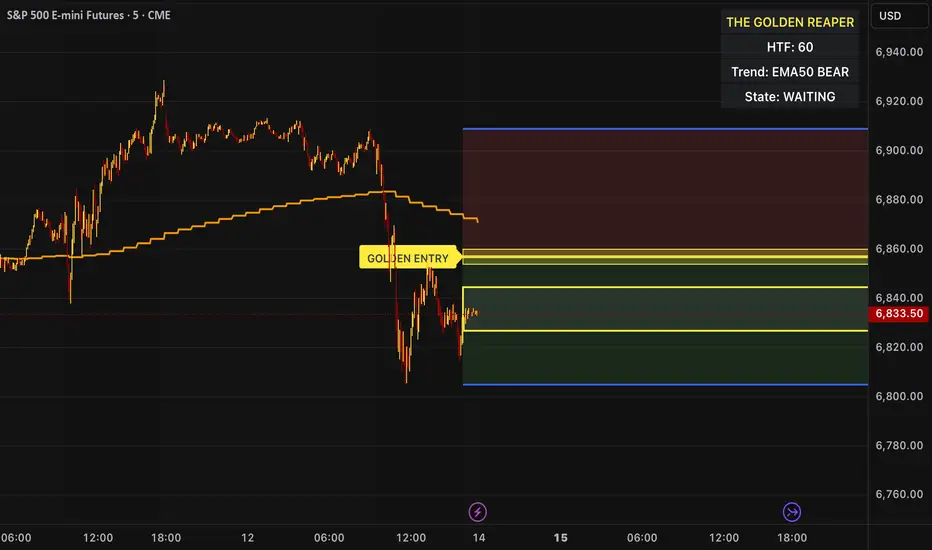
The Golden Reaper 🟡 THE GOLDEN REAPER
HTF OTE + EMA50 — Futures Scalping Framework
The Golden Reaper is a high-timeframe execution framework designed specifically for futures scalpers who trade with precision, patience, and structure.
This indicator focuses on HTF market structure, Optimal Trade Entry (OTE) zones, and equilibrium (50%) reclaim confirmation to identify high-probability execution areas for fast, controlled scalps.
It is not a signal spam tool.
It is a framework built for disciplined traders who wait for price to come to them.
⸻
🔑 Designed For
✔ Futures markets (ES, NQ, MNQ, MES, GC, MGC, CL, etc.)
✔ Scalpers & intraday traders
✔ 1H structure → 5m / 1m execution
✔ Traders who prefer few high-quality setups
⸻
🧠 Core Logic (How It Works)
1️⃣ High-Timeframe Structure (HTF)
The indicator identifies the most recent HTF swing high and low to define the active trading leg.
2️⃣ OTE Zone (Premium / Discount)
Price is expected to react within the OTE zone where liquidity is commonly targeted.
3️⃣ Golden Entry (EQ 50%)
The 50% equilibrium level is marked as the Golden Entry.
Price must reclaim this level for a setup to become valid.
4️⃣ Golden Execution Zone
After reclaim, a golden execution zone appears to define where entries are allowed.
5️⃣ EMA 50 Trend Filter
Trades are taken only in the direction of the HTF EMA 50 to avoid counter-trend scalps.
⸻
⚡ How Futures Scalpers Use It
Recommended Timeframes
• HTF Structure: 1 Hour
• Execution: 5 Minute / 1 Minute
Process
• Wait for price to reach the OTE zone
• Allow the setup to arm
• Enter only after price reclaims the Golden Entry
• Execute within the Golden Execution Zone
• Manage stops and targets manually
This approach helps scalpers:
✔ Avoid chasing price
✔ Reduce over-trading
✔ Improve entry precision
✔ Maintain consistency
⸻
🔔 Alerts Included
• OTE Touched – Setup is armed
• C-Reclaim Confirmed – Entry condition met
(Alerts are designed to assist — not replace — trader judgment.)
⸻
⚠️ Important Notes
• Designed for futures markets only
• Best used with price action confirmation
• No built-in stop loss or take profit (manual risk management required)
• Not financial advice
⸻
🧬 Who This Indicator Is For
✔ Futures scalpers
✔ ICT / Smart Money traders
✔ Structure-based traders
✔ Traders who value patience over frequency
❌ Not for:
• Signal chasers
• Indicator stacking
• Automated trading
• Beginners who want instant entries
⸻
🟡 Created By
ChartReaper / Tactiko
Instagram:
@officialchartreaper
@tactiko
Prev TF CLOSE EMA Box (Resets Every TF)⚙️ Key Features
✅ Custom reset timeframe (independent of chart TF)
✅ Uses previous CLOSED EMA (no lookahead)
✅ Box instead of line (clearer structure)
✅ Optional “disrespected → gray” logic
✅ Wick-based or close-based validation
✅ Works on futures, crypto, forex, equities
📈 How to Use
Treat the box as a dynamic support / resistance zone
Best used for:
Trend continuation
Mean reversion
Bias filtering (above = bullish, below = bearish)
When the box turns gray, the EMA level has lost structural validity
❗ Important Notes
This is not a signal indicator
No entries or exits are generated
Designed for context, bias, and structure
Combine with price action, liquidity, or session logic
🧩 Inputs Explained
Reset / EMA TF → timeframe used for EMA calculation & box reset
EMA Length → standard EMA length (default 9)
Box Height → thickness of the EMA zone
Disrespect Logic → optional invalidation behavior

First 5-Min Candle DetectorHighlights the high and low of the first 5-minute candle of the regular trading session, beginning at 9:30am EST.

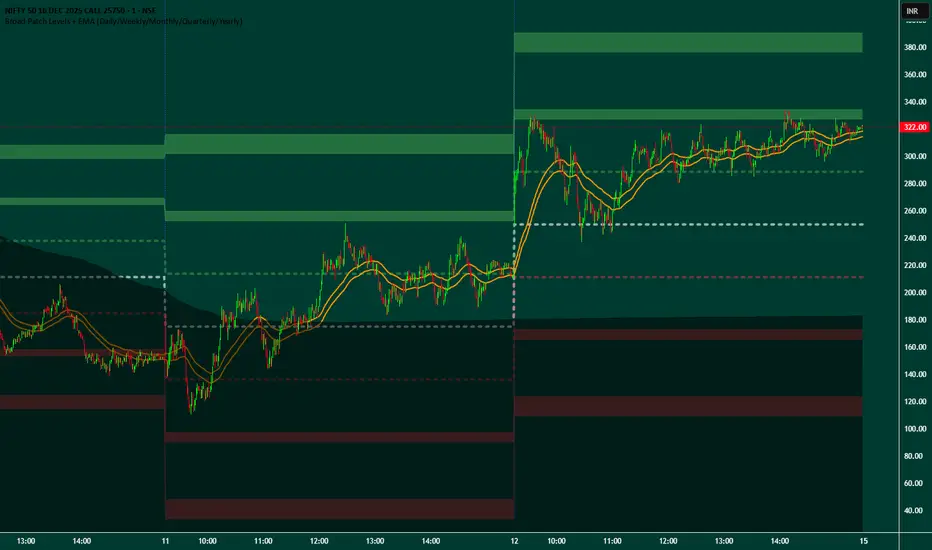
Broad Patch Levels + EMA (Daily/Weekly) with Directional AlertsThis indicator provides dynamic support and resistance levels along with trend guidance using EMA lines for daily or weekly timeframes. It is fully customizable, offering toggles for individual levels, trend lines, and alert notifications.
Key highlights:
Clearly visualize key market levels for potential trade entries and exits.
Monitor trend direction with EMA-based guidance.
Receive alerts when price interacts with important levels or trend zones.
Configurable visibility and alert options for a clean and personalized chart layout.
Ideal for professional traders looking for a structured, easy-to-read market perspective without exposing proprietary methods or calculations.
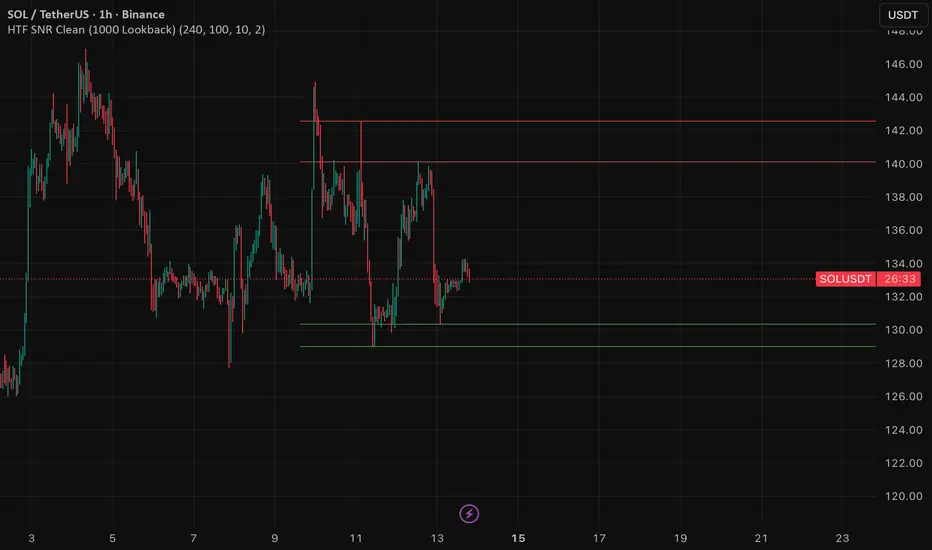
HTF SNR MMW✔ HTF SNR
✔ Non-repaint
✔ Limit 1000 candle
✔ Support & Resistance
✅ Full HTF SNR Final Clean
• ✅ Lookback 1000 candle
• ✅ Timeframe selectable (D / W)
• ✅ Support & Resistance
• ✅ Tidak repaint
• ✅ Tanpa error editor
Daily Levels [cryptalent]Daily High / Low / Mid / Open Levels is a session-based reference indicator designed to visualize key daily price levels directly on the chart.
This indicator automatically plots the Daily High, Daily Low, Daily Midpoint (High + Low / 2), and Daily Open as horizontal lines for each trading day. These levels help traders quickly identify important structural prices where liquidity, reactions, or acceptance often occur.
Key Features
Automatic Daily Levels
Plots Daily High (H), Low (L), Mid (M), and Open (O) using higher-timeframe daily data.
Levels update in real time as the current day develops.
Multi-Day History
Displays daily levels for a configurable number of past days.
Older levels are automatically removed to keep the chart clean.
Line Extension
Current day levels can be extended forward by a user-defined number of bars.
Useful for projecting intraday reaction zones and liquidity targets.
Visual Customization
Independent line width and color settings for each level.
Mid level is shown as a dashed line for quick visual distinction.
Labels & Price Tags
Optional letter labels (H / L / M / O) displayed near the extended levels.
Optional price labels showing the exact level values on the right side of the chart.
Labels update dynamically and only display for the active trading day.
Performance-Oriented Design
Efficient line and label management using arrays.
Automatically cleans up unused objects to stay within TradingView limits.
Use Cases
Identifying intraday support and resistance
Tracking daily range behavior
Monitoring mean reversion vs. range expansion
Aligning intraday execution with higher-timeframe structure
This indicator is particularly useful for traders who rely on market structure, session behavior, and objective price references rather than subjective trend lines.

Visible Range / POC / Volume / SNR Detector PROVisible Range POC & Volume SNR Detector PRO
Visible Range POC & Volume SNR Detector PRO is a professional-grade volume-based market structure tool designed to identify institutional Support & Resistance zones, Point of Control (POC), and Value Areas directly from the visible chart range.
This indicator goes beyond traditional swing highs and lows by analyzing real traded volume, revealing where large players are active, where price finds fair value, and where high-probability reactions are most likely to occur.
🔍 Core Features
📊 Visible Range Volume Profile
🔹Builds a full Volume Profile using only the visible chart range
🔹Splits price into configurable precision bins for maximum accuracy
🔹Detects true volume clusters instead of subjective price levels
🎯 Point of Control (POC)
🔹 Automatically identifies the highest-volume price level
🔹Acts as a magnet price where market participants agree on value
🔹Fully customizable line style, width, and color
🔹 Optional label with timeframe + price + volume (K / M / B)
📦 Value Area (VAH / VAL)
* Calculates Value Area High & Low around the POC
* Default **70% volume range** (institutional standard)
* Optional Value Area fill for clear fair-value visualization
* Helps distinguish **range conditions vs trending moves**
🧱 Volume-Based Support & Resistance Zones
🔹Automatically detects high-impact S&R zones from volume behavior
🔹Zones are visually classified by strength:
🔹 🟢 Strong
🔹 🟡 Medium
🔹 🔴 Weak
🔹Clean box rendering with customizable borders:
🔹 Solid / Dashed / Dotted
🔹 Zones extend dynamically into the future for planning trades
🔄 Dynamic Flip Logic (PRO Standard)
🔹 Advanced Dynamic Flip system:
🔹 Support ➜ Resistance after a breakdown
🔹Resistance ➜ Support after a breakout
🔹 Reflects real market structure shifts
🔹Eliminates outdated static levels
🔁 True Retest & Zone Intelligence
🔹Each zone includes detailed contextual data:
🔹🔄 True Retest Count (price leaves zone and comes back)
🔹⏳ Zone Age (minutes / hours / days)
🔹💪 Strength Classification
🔹🔁 Flip Status
🔹⏱️ Timeframe
🔹💲 Exact price level
🔹All information is displayed in a single clean label.
🔔 Smart Alerts System
🔹Never miss key interactions:
🔹🟢 Touch Alert — price enters a zone
🔹⬇️⬆️ Break Alert — zone failure or breakout
🔹🔄 Retest Alert — classic break & retest setup
Alerts trigger on confirmed bars to reduce noise and false signals.
📋 Professional Dashboard
🔹At-a-glance market overview:
🔹Total Support & Resistance zones
🔹🎯 POC level
🔹📦 VA High / VA Low
🔹💪 Strong / Medium / Weak zone distribution
🔹📍 Nearest Support & Resistance
🔹📏 Distance to key levels
🔹 🎨 Auto / Dark / Light theme support
🔹 📐 Adjustable size & position

Smart Money Concepts [Kodexius]Smart Money Concepts is a price action framework designed to integrate market structure, liquidity behavior, and inefficiencies into a single, readable view. Rather than acting as a signal generator, it serves as a live market map highlighting where price has displaced, where liquidity may be resting, which zones remain valid, and how that context updates as new candles print.
What separates this script from typical “SMC bundles” is not the presence of familiar concepts like swings, order blocks, FVGs or liquidity sweeps. The value is in the engine design and how the components are maintained together as a consistent state, with automatic pruning and prioritization so the chart stays usable over time. Many tools can draw boxes, but fewer tools manage the lifecycle of those zones, reduce overlap, rank relevance, and keep the display focused on what still matters near current price.
At the core is a structure model that tracks directional state and labels structural transitions as they happen. CHoCH and BoS are not just printed whenever price crosses a line. Each event is anchored to a swing reference and handled in a way that reduces repeated triggers from the same context, helping you see genuine transitions versus minor noise. This gives structure a “narrative” across time instead of a cluttered sequence of identical labels.
Order blocks are built from the most relevant candle within the post break window and displayed as true zones that extend forward while they remain valid. Beyond the zone itself, the script adds context that is usually missing in basic OB implementations: a volumetric pressure visualization and a displacement strength score that is normalized and ranked over a rolling window. In practice, this creates an information hierarchy. You can quickly see which zones carried more participation, whether the internal push was dominated by buying or selling pressure, and whether the move that created the zone had meaningful displacement relative to recent history. This is designed to help prioritization, not to claim prediction.
Imbalances are handled as a dedicated module with multiple detection modes (FVG, VI, OG, IFVG) and optional MTF logic so you can map inefficiencies from a higher timeframe while executing on a lower timeframe. Each imbalance is displayed as a zone with a midline reference, and mitigation behavior can be tuned (wick or close). IFVG adds lifecycle depth by tracking inversion behavior rather than simply deleting the zone, which can be useful for monitoring how price rebalances and flips inefficiencies over time. An optional sentiment style internal fill is available for visual context, but it is intentionally framed as informational rather than a “buy/sell meter.”
Liquidity is treated as an event driven layer. Pivot highs and lows are tracked as potential liquidity pools, then monitored for sweeps and rejection behavior. If you enable EQH/EQL logic, the script can label equal highs and lows during the sweep process to highlight common resting liquidity formations. A volume filter is available to reduce low quality levels, aiming to keep the liquidity map focused on swings that occurred with meaningful participation rather than every small fluctuation.
Swing Failure Patterns (SFP) are included as a separate confirmation style tool that focuses on rejection after liquidity is taken. The module supports optional volume validation using lower timeframe volume distribution outside the swing level, which helps filter some low quality SFPs on noisy instruments. The output is a cleaner set of events intended to complement structure, liquidity and zones, not replace discretionary decision making.
For higher timeframe context, the HTF candle projection panel can display a compact set of higher timeframe candles to the right of current price, with classic or Heikin Ashi style and configurable sizing, spacing and labels. This allows you to maintain HTF awareness without switching charts, which is especially helpful when structure and zones are being interpreted across multiple timeframes.
Finally, the alert framework is designed around well defined structural and zone states. Alerts cover structural shifts (CHoCH, BoS), liquidity sweeps, new and broken order blocks, breaker behavior (if enabled), new and approached imbalances, premium and discount entries, trendline events, and SFP detection. These alerts are intended as monitoring prompts so you can review context, not as automated trade execution signals.
Every major component is modular and configurable. You can run a minimal structure only layout or enable a full framework with zones, imbalances, liquidity, SFP and HTF projection. The guiding principle is chart clarity and relevance: keep the most important information visible, reduce overlap and stale objects, and maintain a consistent view of how price is interacting with liquidity and value over time.
🔹 Features
🔸 Market Structure Engine (CHoCH and BoS)
This script automatically tracks zigzag based market structure and differentiates between:
CHoCH (Change of Character) : the first meaningful structural shift that suggests the prior directional leg is weakening.
BoS (Break of Structure) : continuation breaks that confirm structure extension in the active direction.
Instead of relying on plain pivot dots, our market structure swings are built with a lightweight zigzag style engine that tracks direction and “locks in” the true leg extreme only when the leg flips. This produces cleaner, more consistent swing highs/lows for BOS/CHoCH than simple left/right pivot checks.
Bullish CHoCH:
Bearish CHoCH:
Bullish BoS:
Bearish BoS:
🔸 Order Blocks with Volumetric and Displacement Insight
The script identifies recent bullish and bearish order block zones around meaningful structural reactions and keeps the display focused on the most relevant areas. Instead of drawing a static rectangle and leaving it there forever, each zone is maintained as an active region on the chart and can be limited by a user defined visibility depth to avoid clutter. When enabled, the overlay also adds compact volume based context inside the block so you can quickly compare relative participation between recent zones and see whether the origin move showed strong follow through versus a softer transition. The intention is to provide structured context and cleaner prioritization on the chart, not to present a trade call or a guaranteed reaction level.
Bullish Order Block:
Bearish Order Block:
Order blocks are derived from the structure shifts, marking the institutional “origin zone” behind a decisive move and projecting it forward as a live area of interest. In practice, it highlights the candle cluster where price last rebalanced before expanding away, so you can track potential retests with context instead of guessing.
Inside each order block, the internal bars act as a compact strength meter green vs red summarizes the relative bullish vs bearish participation, while the blue segment reflects the “departure force” (displacement/momentum) away from the zone. It’s meant to help you scan which blocks left clean and strong versus those that moved out more slowly or with mixed pressure.
🔸 Breaker Blocks & Mitigation Tracking
Tracks when previously identified order blocks fail and converts them into breaker blocks, visually marking a change in how price is interacting with that zone.
Bullish Breaker Block :
Bearish Breaker Block :
Separate handling of bullish and bearish breakers with clear color differentiation.
Includes optional “mitigation” logic using either wick or close to determine when a block is considered broken or mitigated.
Breaker blocks are updated and removed dynamically as price trades through them, keeping the chart focused on current, active zones.
🔸 Imbalances
The imbalance module maps common price inefficiencies as zones, with support for multiple detection styles such as Fair Value Gaps, volume style imbalances, opening gaps, and an inverted gap mode. Each imbalance is drawn as a practical area on the chart with a midpoint reference, so you can quickly see where price may be revisiting unbalanced movement. You can also choose how mitigation is evaluated (wick or close) and optionally run imbalance detection on a separate timeframe for cleaner higher timeframe context while staying on your execution chart.
Fair Value Gaps:
Inverse Fair Value Gaps:
Opening Gaps:
🔸 Liquidity Sweeps, EQH/EQL, and Optional Volume Filter
Liquidity levels are derived from swing highs and lows and then monitored for sweep behavior, where price trades beyond a prior level and rejects back. If you enable EQH/EQL marking, the script can highlight equal highs and equal lows behavior around those liquidity areas to make common pool formations easier to spot. An optional volume filter can be used to reduce tracking of low participation swings, helping keep the liquidity layer focused and less noisy on instruments that produce frequent small pivots.
Sellside Liquidity Sweep Definition:
Buyside Liquidity Sweep Definition:
Highlights equal highs (EQH) and equal lows (EQL) when sweeps occur, marking where price probed above/below prior liquidity and then rejected.
Optional volume filter to ignore low volume swings and focus on more meaningful liquidity zones.
🔸 Premium, Discount, and Equilibrium
The premium and discount view provides a simple contextual map of where price is trading within a measured range, alongside an optional equilibrium line as a midpoint reference. This is intended as a higher level framing tool to help you avoid treating every price location the same, especially when combining structure with reaction zones. Price labels can be enabled for quick orientation, and the display updates as the underlying range evolves.
Projects premium and discount bands based on a dynamically measured range, offering a simple view of where price is trading relative to that range.
Draws separate Premium and Discount boxes with optional price labels for quick orientation.
Optional mid line (equilibrium) to visualize the “50%” of the current range, often used as a reference for balanced versus extended price.
Zones auto update as the underlying range evolves, with logic to prevent stale levels from cluttering the chart.
🔸 Trend Channels
When enabled, the trend module draws swing based diagonal structure using trendlines and a channel style visualization. You can tune sensitivity and choose whether the source should be depending on how you prefer to read trend behavior. The channel is maintained dynamically so you can keep directional context without manually drawing and constantly adjusting diagonal lines, and the script can highlight basic break behavior when price pushes beyond the active diagonal reference.
🔸 Swing Failure Pattern (SFP) Detector
The SFP module highlights common swing failure behavior, where price briefly trades beyond a swing level and then reclaims it, often reflecting a liquidity grab followed by rejection. Bullish and bearish SFPs can be enabled independently, and the display is designed to keep the key level and the rejection visible without excessive clutter. Optional volume validation can be used as a filter, so you can choose whether you want the detector to be more permissive or more selective based on participation characteristics.
🔸 HTF Candle Projection Panel
The HTF panel projects a compact set of higher timeframe candles to the right of price, giving you higher timeframe context without switching charts. You can select classic candles or Heikin Ashi style, adjust the scale and spacing, and optionally display reference lines and labels for OHLC values. This is a visual context tool intended to support multi timeframe reading, not a replacement for your own higher timeframe analysis.
In addition to projecting higher timeframe candles, the HTF panel can also detect and visualize higher timeframe liquidity sweeps directly within the projected candle set. The script monitors each completed HTF candle’s high and low and evaluates subsequent HTF candles for sweep behavior i.e., when price briefly trades beyond a prior HTF extreme but fails to hold acceptance beyond it (filtered using the later candle’s body positioning). When a sweep is detected, the panel draws a dotted sweep line and marks the event, allowing you to spot HTF stop runs and failed breaks without switching timeframes. Sweeps are dynamically invalidated if a later HTF candle shows genuine acceptance beyond that level, ensuring the display stays context relevant and avoids stale markings. This turns the HTF projection from a passive visualization into an actionable context layer for identifying HTF liquidity events while executing on lower timeframes.
🔸 Alerts
Alerts are included for the most practical events produced by the overlay, such as structure shifts (CHoCH and BoS), liquidity sweeps, new and invalidated zones, price approaching recent zones, imbalance creation and mitigation, premium or discount entries, trendline events, and SFP detections. The alerts are designed to function as a monitoring layer so you can be notified when something changes in your mapped context, rather than acting as standalone trade instructions.
🔸 Originality & Usefulness
This script is not a collection of separate SMC drawings layered on top of price. It is built as a unified price action engine where market structure, order blocks, inefficiencies, and liquidity are produced from the same evolving state. That matters because most SMC indicators treat these concepts as independent overlays, which often leads to contradictory markings and excessive clutter. Here, the design priority is consistency and readability: modules update in sync, older elements are managed, and the chart stays usable during live conditions.
A key differentiator is the internal swing logic, which functions like a compact zigzag style structure engine. Instead of reacting to every minor fluctuation, it aims to focus on meaningful swing decisions and treat structure as a sequence. This reduces repetitive labeling and makes structural transitions easier to follow. Structure events are anchored to the swing that defined them and are designed to trigger in a clean, non spammy way, which is critical for anyone who uses structure as a workflow backbone.
The structure layer is intentionally narrative oriented. It separates a transition event from continuation events, so CHoCH is used to highlight the first meaningful shift after an established leg, while BoS is used to mark follow through in the same direction. This is not a prediction claim. It is a clarity feature that helps users read “phase changes” versus “continuation” without constantly second guessing whether the script is just printing noise.
Order blocks are where this script becomes especially distinctive compared to typical SMC tools. Instead of drawing identical rectangles, each block is rendered with an internal gauge that communicates participation and directional dominance at a glance. The zone is visually segmented to reflect bullish and bearish pressure components, and it also carries a volume readout plus a relative weight compared to other recent blocks. This creates a ranked view of blocks rather than an unfiltered pile. In practice, you can prioritize zones faster because the script surfaces which blocks had more meaningful participation and whether the internal push looked one sided or mixed. The result is less subjective filtering and a cleaner chart.
Imbalances are handled as structured inefficiency zones with clear references and optional context. Beyond drawing the zone and midpoint, the script can overlay a sentiment style gauge that divides the imbalance into bullish and bearish portions and updates as new data comes in. The practical value is that you can see whether an inefficiency remains strongly one sided or is gradually being balanced. This turns imbalances from static boxes into a living context layer, which is particularly useful when you monitor reactions over time instead of treating every touch the same.
Liquidity is treated as an event driven tracking system rather than simple pivot plotting. Liquidity pools are identified from swing behavior and can be gated through a participation filter so the script focuses on levels that formed with meaningful activity rather than low quality noise. Once tracked, levels are monitored for outcomes like sweeps and equal high/low behavior, and then updated or retired when they are decisively resolved. This prevents the display from accumulating stale levels and keeps the liquidity layer focused on what is still relevant now.
Swing failure patterns are integrated as selective events rather than continuous spam. The intent is to produce fewer but more structurally meaningful SFPs, aligned with the liquidity narrative, instead of printing clusters around the same price area. This keeps the pattern readable and reinforces the “event based” design philosophy across the script.
Higher timeframe context is supported through a compact HTF projection panel that provides quick orientation without forcing constant timeframe switching. It lets you see where current price action sits inside a larger timeframe candle and range, which helps maintain consistency when you are executing on a lower timeframe but respecting higher timeframe structure.
Disclaimer: This indicator is for educational and analytical purposes only. It does not provide financial advice, and it does not guarantee results.
🔹 How to Use
This tool is designed to support multiple trading styles, but it is most effective when you treat it as a top down mapping and decision support tool. A practical workflow looks like this.
1) Establish higher timeframe bias and context
Start on your reference timeframe such as H4 or Daily and read the market’s dominant story first. Use the Market Structure Engine to identify whether the market is in continuation mode or transition mode. The goal is to avoid executing lower timeframe ideas that conflict with the larger structure narrative.
Use the HTF Candle Projection Panel as a fast orientation aid. It helps you judge whether current price is building acceptance near the highs of the larger candle, rotating back toward its open, or rejecting from its extremes. This is especially useful when you execute on lower timeframes but want to stay aligned with higher timeframe positioning.
Add Premium and Discount framing to understand location. When price is trading in premium, continuation longs are often more selective and require stronger confirmation, while shorts may have better location if structure supports it. When price is in discount, the opposite applies. Treat this as location context, not a rule.
2) Map your key reaction zones with prioritization
Next, build your map of where reactions are most likely to occur. Enable Order Blocks with Volumetric Insight to highlight the most relevant origin zones that form after important structure events. Keep your focus on the most recent blocks and adjust the visible depth so the chart stays clean.
Use the internal gauge and participation readouts to prioritize. Instead of treating every zone as equal, treat higher participation blocks as primary candidates and lower participation blocks as secondary. The bullish and bearish split inside the gauge helps you quickly judge whether the zone formed from a clearly one sided push or a more mixed move, which can inform how strict you want to be with confirmation on a retest.
If you use Breaker Blocks, treat them as role shift zones. They are especially useful when the market has clearly transitioned and you want to track where a previously defended origin area may become a meaningful retest level later.
3) Layer in inefficiencies only where they add clarity
If your workflow includes imbalances, add them selectively to avoid visual overload. Use Fair Value Gaps, Volume Imbalances, or Opening Gaps as secondary reaction areas that often sit inside, near, or between larger zones.
If you enable the internal sentiment gauge, read it as context rather than a signal. It is meant to help you see whether the imbalance remains one sided or has started to balance out as price develops. A strongly one sided presentation can support the idea of continuation through the zone, while a more balanced presentation can support the idea of deeper mitigation or chop. Use it to refine expectations, not to force entries.
4) Track liquidity as events, not as static levels
Enable Liquidity Sweeps and EQH/EQL tagging to highlight where resting liquidity is likely concentrated and when it gets taken. The main value here is narrative: you can see when price runs obvious highs or lows and whether it immediately rejects back into structure or accepts beyond the level.
If you use the volume filter, treat it as a quality gate. The point is to ignore small, low participation swings and keep the liquidity layer focused on levels that formed with meaningful activity. This tends to reduce noise and makes sweeps and equal level behavior more relevant.
Combine the liquidity layer with the Swing Failure Pattern detector to isolate moments where liquidity is taken and then rejected. The cleanest use is when SFPs occur at or near your pre mapped reaction zones, after a sweep, and in alignment with your higher timeframe bias.
5) Refine execution timing on your entry timeframe
Drop to your execution timeframe and use local structure shifts as timing tools. CHoCH and BoS on the lower timeframe can help you see when micro structure is flipping in your intended direction after price interacts with your mapped zone.
If you use the Trend Channel framework, treat it as diagonal context rather than strict support and resistance. A channel helps you see where price is riding the trend and where it is deviating. This can help you time entries by waiting for price to re enter the corridor, show rejection near a boundary, or confirm a shift by building structure outside the channel.
A common practical sequence is: price reaches a mapped OB or imbalance area, liquidity gets taken, price rejects, micro structure begins to flip, and then you execute with your own confirmation and risk rules. The tool helps you see each step clearly, but your plan determines what is sufficient confirmation.
6) Use alerts as monitoring, not as standalone signals
Set alerts only for events that are meaningful to your workflow, such as:
-fresh CHoCH or BoS in your preferred direction
-new or invalidated order blocks and breaker blocks
-price approaching the most recent priority zones
-liquidity sweeps and EQH/EQL interactions
-new SFP events
-entry into premium or discount and interaction with HTF projection levels
-imbalance creation, mitigation, or approach
Treat alerts as prompts to check the chart, not as automatic entries or exits. This script is designed as a mapping and decision support tool. Trade execution, confirmation, and risk management remain entirely dependent on your own strategy and discretion.
🔴 Price Action Practical Notes
💠 Market structure
Market structure is the framework used to describe how price organizes itself into swings. It is built from successive swing highs and swing lows, and it is used to decide whether the market is expanding upward, expanding downward, or transitioning. A practical structure model focuses on “meaningful” turning points rather than every minor fluctuation, because the goal is to capture intent and flow, not noise.
💠 Swing highs and swing lows
A swing high is a local peak where price stops advancing and begins to rotate lower, while a swing low is a local trough where selling pressure pauses and price rotates higher. Swings matter because many traders anchor risk, liquidity, and entries around them. The stronger the reaction away from a swing, the more likely it is to be referenced again as a decision point.
💠 Break of structure
A break of structure is the event where price decisively exceeds a prior swing in the direction of the prevailing move. In practice, it is used as confirmation that a directional leg is still active and that liquidity resting beyond the swing has been taken. This concept is less about predicting and more about validating continuation.
💠 Change of character
A change of character is a structural break that signals transition rather than continuation. Instead of breaking a swing in the same direction as the recent trend, price breaks a key swing in the opposite direction, suggesting that control may be shifting. It is often treated as an early warning that the market may be moving from continuation into reversal or deeper pullback conditions.
💠 Order blocks
An order block is commonly described as the last opposing candle or consolidation zone that precedes a strong directional expansion. The idea is that this area represents a footprint of aggressive execution and unfilled interest. When price revisits it later, it can act as a reaction zone because participants who missed the move may defend it, or because remaining orders may still exist there.
💠 Mitigation and invalidation of a zone
Mitigation describes the process of price returning to a zone and “consuming” the remaining interest there. A zone is typically considered invalidated when price trades through it in a way that implies the resting orders were absorbed and the area no longer has protective value. Some approaches treat a wick through the boundary as enough to invalidate, while others require a candle close beyond the boundary to confirm that the level has truly failed.
💠 Breaker blocks
A breaker block is an order block concept that changes role after being invalidated. When a previously respected zone fails, it can later become a reaction area in the opposite direction because trapped participants may use the retest to exit, or because the market may recognize it as a new supply or demand reference. Breakers are often treated as “failed zones that become liquidity magnets” and are closely watched on retests.
💠 Liquidity and liquidity pools
Liquidity is the availability of resting orders that allow large transactions to execute with minimal slippage. In chart terms, liquidity pools often form around obvious swing highs and lows, equal highs and lows, and clear ranges. These areas attract price because they contain clustered stops and entries that can be used to fuel continuation or trigger reversals through rapid order flow shifts.
💠 Liquidity sweeps
A liquidity sweep is a move where price briefly trades beyond a known liquidity pool and then returns back inside, often closing back within the prior range. The concept implies that stops were triggered and liquidity was captured, but that continuation beyond the swept level did not sustain. Sweeps are frequently used as context for reversals or for confirming that a “cleanout” occurred before a directional move.
💠 Equal highs and equal lows
Equal highs and equal lows describe repeated swing levels that form a flat or nearly flat top or bottom. They matter because they concentrate liquidity. Many traders place stops just beyond these repeated levels, and many breakout traders place entries around them. The result is a dense cluster of orders that can be targeted efficiently by price.
💠Imbalances and inefficiencies
Imbalances represent zones where price moved so quickly that it left behind inefficient trading, meaning fewer transactions occurred in that region compared to surrounding areas. The underlying idea is that markets often revisit these areas to rebalance, fill gaps, or complete unfinished business. Imbalances are treated as areas of interest for pullback entries, targets, or reaction zones.
💠 Fair value gap
A fair value gap is a specific form of imbalance commonly framed as a three candle displacement that leaves a gap between candles, indicating rapid repricing. Traders use it as a proxy for inefficiency: if price returns, it may partially or fully fill the gap before continuing. The midpoint of the gap is often treated as a particularly relevant reference, but whether price respects it depends on context.
💠 Inverted fair value gap
An inverted fair value gap is the idea that once an imbalance is “broken” in a meaningful way, the zone can flip its behavior. Instead of acting like a supportive zone, it may become resistive (or vice versa) on a later retest. Conceptually, this is similar to role reversal: what once behaved as a continuation aid can become a rejection zone after failure.
💠 Premium, discount, and equilibrium
Premium and discount describe where price sits relative to a defined recent range. Premium is the upper portion of that range and discount is the lower portion. Equilibrium is the midpoint. The concept is mainly used to align trade direction with location: buying is generally more attractive in discount and selling is generally more attractive in premium, assuming you are trading mean reversion within a range or seeking favorable risk placement within a broader trend.
💠 Swing failure pattern
A swing failure pattern is a reversal archetype where price breaks a known swing level, fails to hold beyond it, and returns back through the level. The logic is that the breakout attempt attracted orders and triggered stops, but the market rejected the extension. SFPs are often considered higher quality when the failure is followed by a decisive move away and when it aligns with a broader liquidity narrative.
💠 Higher timeframe context
Higher timeframe context means framing intraday or lower timeframe signals within the structure of a larger timeframe. This can include aligning trades with higher timeframe swings, using higher timeframe candles as reference for open/high/low behavior, and avoiding taking counter trend signals when the larger timeframe is strongly directional. The purpose is to improve signal quality by ensuring the smaller timeframe idea is not fighting a dominant larger flow.
💠 Trend channels
A trend channel is a structured way to visualize a market’s directional “lane” by framing price between two roughly parallel boundaries. The central idea is that trending price action often oscillates in a repeatable corridor: pullbacks tend to stall around one side of the lane, while impulses tend to extend toward the opposite side. Instead of treating trend as a single line, a channel treats trend as an area, which better reflects real market behavior where reactions occur in zones rather than at perfect prices.
A channel typically has three functional references: a guiding line that represents the prevailing slope, an upper boundary that approximates where bullish expansions tend to stretch before mean reversion, and a lower boundary that approximates where bearish pullbacks tend to terminate before continuation. The space between boundaries represents the market’s accepted path. When price stays inside this corridor, the trend is considered healthy. When price repeatedly fails to progress within it, the trend is weakening.
Channels are commonly used for timing and location. In an uptrend channel, pullbacks into the lower portion of the corridor are often treated as higher quality “location” for continuation attempts, while pushes into the upper portion are treated as extension territory where risk of a pause or retracement increases. In a downtrend channel, the logic is mirrored: rallies into the upper portion are often treated as sell side location, and moves into the lower portion are treated as extension territory. The channel does not predict direction by itself; it provides a disciplined map for where continuation is more likely versus where momentum is more likely to cool.
A key concept is acceptance versus deviation. If price briefly pierces a boundary and snaps back inside, that is often interpreted as a deviation, meaning the market tested outside the lane but did not accept it. If price holds outside the corridor and begins to build new swings there, that suggests acceptance and a potential regime change: either a new channel with a different slope, a shift into range, or a broader reversal context. This is why channels are most useful when you treat them as a framework for evaluating behavior, not as rigid support and resistance.

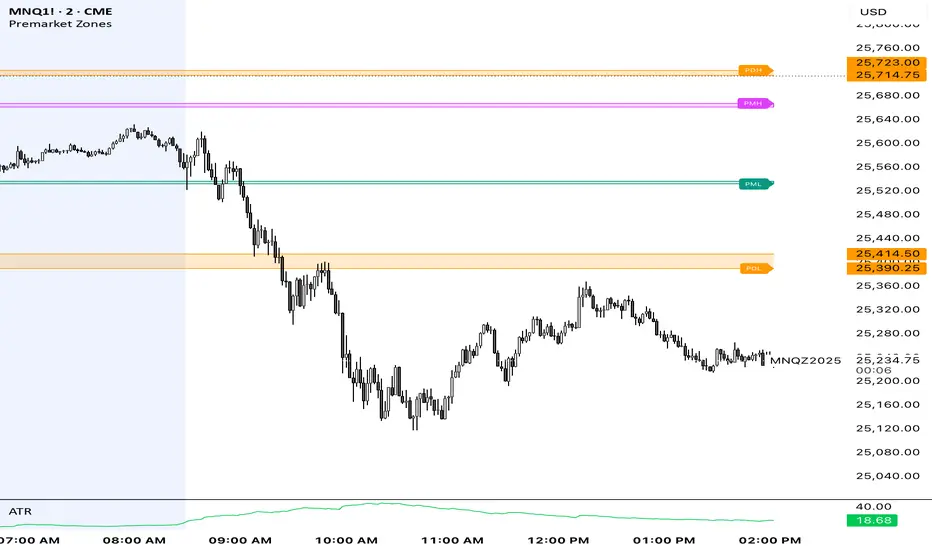
Premarket ZonesThis indicator is built for index futures traders (ES, NQ, RTY, YM) who trade liquidity, session structure, and high-probability reaction levels using true CME futures timing.
It automatically plots:
Premarket High & Low zones (wick + body)
Previous Day Futures RTH High & Low zones (PDH / PDL)
Clean right-edge labels
First-touch alerts (once per day)
All calculations are based on Central Time (CT) and CME futures sessions, not equity cash-market hours.
🕒 Session Definitions (CME / Central Time)
Session Time (CT) Purpose
Premarket 03:00 – 08:30 Overnight liquidity build
Futures RTH (Calc) 08:30 – 15:00 True CME regular trading hours
Plot Window 03:00 – 16:00 Visual extension of zones
This script intentionally uses 08:30 CT as the futures open — not 09:30 equity cash open.
🔷 Premarket Zones (PMH / PML)
The indicator builds two premarket zones using multi-timeframe precision.
How they are calculated:
1-minute candles → capture the true wick extremes
5-minute candles → capture the dominant body area
Zones:
Premarket High Zone (PMH)
Between the highest 5-minute candle body and the highest 1-minute wick
Premarket Low Zone (PML)
Between the lowest 1-minute wick and the lowest 5-minute candle body
Key behavior:
Zones finalize at 08:30 CT
Once finalized, zones are drawn as boxes that extend left to 03:00 CT
Zones extend forward through the trading day for context
PMH / PML labels are plotted on the right edge
These zones represent overnight liquidity pools commonly used for:
Opening drive continuation
Liquidity sweeps
Mean reversion
Acceptance vs rejection at the open
🔶 Previous Day High / Low (PDH / PDL)
This script plots TRUE futures PDH / PDL, not equity-based levels.
How they are calculated:
Uses only the prior day’s futures RTH (08:30–15:00 CT)
1-minute candles → wick extremes
5-minute candles → body value areas
Zones:
PDH Zone: 5m body → 1m wick
PDL Zone: 1m wick → 5m body
These levels represent:
Institutional reference points
Prior session balance extremes
High-probability reaction zones
Clean PDH / PDL labels are plotted on the right edge.
🔔 Alerts (Once Per Day)
The indicator includes first-touch alerts for:
PDH
PDL
Premarket High Zone
Premarket Low Zone
Each alert triggers only once per session, making it ideal for:
Trade planning
Discipline-based execution
Prop firm risk control
📈 How Traders Use This Script
This indicator is context-based, not predictive.
Common use cases:
Waiting for liquidity sweeps into PMH / PML
Trading rejection or acceptance at PDH / PDL
Combining with:
VWAP
Opening Range
Market structure
Volume or delta tools
It works especially well on:
Opening range days
Mean-reversion conditions
Trend continuation days after overnight imbalance
🎯 Design Philosophy
Futures-first logic
No clutter
No repainting
No equity-market assumptions
Levels professionals actually use
This script is designed to mirror how professional futures traders map their charts.
⚠️ Notes
Best used on 1m or 5m charts
Designed for CME index futures
Not a standalone trading system
Always manage risk
AlgoZ Pro v2.4.3 [LITE] - Adaptive Trend SystemOverview
AlgoZ Pro v2.4.3 is a high-precision trend-following system designed to filter market noise and keep you on the right side of the trend. Built on an advanced ATR-adaptive engine, this indicator dynamically adjusts its sensitivity to market volatility, providing clear entries and trailing stop-loss levels for Scalpers and Day Traders.
How It Works
The system uses a volatility-based "Trailing Cloud" to identify the dominant trend.
Green Cloud: Bullish Trend (Look for Longs)
Red Cloud: Bearish Trend (Look for Shorts)
Labels:
Clear BUY/SELL text labels appear when the trend flips, confirmed by volatility expansion.
Lite Features (Included)
Adaptive Trend Cloud: Visualizes the trend direction instantly.
Smart Trailing Stops: The trend line acts as a dynamic stop-loss level.
Signal Labels: Clean Buy/Sell markers on chart.
Multi-Timeframe Logic: Optimized for 5m, 15m, and 4H timeframes.
UNLOCK THE FULL SUITE (PRO v2.4.3)
This script is the "Lite" version of the complete AlgoZ Pro system. By upgrading to the full source code version, you unlock the institutional toolkit used by professional traders:
1. 🏦 Smart Money Range (SMR) Zones Automatically draws institutional Support & Resistance zones based on Donchian liquidity levels. Stop guessing where price will bounce.
2. 📊 Volume Divergence System Detects hidden reversals before they happen by analyzing volume/price disagreements.
3. 🛡️ "Strict Mode" Filters Includes our proprietary "Anti-Spam" filter that uses MFI, RSI, and Candle Color logic to eliminate false signals during choppy markets.
4. 📈 Built-in Backtester See the real-time Win Rate, Profit Factor, and Drawdown directly on your chart. Know the math before you trade.
5. 💎 100% Source Code Ownership Get the complete Pine Script code. Modify the logic, build your own bot, and own the system forever with no monthly fees.
👉 Get the PRO Source Code & SMR Zones here: www.algozpro.com

Great Pyramid Harmonic Core Geometry V1 [QTI]Short Summary
Unlocking Ancient Market Geometry: This indicator maps critical support and resistance levels using the immutable geometric constants of the Great Pyramid of Giza, anchored to the Previous Day's High and Low (PDH/PDL).
Key Concepts & Philosophy:
This is not a standard Fibonacci tool. The Great Pyramid Harmonic Core Geometry system establishes a fixed, non-repainting structure based on the previous day’s range (PDL to PDH) and projects highly reliable levels derived from sacred geometry and ancient architecture.
The premise is that the forces driving market liquidity and price movement follow the same universal constants found in geometric perfection. We use these precise ratios—not arbitrary percentages—to define zones of high probability reversal and continuation.
The Harmonic Core (0.0 to 1.0):-
The range between the PDL (0%) and PDH (100%) is the trading day's energy core. Critical retracement levels within this core are projected using the following constants:
EQ (50%): The perfect geometric mean.
Kepler (61.8%) & Pi Inverse (31.8%): Classic Golden Mean and Pi-related support/resistance.
Isis (70.7%) & Osiris (29.3%): Derived from the square root of two ($\sqrt{2}$), relating to the cross-sectional area of the pyramid.
Horus (79.4%): A crucial level derived from the cube root of 0.5 ($\sqrt {0.5}$), often representing the center of volume mass or "Eye of Horus" apex.
KC Floor (25%): The King's Chamber floor height.
Thuban (57.7%): Derived from the space diagonal of a cube ($1/\sqrt{3}$).
The External Expansions (Beyond 1.0):-
These expansion targets are designed to predict extreme liquidity sweeps and continuation targets outside the core range:
Seqed Trap: 1.272, Pyramid Slope Tangent, A high-probability liquidity grab zone.
Isis Ext: 1.414, $\sqrt{2}$ Expansion, Standard diagonal extension target.
Phi Ext: 1.618, $\Phi$ (Golden Mean), Major expansion and trend exhaustion target.
Theban Ext: 1.732, $\sqrt{3}$ Expansion, The "Space Diagonal" of the liquidity cube.
Phi Squared: 2.618, $\Phi^2$, The second golden expansion, for high-level targets.
Pi Approx: 3.14, $\approx \pi$, The terminal geometric boundary and ultimate target ceiling.
Features & Customization:
1 - Dual Visualization Modes (Highly Recommended):
- Historical Trails: Shows light plots across the entire chart history for robust backtesting.
- Today's Structure (Recommended for Live Trading): Renders high-precision line and box objects that only persist for the current trading day, keeping the chart clean and focused on actionable levels.
2 - Full Customization: You can adjust the width, color, and visibility for every single level, line, box, and label across the Core, Apex, Base, and External Zones.
3 - Comprehensive Alerts: Includes 13 dedicated structural alerts for all major events:
- Breakouts/Breakdowns of PDH, PDL, and EQ.
- Entering/Exiting the Apex (Short) and Base (Long) structural zones.
- Hitting the high-level Phi Squared (2.618) and Pi Approx (3.14) extreme targets.
Usage Notes (Strategic Realism)
- Best Used On: Intraday timeframes (1m, 5m, 15m) for surgical entries and exits.
- Anchor: Levels are fixed until the start of the next daily session, providing reliable, non-repainting structure for the entire day.
- Overlay: Set overlay = true to display levels directly on your price candles.

Range Breaker [MOT]Range Breaker - Volatility Compression System
Range Breaker is a technical analysis tool designed to identify periods of market consolidation (volatility compression) and generate signals when the market transitions into an expansion phase (breakout). Unlike static box tools that require manual drawing, this script uses an adaptive, volatility-based algorithm to automatically detect, draw, and monitor trading ranges in real-time. It adapts to changing market conditions by comparing recent price action against the asset's Average True Range (ATR).
METHODOLOGY & CORE CONCEPTS
1. Volatility Compression Detection
The script's primary engine is a "Tightness Filter." It continuously measures the distance between the highest high and lowest low over a lookback period.
The Logic: It compares this raw range size against the ATR multiplied by a specific threshold. If the current range is significantly smaller than the historical average volatility, the script identifies this as a "Consolidation" event and begins constructing a box.
Adaptive Thresholds: This method ensures the indicator works across all assets (Crypto, Forex, Stocks) because the definition of "tight" is relative to the asset's own volatility, not a fixed price distance.
2. Dynamic Range Expansion
Originality lies in how the script manages an active range. A consolidation phase is not static; it breathes.
The Mechanism: If price pushes the boundary of the box but remains within the consolidation logic (does not close outside with momentum), the box dynamically expands to include the new data. This prevents premature signals and accurately captures the full "churn" of the accumulation/distribution phase.
3. Signal Generation Models
The script offers two distinct ways to trade the detected ranges:
Momentum Breakouts: A signal is triggered when a candle closes decisively outside the box boundaries (plus a buffer).
Wick Reversals (Mean Reversion): The script identifies "False Breakouts" where price probes outside the range but fails to close there (leaving a long wick). If confirmed by the subsequent candle, this signals a potential reversal back to the midline.
A chart showing a highlighted consolidation box with a "Vol Break" signal triggering on the breakout.
Visualizing volatility compression followed by a confirmed momentum breakout.
A chart showing a "Wick Reversal" signal where price poked out of the box but failed to close, indicating a trap/reversal back into the range.
False Breakout Detection: The script identifies liquidity traps at the range edges.
FEATURES & SETTINGS
Preset Profiles
To make the tool instantly usable for different styles, we have included tuned preset profiles that adjust the ATR multipliers and lookback periods automatically:
Tight Ranges: For scalping on lower timeframes.
Normal Ranges: Balanced settings suitable for most intraday and short-term swing trading strategies (Default).
Swing Trading: Looser parameters for capturing multi-day consolidations.
Options Selling: Optimized to find long, sideways chop ideal for theta strategies.
The settings menu showing the "Preset" dropdown selected.
Built-in profiles allow for quick adaptation to different market environments.
Volume Confirmation
The Volume Filter: Users can enable a "Volume Spike" requirement. This checks if the breakout candle's volume is significantly higher than the average volume (e.g., > 1.7x), helping to filter out "fakeouts" that lack institutional participation.
Visual Customization
Full control over Box colors, borders, and midlines.
Toggle signals for "Wick Reversals" and standard "Breakouts" independently.
HOW TO USE & BEST PRACTICES
The Squeeze: Use this tool to identify "the calm before the storm." Long periods of consolidation (large boxes) often lead to more explosive moves.
Breakout & Retest Strategy: While the script signals the initial breakout, conservative traders often wait for price to pull back and "retest" the range extreme (Box Top/Bottom) or the Midline as support/resistance. Entering on this confirmation often provides a better risk-to-reward ratio.
Risk Management: Stop losses can be strategically placed based on your style. Aggressive traders might place stops below the entry candle, while conservative traders often place them below the opposite side of the range box to allow for volatility.
Filtering Fakeouts: We highly recommend enabling the "Confirm with Volume Spike" option in the settings. Breakouts accompanied by low volume often fail and return to the range.
Reversals: In choppy sideways markets, use the "Wick Reversal" signals to trade from the edges back toward the midline (Mean Reversion).
ALERTS
The script includes the following alert conditions:
Range Detected: Triggered when a new consolidation phase begins.
Range Breakout: Triggered when price closes outside the box.
Breakout with Volume Confirmation: Triggered only when a breakout is accompanied by a significant volume spike, allowing for filtered automated entries.
Range Reversal: Triggered on confirmed Wick Reversal setups.
⚠️ DISCLAIMER
This script is for educational and analytical purposes only. It does not constitute financial advice. Trading involves significant risk. Past performance of the logic described is not indicative of future results.

NeoChartLabs POCOne of our Favorite Indicators - the High Time Frame Point of Control with a Volume Profile.
Shout out to p2pasta for the original script, we updated to v6.
Currently included: Monthly, 3 months and 6 months.
/* DEFINITION */
Point Of Control (= POC) is a price level at which the heaviest volumes were traded.
Value Area High/Low (=VAH/VAL) is a range of prices where the majority of trading volume took place. Naturally, Value Area High being the top price level and Value Area Low being the lowest. POC always is between the two.
/* HOW TO TRADE WITH THIS INDICATOR */
The basis for POC is determining bias on whichever timeframe you choose.
1. Identify a POC on the timeframe of your choosing.
/* If you choose a "low" timeframe (monthly here) then make sure to look at the higher timeframes to see how it is playing against a higher timeframe POC.
2. When the price is moving away from the POC (either to the upside or downside) this will confirm or invalidate the trade.
3. You can now enter the trade on bias or wait for a retest of the same POC.

Quantifiable Broadening Formations [STAT TRADING]Broadening Formations v4
━━━━━━━━━━━━━━━━━━━━━━━━━━━━━━━━━━━━━━━━━━━━━━━━━━━━━━━━━━━━━━━━━━━━━━━━━━━━━━━
OVERVIEW
Automatically identifies and draws Broadening Formations — expanding price structures that reveal where the market is auctioning both higher and lower to find fair value.
This indicator uses a quantifiable, rule-based approach to detect expansion patterns and dynamically tracks the evolution of price ranges in real-time. No subjective drawing required — the indicator handles everything automatically.
━━━━━━━━━━━━━━━━━━━━━━━━━━━━━━━━━━━━━━━━━━━━━━━━━━━━━━━━━━━━━━━━━━━━━━━━━━━━━━━
FEATURES
▸ Bar Classification System
Each bar is labeled based on its relationship to the previous bar:
1 = Inside Bar — Range contraction, price stayed within prior bar
2u = Trending Up — Higher high AND higher low
2d = Trending Down — Lower high AND lower low
3 = Outside Bar — Expansion, higher high AND lower low in single bar
C3 = Composite 3 — Multi-bar expansion pattern (2d→2u or 2u→2d completing the range)
Color coding helps identify conviction:
• Green = Bullish structure with bullish close
• Red = Bearish structure with bearish close
• Orange = Conflicted (structure and close disagree)
• Yellow = Outside Bar (3)
• Purple = Composite 3 (C3)
▸ Automatic Formation Detection
The indicator detects when price proves it can take both sides of a range, then:
• Draws dynamic upper and lower boundary lines
• Extends lines forward as projected support/resistance
• Updates the formation in real-time as price makes new highs or lows
• Detects breakouts when price closes through boundaries with conviction
▸ Support/Resistance Test Dots
Visual markers show when price tests the formation boundaries:
• Red dot at high = Price wicked into upper resistance but closed below (failed test)
• Green dot at low = Price wicked into lower support but closed above (held support)
These dots help you see where the market is probing the boundaries before a decisive move.
▸ Breakout & Reclaim Detection
Clear labels mark key events:
• BREAKOUT ↑ = Close above upper boundary (bullish break)
• BREAKOUT ↓ = Close below lower boundary (bearish break)
• RECLAIM ↑ = Failed breakdown, price recovered back into range
• RECLAIM ↓ = Failed breakout, price fell back into range
Reclaims are powerful signals — failed breakouts often lead to strong moves in the opposite direction. The formation automatically expands to include the failed move.
▸ Sub-Formations (Internal Triangles)
White lines show nested formations within larger structures. These internal patterns can provide earlier signals before the major formation resolves.
Sub-formations only appear when they are truly internal to the parent (not touching parent boundaries).
▸ Formation Labels
Each formation is labeled at its trigger point:
• 3 = Triggered by outside bar
• C3 = Triggered by composite pattern
• R1, R2... = Number of reclaims (e.g., "3 R2" = outside bar trigger with 2 reclaims)
━━━━━━━━━━━━━━━━━━━━━━━━━━━━━━━━━━━━━━━━━━━━━━━━━━━━━━━━━━━━━━━━━━━━━━━━━━━━━━━
SETTINGS
Show Bar Classification Labels Display 1/2u/2d/3/C3 below each bar
Detect Composite 3s Identify multi-bar expansion patterns
Show Sub/Internal Formations Display nested formations in white
Show Support/Resistance Test Dots Mark boundary tests with colored dots
Show Breakout/Reclaim Labels Label breakouts and reclaims
Major BF Line Color Color for primary formation lines
Sub BF Line Color Color for nested formation lines
Line Width Thickness of formation lines
Bars to Project Forward How far to extend lines into the future
━━━━━━━━━━━━━━━━━━━━━━━━━━━━━━━━━━━━━━━━━━━━━━━━━━━━━━━━━━━━━━━━━━━━━━━━━━━━━━━
ALERTS
Set alerts for key events:
• Outside Bar (3) — Single-bar expansion detected
• Composite 3 (C3) — Multi-bar expansion pattern detected
• New BF Started — New broadening formation triggered
• BF Break — Price closed through formation boundary
• BF Reclaim — Failed breakout, formation continues with expanded range
━━━━━━━━━━━━━━━━━━━━━━━━━━━━━━━━━━━━━━━━━━━━━━━━━━━━━━━━━━━━━━━━━━━━━━━━━━━━━━━
HOW TO USE
Understand your position:
Are you near the upper boundary, lower boundary, or mid-range? Context matters.
Watch for closes, not wicks:
Wicks test levels. Closes show conviction. The indicator only triggers breakouts on closes through the boundary.
Pay attention to reclaims:
A break that fails and reclaims often leads to an aggressive move the other direction. The "R" count on the label shows how many times this has happened.
Use test dots for entries:
Multiple red dots at resistance followed by a green bar = potential short setup. Multiple green dots at support followed by a red bar = potential long setup.
Sub-formations give early signals:
When an internal triangle breaks, it can front-run the larger formation's move.
━━━━━━━━━━━━━━━━━━━━━━━━━━━━━━━━━━━━━━━━━━━━━━━━━━━━━━━━━━━━━━━━━━━━━━━━━━━━━━━
NOTES
• Works on all timeframes and instruments
• Lines update dynamically as new bars form
• Historical formations are preserved on the chart
• Composite 3s (C3) are shown in purple to distinguish from single-bar triggers
• Best used to understand current market structure — combine with your existing strategy for entries
━━━━━━━━━━━━━━━━━━━━━━━━━━━━━━━━━━━━━━━━━━━━━━━━━━━━━━━━━━━━━━━━━━━━━━━━━━━━━━━
Objective structure. No guesswork.
p.s This is a public version in a different language than our true BF identification algorithm. There will be some bugs and it is unlikely we will fix it in the near future.

Footprint Imbalance Reversal ZonesThe script detects blowouts and displays buy and sell volume as levels.
Green lines = bullish zones (potential support / buying pressure)
Red lines = bearish zones (potential resistance / selling pressure)
---------------
Trade ideas:
---------------
Price approaching a green zone → potential bounce/support.
Price approaching a red zone → potential rejection/resistance.
Combine with other indicators or price action for confirmation.
-----------------
Configuration
-----------------
Inputs:
Imbalance Threshold (%) → higher = only very strong imbalances trigger zones
Bars to form cluster → number of consecutive imbalance bars needed
Zone Extend Bars → how far each zone line extends into the future
Minimum bar volume → ignore low-volume bars for cleaner zones
Use tick-rule volume estimate → leave true if no real bid/ask data
Max saved zones → max number of zones stored (oldest removed if exceeded)
------
Tips
------
Best used on intraday or short-term charts where volume imbalances are meaningful.
Adjust Minimum bar volume to filter out low-volume noise.
Combine with candlestick patterns, RSI, or moving averages for higher-probability trades.
For long-term charts, consider increasing Bars to form cluster to capture stronger levels.
Combine with price action, candlestick patterns, or other indicators for better trade signals.

Open Range BreakoutOpen Range Breakout (ORB)
The Open Range Breakout (ORB) is a classic intraday strategy used across stocks, indices, FX and futures. It focuses on how price behaves during the first minutes of a major session, when liquidity and volatility are highest.
This indicator fully automates the ORB process with session detection, box drawing, breakout & retest logic, and final Buy/Sell signals.
Multi-Session Support
Choose between the three most important global opens:
Asia (Tokyo) – JPY pairs, Asian indices, gold, crypto
London – FX majors, European indices, strong volatility
New York – US indices, USD pairs, gold, oil, highest volume
The Opening Range is calculated only during the selected session.
ORB Range (5 / 15 / 30 min)
The indicator builds the ORB High/Low from the first X minutes of the session, draws the box, and waits for price action once the range is complete.
How It Works
ORB Window → High/Low of the opening minutes are recorded.
Breakout → Price closes above/below the ORB → “BREAKOUT” label.
Retest → Price returns to the ORB box → “RETEST” label.
Confirmation Levels Freeze → Upper/lower structure set.
Final Signal
Close above frozen upper level → BUY
Close below frozen lower level → SELL
This filters out false breakouts and provides structured continuation signals.
Alerts
Includes built-in alert conditions for:
ORB BUY Signal
ORB SELL Signal
Alerts trigger exactly when the Buy or Sell label appears.
Works On
Stocks & indices
Forex
Futures

Market Structure Pivots with BOS & CHoCH [zazenio]What is Market Structure?
Market structure is simply the pattern of highs and lows that price creates as it moves. When you look at any chart, you'll notice price doesn't move in a straight line — it swings up, pulls back, swings up again (in an uptrend), or the opposite in a downtrend.
These swing points — the peaks and valleys — are what traders call pivots . Identifying them correctly is the foundation of understanding where a market has been and where it might go next.
What This Indicator Does
Swing Pivots automatically marks these peaks and valleys on your chart so you don't have to draw them manually. It works on any market — stocks, crypto, forex, futures, indices — and on any timeframe.
Beyond just marking pivots, this indicator also draws BOS (Break of Structure) and CHoCH (Change of Character) lines — two essential concepts that help you understand when a trend is continuing or potentially reversing.
How Pivots Are Detected
This indicator confirms pivots based on price structure, not a fixed bar count.
Here's how it works:
A swing high is confirmed when price breaks below the previous swing low. At that moment, we know the high was real — price tried to go higher, failed, and reversed. The market "proved" that level was a genuine turning point.
A swing low is confirmed when price breaks above the previous swing high. The same logic applies — price tried to go lower, failed, and reversed direction.
This creates a natural alternation: high, low, high, low. Each pivot is validated by the market's actual behavior, not by waiting for an arbitrary number of bars to pass.
Understanding BOS and CHoCH
Once you can identify pivots, the next step is understanding what happens when price breaks through them. This is where BOS and CHoCH come in.
BOS (Break of Structure)
A Break of Structure occurs when price continues in the direction of the current trend by breaking a previous pivot level.
In an uptrend : Price breaks above a previous swing high → This signals strength. Buyers are pushing price to new highs, and the trend is likely to continue.
In a downtrend : Price breaks below a previous swing low → This signals weakness. Sellers are pushing price to new lows, and the trend is likely to continue.
Think of BOS as the market saying "the trend is still intact." Each BOS confirms that the dominant side (buyers or sellers) remains in control.
CHoCH (Change of Character)
A Change of Character occurs when price breaks a pivot level in the opposite direction of the current trend. This is an early warning signal that the trend may be reversing.
In an uptrend : Price breaks below a previous swing low → This is unexpected. In a healthy uptrend, lows should hold. When they don't, it suggests buyers are losing control and sellers may be taking over.
In a downtrend : Price breaks above a previous swing high → This is unexpected. In a healthy downtrend, highs should hold. When they don't, it suggests sellers are losing control and buyers may be stepping in.
Think of CHoCH as the market's behavior "changing character" — it's no longer acting the way it should if the trend were healthy.
Why BOS and CHoCH Matter
These concepts give you a framework for reading what the market is actually doing:
BOS tells you the trend is continuing — stay with it or look for entries in that direction
CHoCH warns you the trend may be ending — time to be cautious, take profits, or look for trades in the new direction
By visualizing these breaks directly on your chart, you don't have to guess. You can see at a glance whether the market is trending smoothly (consecutive BOS) or showing signs of reversal (CHoCH).
Why This Approach Works
Most pivot indicators use a "lookback" method — they wait for a certain number of bars (say, 5 or 10) on each side of a candle before confirming it as a pivot. This creates a fixed delay. By the time the pivot appears on your chart, price has already moved on.
This indicator doesn't wait. It confirms pivots the moment price structure proves them. The result is pivots that align with how traders actually read charts — based on breaks of structure, not arbitrary countdowns.
Settings
Configuration
Swing Width : Controls how sensitive the detection is. Higher numbers show only major swings; lower numbers capture smaller moves within the structure.
Pivot Settings
High/Low Color : Customize the colors of swing high and swing low markers
Style : Choose between Triangle or Circle markers
Size : Adjust the size of pivot markers (Auto, Tiny, Small, Normal)
Structure Lines
Show CHoCH : Toggle Change of Character lines on/off
CHoCH Color : Customize the color of CHoCH lines
CHoCH Label : Show/hide the "CHoCH" text label
Show BOS : Toggle Break of Structure lines on/off
BOS Color : Customize the color of BOS lines
BOS Label : Show/hide the "BOS" text label
Use Cases
See the "skeleton" of price action at a glance
Identify potential support and resistance levels
Understand if the market is trending or ranging
Spot trend continuations with BOS lines
Catch early reversal signals with CHoCH lines
Build a foundation for more advanced trading strategies
━━━━━━━━━━━━━━━━━━━━━━
Version History
v1.1
Added BOS (Break of Structure) lines to visualize trend continuation
Added CHoCH (Change of Character) lines to identify potential trend reversals
Added toggle options for BOS and CHoCH visibility
Added customizable colors for structure lines
Added optional labels for BOS and CHoCH
v1.0
Initial release
Automatic swing high and swing low detection
Structure-based pivot confirmation (not fixed lookback)
Customizable pivot markers (style, size, colors)
Adjustable swing width sensitivity
━━━━━━━━━━━━━━━━━━━━━━
Disclaimer:
This script is provided for educational and informational purposes only. It is not financial advice and does not constitute a recommendation to buy or sell any financial instrument. Always do your own research and trade at your own risk.

Swing Pivots - Market Structure High Low [zazenio]What is Market Structure?
Market structure is simply the pattern of highs and lows that price creates as it moves. When you look at any chart, you'll notice price doesn't move in a straight line — it swings up, pulls back, swings up again (in an uptrend), or the opposite in a downtrend.
These swing points — the peaks and valleys — are what traders call pivots. Identifying them correctly is the foundation of understanding where a market has been and where it might go next.
What This Indicator Does
Swing Pivots automatically marks these peaks and valleys on your chart so you don't have to draw them manually. It works on any market — stocks, crypto, forex, futures, indices — and on any timeframe.
How Pivots Are Detected
This indicator confirms pivots based on price structure, not a fixed bar count.
Here's how it works:
A swing high is confirmed when price breaks below the previous swing low. At that moment, we know the high was real — price tried to go higher, failed, and reversed. The market "proved" that level was a genuine turning point.
A swing low is confirmed when price breaks above the previous swing high. The same logic applies — price tried to go lower, failed, and reversed direction.
This creates a natural alternation: high, low, high, low. Each pivot is validated by the market's actual behavior, not by waiting for an arbitrary number of bars to pass.
Why This Matters
Most pivot indicators use a "lookback" method — they wait for a certain number of bars (say, 5 or 10) on each side of a candle before confirming it as a pivot. This creates a fixed delay. By the time the pivot appears on your chart, price has already moved on.
This indicator doesn't wait. It confirms pivots the moment price structure proves them. The result is pivots that align with how traders actually read charts — based on breaks of structure, not arbitrary countdowns.
Settings
Swing Width: Controls how sensitive the detection is. Higher numbers show only major swings; lower numbers capture smaller moves within the structure.
Style/Size/Colors: Customize how the pivot markers look on your chart.
Use Cases
See the "skeleton" of price action at a glance
Identify potential support and resistance levels
Understand if the market is trending or ranging
Build a foundation for more advanced concepts like Break of Structure (BOS) and Change of Character (CHoCH)
⸻
Disclaimer:
This script is provided for educational and informational purposes only. It is not financial advice and does not constitute a recommendation to buy or sell any financial instrument. Always do your own research and trade at your own risk.

Trend Exhaustion Strategy [9,13]
** **
**Overview**
Trend Exhaustion Strategy is a specialized market timing tool designed to identify potential trend fatigue and price reversals. Based on classic 9-13 market timing logic, this indicator introduces a unique **Dynamic Support & Resistance Engine**.
Unlike standard counters, this script automatically projects active support and resistance levels from completed pattern phases. These lines serve as critical reference zones for trade management.
**Key Features**
* **Trend Exhaustion Detection:** Identifies potential market turning points using a two-phase structure:
* **Setup 9:** Highlights short-term momentum pauses.
* **Extension 13 (Phase 2):** Signals longer-term trend depletion and high-probability reversal zones.
* **Dynamic Extension Lines:**
* When a Setup 9 or Extension 13 completes, a horizontal level is instantly generated.
* **Resistance Lines (Red):** Generated at Tops.
* **Support Lines (Green):** Generated at Bottoms.
* **Smart Collision Detection:** The lines automatically extend to the right and terminate only when the price "collides" with or invalidates them.
**How to Use**
1. **Reversal Signals:** Look for the triangle icons (Setup 9) and labels (S13/B13). These often precede a pause or reversal.
2. **Breakout/Bounce Play:**
* Price approaches **Red Line** from below: Watch for rejection (Short).
* Price approaches **Green Line** from above: Watch for bounce (Long).
**Settings**
* **Recycle Mechanism:** Option to restart the count if specific conditions are met.
* **Visual Customization:** Fully adjustable line styles and colors.
-----
** **
**概述**
Trend Exhaustion Strategy (趋势耗尽策略) 是一款市场择时工具,旨在识别趋势疲劳和潜在的价格反转。本指标基于经典的 9-13 市场择时逻辑,并引入了独特的**动态支撑/阻力引擎**。
与普通计数器不同,该脚本会从完成的形态阶段自动生成有效的支撑和阻力线,为交易提供关键参考。
**核心功能**
* **趋势耗尽检测:** 使用双阶段结构识别市场转折点:
* **Setup 9:** 提示短期动能暂停。
* **Extension 13 (第二阶段):** 提示更长周期的趋势衰竭和高概率反转区。
* **动态延伸线:**
* 当 Setup 9 或 Extension 13 完成时,立即生成水平线。
* **阻力线(红色):** 在顶部生成。
* **支撑线(绿色):** 在底部生成。
* **智能碰撞检测:** 线段自动向右延伸,只有当价格触碰或突破它们时才会终止。
**使用方法**
1. **反转信号:** 观察三角形图标(Setup 9)和标签(S13/B13)。
2. **突破/反弹交易:** 价格接近红线看跌,接近绿线看涨。

FVH THE ARCHITECT (The Consensus)HE ARCHITECT - Institutional Logic Engine
System Philosophy: THE ARCHITECT is a defensive consensus engine designed to filter market noise and align price structure with institutional momentum. It does not generate signals in isolation; it requires a "Consensus" between Price Action, Volume, and Divergence before confirming a setup.
Core Features:
Institutional Structure: Automatically identifies Order Blocks (Bull/Bear), Fair Value Gaps (FVG), and Break of Structure (BOS) based on fractal logic.
Smart Consensus Filter:
Smart VWAP: Color-coded trend filter (Green = Up, Red = Down).
Volume Spikes: Identifies institutional injection (Purple Candles) at >1.5x average volume.
Smart Reversals: RSI Divergence labels are only printed if the candle color confirms the rejection.
Focus Mode: A toggle to switch between "History Mode" (Context) and "Focus Mode" (Active Zones Only) to reduce chart clutter.
How to Use:
Buy: Wait for price to enter a Green Bull OB. Look for a "Smart Buy" label or Purple Volume Spike.
Sell: Wait for price to enter a Red Bear OB. Look for a "Smart Sell" label.
Alerts: Includes hard-coded alerts for "Smart Buy", "Smart Sell", and "Volume Spikes" for automated notifications.