Volume Profile Regression Channel [LuxAlgo]The Volume Profile Regression Channel calculates a volume profile from an anchored linear regression channel. Users can choose the starting and ending points for the indicator calculation interval.
Like a regular volume profile, a "line" of control (LOC), value area, and a developing LOC are displayed.
🔶 SETTINGS
Sections: The number of sections the linear regression channel is divided into for the calculation of the volume profile.
Width %: Determines the length of the profile within the channel relative to the channel length.
Value Area %: Highlights the sections starting from the POC whose accumulated volume is equal to the user-defined percentage of the total profile sections volume.
🔶 USAGES
Regular volume profiles are often constructed from a horizontal price area, this can allow highlighting price areas where most trading activity takes place.
However, when price is strongly trending a classical volume profile can sometimes be more uniform. This is where using an angled volume profile can be useful.
The line of control allows highlighting the section of the channel with the most accumulated volume, this line can be used as a potential future support/resistance. This is where an angled volume profile might be the most useful.
The developing LOC highlights the LOC location at a specific time within the profile (from left to right) and can sometimes provide an estimate of the underlying trend in the price.
🔶 DETAILS
To be computed the script requires a left and right chart time coordinates. When adding the script to their charts users can determine the left and right time coordinates by clicking on the chart.
The linear regression channel width is determined so that the channel precisely encompasses the whole price.
🔶 LIMITATIONS
Using a very large calculation interval can return timeouts. Users can reduce the calculation interval to fix that issue from occurring.
The amount of drawing objects that can be used is limited, as such using a high calculation interval can display an incomplete profile.
🔶 ACKNOWLEDGEMENTS
If you are interested in these types of scripts, @HeWhoMustNotBeNamed published a similar script where users can use a custom line angle. See his 'Angled Volume Profile' script from March 2023.
サポート&レジスタンス

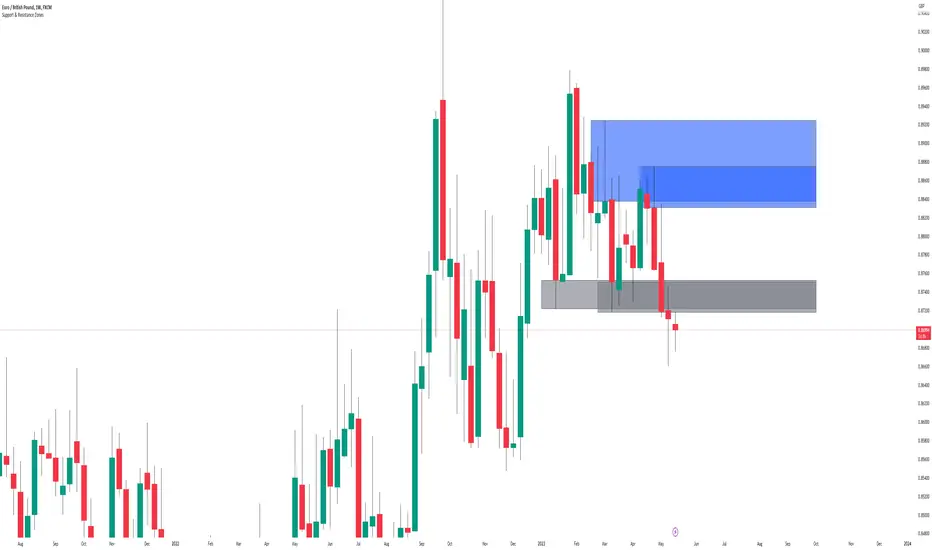
Support & Resistance ZonesTitle: A Comprehensive Guide to the Support & Resistance Zones Indicator
Introduction
In the world of technical analysis, the Support & Resistance Zones indicator plays a crucial role in identifying potential trading opportunities. These zones are essential for traders looking to capitalize on bounces or break and retests. In this article, we will delve into the specifics of the Support & Resistance Zones indicator, outlining how it works, how it finds and marks zones, and the various options available for traders.
What the indicator is about
The Support & Resistance Zones indicator, developed by @HarryCTC, is a powerful tool for detecting areas of potential price reversal or consolidation in a financial market. These zones are significant as they can act as a guide for traders to make informed decisions on entering or exiting positions. Specifically, the indicator helps identify:
1. Support Zones: Areas where the price has a tendency to bounce back up after falling, indicating a potential buying opportunity.
2. Resistance Zones: Areas where the price has a tendency to reverse after rising, indicating a potential selling opportunity.
How the indicator finds its zones
The Support & Resistance Zones indicator utilizes pivot points to identify potential support and resistance levels. By analyzing the fractal structure of the price chart, the indicator identifies key turning points, known as bull and bear fractals. The bull fractal is a high pivot point, while the bear fractal is a low pivot point.
The fractal structure is determined by the 'Switch Zone Period' input, which can be adjusted to suit the trader's preferences. A higher value will result in fewer zones being identified, while a lower value will result in more zones.
How it marks zones and why it marks zones
The indicator marks the support and resistance zones by creating rectangular boxes around the identified fractal points. The zones are extended horizontally from the fractal point, allowing traders to visualize the potential areas of price reversal.
The zones are marked for the following reasons:
1. To provide a clear visual representation of potential support and resistance levels.
2. To help traders identify potential entry and exit points based on the price's reaction to these zones.
3. To serve as a reference for stop-loss and take-profit levels when planning trades.
The indicator's for traders trading bounces or break and retests
Traders who focus on trading bounces or break and retests can benefit immensely from the Support & Resistance Zones indicator. By providing a visual representation of key support and resistance levels, the indicator enables traders to:
1. Identify potential buying opportunities at support zones where the price is likely to bounce back up.
2. Identify potential selling opportunities at resistance zones where the price is likely to reverse after rising.
3. Make informed decisions on stop-loss and take-profit levels based on the price's proximity to support and resistance zones.
4. Monitor the market for potential breakouts or breakdowns when the price breaches these zones.
Indicator options
The Support & Resistance Zones indicator offers several customizable options to suit the trader's preferences. These options include:
1. Switch Zone Period: Adjusts the number of periods used to calculate the fractal structure, influencing the number of identified zones.
2. No. of Displayed Zones: Determines the maximum number of zones displayed on the chart, ranging from 1 to 8.
3. Zone Extension: Adjusts the horizontal extension of the support and resistance zones.
4. Resistance Zone Color: Customizes the color of the resistance zone boxes.
5. Support Zone Color: Customizes the color of the support zone boxes.
6. Zone Border Color: Customizes the color of the zone box borders.
Conclusion
The Support & Resistance Zones indicator is a valuable tool for traders looking to identify potential trading opportunities based on the price's interaction with support and resistance levels. By providing a clear visual representation of these zones, the
indicator allows traders to make informed decisions on entry and exit points, stop-loss, and take-profit levels. With customizable options, the indicator can be tailored to suit individual trading preferences and strategies.
28 Levels V0.1V 0.1
Daily, weekly and monthly important key levels for trading options.
FYI: Not fully functional. It will take ongoing effort to complete the algo.
Supply and DemandThis is a "Supply and Demand" script designed to help traders spot potential levels of supply (resistance) and demand (support) in the market by identifying pivot points from past price action.
Differences from Other Scripts:
Unlike many pivot point scripts, this one offers a greater degree of customization and flexibility, allowing users to determine how many ranges of pivot points they wish to plot (up to 10), as well as the number of the most recent ranges to display.
Furthermore, it allows users to restrict the plotting of pivot points to specific timeframes (15 minutes, 30 minutes, 1 hour, 4 hours, and daily) using a toggle input. This is useful for traders who wish to focus on these popular trading timeframes.
This script also uses the color.new function for a more transparent plotting, which is not commonly used in many scripts.
How to Use:
The script provides two user inputs:
"Number of Ranges to Plot (1-10)": This determines how many 10-bar ranges of pivot points the script will calculate and potentially plot.
"Number of Last Ranges to Show (1-?)": This determines how many of the most recent ranges will be displayed on the chart.
"Limit to specific timeframes?": This is a toggle switch. When turned on, the script only plots pivot points if the current timeframe is one of the following: 15 minutes, 30 minutes, 1 hour, 4 hours, or daily.
The pivot points are plotted as circles on the chart, with pivot highs in red and pivot lows in green. The transparency level of these plots can be adjusted in the script.
Market and Conditions:
This script is versatile and can be used in any market, including Forex, commodities, indices, or cryptocurrencies. It's best used in trending markets where supply and demand levels are more likely to be respected. However, like all technical analysis tools, it's not foolproof and should be used in conjunction with other indicators and analysis techniques to confirm signals and manage risk.
A technical analyst, or technician, uses chart patterns and indicators to predict future price movements. The "Supply and Demand" script in question can be an invaluable tool for a technical analyst for the following reasons:
Identifying Support and Resistance Levels : The pivot points plotted by this script can act as potential levels of support and resistance. When the price of an asset approaches these pivot points, it might bounce back (in case of support) or retreat (in case of resistance). These levels can be used to set stop-loss and take-profit points.
Timeframe Analysis : The ability to limit the plotting of pivot points to specific timeframes is useful for multiple timeframe analysis. For instance, a trader might use a longer timeframe to determine the overall trend and a shorter one to decide the optimal entry and exit points.
Customization : The user inputs provided by the script allow a technician to customize the ranges of pivot points according to their unique trading strategy. They can choose the number of ranges to plot and the number of the most recent ranges to display on the chart.
Confirmation of Other Indicators : If a pivot point coincides with a signal from another indicator (for instance, a moving average crossover or a relative strength index (RSI) divergence), it could provide further confirmation of that signal, increasing the chances of a successful trade.
Transparency in Plots : The use of the color.new function allows for more transparent plotting. This feature can prevent the chart from becoming too cluttered when multiple ranges of pivot points are plotted, making it easier for the analyst to interpret the data.
In summary, this script can be used by a technical analyst to pinpoint potential trading opportunities, validate signals from other indicators, and customize the display of pivot points to suit their individual trading style and strategy. Always remember, however, that no single indicator should be used in isolation, and effective risk management strategies should always be employed.

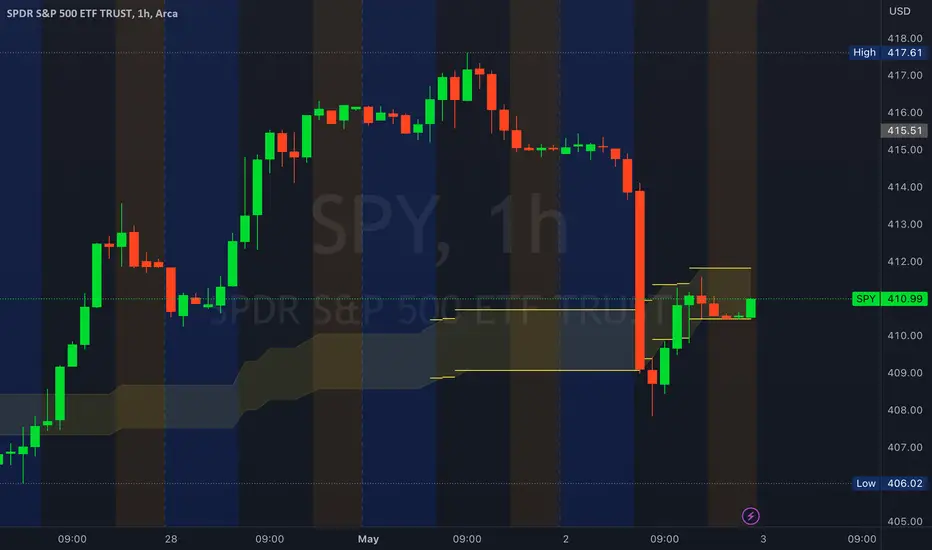
NSDT Custom High and Low LinesFirst, the credit for the original script to plot a High and Low between a certain time goes to developer paaax.
I took that idea, converted it to Pinescript V5, cleaned up the code, and added a few more lines so you can plot different levels based on time of day.
Published open source like the original.
The example shown has:
Blue - plotting from the start of the Futures Asian session to the start of the Futures USA Session. (6:00PM - 9:30AM Eastern)
Yellow - plotting from the start of the Futures Europe session to the start of the Futures USA Session. (3:00AM - 9:30AM Eastern)
Green - plotting from the start of the Futures US Premarket session to the start of the Futures USA Session. (8:00AM - 9:30AM Eastern)
These are great levels to use for breakouts and/or support and resistance.
Combine these levels with the 5 min Open Range levels, as you have some good trades.
Each of the three sessions have individual start and end times that can be modified by the trader, so you can easily mark off important areas for your style of trading.

ICT Macros [LuxAlgo]The ICT Macros indicator aims to highlight & classify ICT Macros, which are time intervals where algorithmic trading takes place to interact with existing liquidity or to create new liquidity.
🔶 SETTINGS
🔹 Macros
Macro Time options (such as '09:50 AM 10:10'): Enable specific macro display.
Top Line , Mid Line , Bottom Line and Extending Lines options: Controls the lines for the specific macro.
🔹 Macro Classification
Length : A length to detect Market Structure Brakes and classify macro type based on detection.
Swing Area : Swing or Liquidity Area selection, highest/lowest of the wick or the candle bodies.
Accumulation , Manipulation and Expansion color options for the classified macros.
🔹 Others
Macro Texts : Controls both the size and the visibility of the macro text.
Alert Macro Times in Advance (Minutes) : This option will plot a vertical line presenting the start of the next macro time. The line will not appear all the time, but it will be there based on remaining minutes specified in the option.
Daylight Saving Time (DST) : Adjust time appropriate to Daylight Saving Time of the specific region.
🔶 USAGE
A macro is a way to automate a task or procedure which you perform on a regular basis.
In the context of ICT's teachings, a macro is a small program or set of instructions that unfolds within an algorithm, which influences price movements in the market. These macros operate at specific times and can be related to price runs from one level to another or certain market behaviors during specific time intervals. They help traders anticipate market movements and potential setups during specific time intervals.
To trade these effectively, it is important to understand the time of day when certain macros come into play, and it is strongly advised to introduce the concept of liquidity in your analysis.
Macros can be classified into three categories where the Macro classification is calculated based on the Market Structure prior to macro and the Market Structure during the macro duration:
Manipulation Macro
Manipulation macros are characterized by liquidity being swept both on the buyside and sellside.
Expansion Macro
Expansion macros are characterized by liquidity being swept only on the buyside or sellside. Prices within these macros are highly correlated with the overall trend.
Accumulation Macro
Accumulation macros are characterized by an accumulation of liquidity. Prices within these macros tend to range.
The script returns the maximum/minimum price values reached during the macro interval alongside the average between the maximum/minimum and extends them until a new macro starts. These levels can act as supports and resistances.
🔶 DETAILS
All required data for the macro detection and classification is retrieved using 1 minute data sets, this includes candles as well as pivot/swing highs and lows. This approach guarantees the visually presented objects are same (same highs/lows) on higher timeframes as well as the macro classification remain same as it is in 1 min charts.
8 Macros can be displayed by the script (4 are enabled by default):
02:33 AM 03:00 London Macro
04:03 AM 04:30 London Macro
08:50 AM 09:10 New York Macro
09:50 AM 10:10 New York Macro
10:50 AM 11:10 New York Macro
11:50 AM 12:10 New York Launch Macro
13:10 PM 13:40 New York Macro
15:15 PM 15:45 New York Macro
🔶 ALERTS
When an alert is configured, the user will have the ability to be notified in advance of the next Macro time, where the value specified in 'Alert Macro Times in Advance (Minutes)' option indicates how early to be notified.
🔶 LIMITATIONS
The script is supported on 1 min, 3 mins and 5 mins charts.
🔶 RELATED SCRIPTS

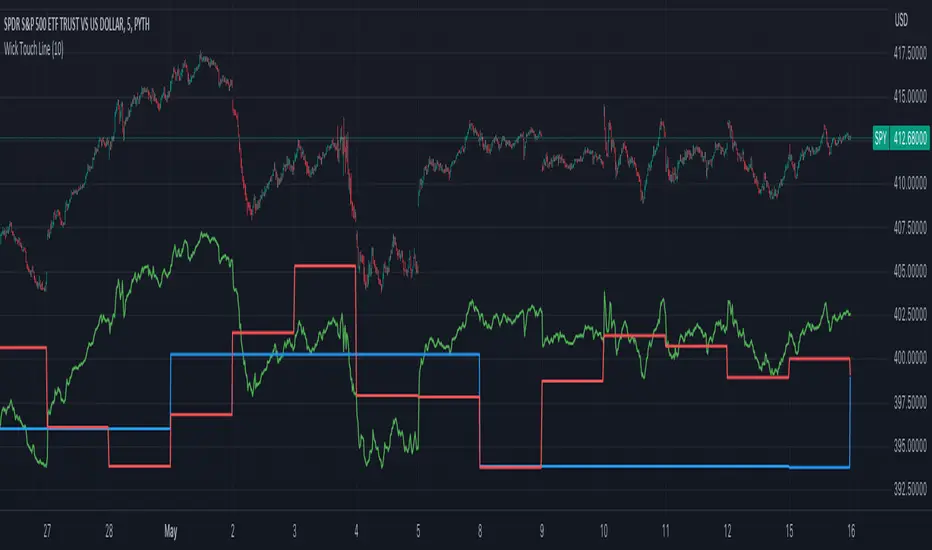
Autodrawn Support and Resistance LevelsAutodrawn Support and Resistance Levels is an indicator that helps traders identify key support and resistance levels on a chart. These levels are important because they can help traders make decisions about when to buy or sell an asset. The indicator uses three lookback periods to identify recent highs and lows and then draws lines at the highest support and resistance levels for those periods. The lines are color-coded, with green indicating support and red showing resistance. The thickness of the lines can also be adjusted to match a trader's preferences. The lines are updated automatically as new data is added to the chart, making it easy for traders to identify new levels of support and resistance as they emerge. Overall, this indicator is a helpful tool for traders who want to quickly and easily identify critical levels on a chart to inform their trading decisions.
By having one lookback period on a medium-term timeframe (e.g. 50), a short-term timeframe (e.g. 10), and a long-term timeframe (e.g. 300), it can be easier to identify support and resistance levels that are relevant to the current market trend, and see multiple critical levels at once. This can help you make more informed decisions about when to enter and exit trades, as well as where to set stop-loss orders. It may be valuable to consider that as shorter-term and longer-term support/resistance levels become closer together, it is more likely for there to be a reversal in the opposite direction.
This indicator is less useful in markets that have strong trends, where the horizontal support and resistance levels are likely to be less useful than trend line support and resistance levels, however it works well in sideways trading markets
Note: reupload since previous description violated tradingview rules

FVG Sessions [LuxAlgo]The FVG Sessions indicator highlights the first fair value gap of the trading session as well as the session range. Detected fair value gaps extend to the end of the trading session.
Alerts are included on the formation of a session fair value gap, price being within a session fair value gap, mitigations, and price crossing session fair value gaps average.
🔶 USAGE
Trader ICT states that the first fair value gap of the trading session can attract the most significant reaction. Having only one FVG per session allows users to further focus on that precise imbalance as well as external elements.
The mitigation of a fair value gap is clearly indicated on the chart with a more transparent color allowing users to see inverse FVGs.
Extending the fair value gaps allows the imbalance area to provide potential support and resistance.
Do note that this script should be used on intraday charts.
🔶 ALERTS
The script includes the following alerts:
🔹 Bullish/Bearish FVG
Alerts on the formation of the first bullish or bearish FVG of the session.
🔹 Bullish/Bearish FVG Mitigation
Alerts when the first bullish or bearish FVG of the session is mitigated.
🔹 Price Within FVG
Alerts when price is within the first bullish or bearish FVG area of the session.
🔹 Price Cross FVG Average
Alerts when price cross the average level of the first bullish or bearish FVG of the session.

52 Week High/Low FibonacciThe primary purpose of this indicator is to calculate and plot the 52-week high and low prices along with the Fibonacci retracement levels on the price chart. Fibonacci levels are commonly used in trading to identify potential support, resistance, and price reversal points.
First, the script initializes the Fibonacci levels and their corresponding colors, which will be used to plot the levels on the chart. Next, it calculates the 52-week high and low prices by finding the highest and lowest prices over the last 252 trading days, approximately equivalent to one year. Then, it identifies the overall trend direction by comparing the number of bars since the highest high and the lowest low. If the highest high is more recent, the trend is considered downwards; if the lowest low is more recent, the trend is upwards.
The script then plots the Fibonacci retracement levels on the chart, using horizontal lines at the respective price levels. It also creates labels for each level, displaying the percentage and the price value. Additionally, it draws a line connecting the 52-week high and low prices, providing a visual representation of the price range during the 52-week period.
Pros of this indicator include:
-Automatic calculation and plotting of Fibonacci levels, saving time for traders
-Clear trend identification based on 52-week high and low prices
-Visually appealing and easy-to-read chart representation with color-coded levels
-Provides insight into potential price reversal areas based on widely used Fibonacci levels
Cons of this indicator include:
-Only works on daily timeframes, limiting its usefulness for intraday and weekly traders
-Assumes that the trend will continue in the same direction, which may not always be accurate in real-world markets
-Does not provide explicit buy or sell signals, leaving the trading decision-making process up to the trader
-Solely relies on Fibonacci levels, which may not always be accurate; it is recommended to use other technical indicators or strategies alongside this indicator for a comprehensive trading approach
In conclusion, the '52 Week High Low Fibonacci' indicator is a valuable tool for traders interested in using Fibonacci levels for identifying potential price reversal points. By automatically calculating and plotting these levels based on 52-week high and low prices, the indicator provides a clear, color-coded visual aid, which can be especially helpful for traders who base their strategies on these levels.
However, it's worth noting that this indicator is limited to daily timeframes and doesn't provide explicit buy or sell signals, requiring traders to incorporate their own analysis and judgement in their decision-making process. The indicator also operates on the assumption of trend continuation, which may not always hold true.
While it's a beneficial tool, relying solely on this indicator for trading decisions may not be advisable. It's best used in conjunction with other indicators and trading strategies, providing a more balanced and comprehensive approach to trading in the financial markets. As always, risk management should be a key part of any trading strategy.
**YOUR INSIGHTFUL FEEDBACK OR SUGGESTIONS FOR REVISIONS TO THIS CODE ARE HIGHLY APPRECIATED. PLEASE FEEL FREE TO SHARE YOUR THOUGHTS TO FOSTER ITS CONTINUAL IMPROVEMENT**

Golden ZoneIntroducing the "Golden Zone" indicator, a powerful tool that simplifies the Fibonacci indicator by creating a clear Golden Zone to identify potential future price movements. The Golden Zone is a supply or demand zone that corresponds to the 61.8% and 50% Fibonacci retracement levels. These levels are important because they often mark zones where the price reacts, making it an essential area for traders to watch.
The script plots the Fibonacci levels in the background, enabling traders to identify potential support and resistance levels quickly. The Golden Zone is highlighted with a yellow filled area, making it easy to spot on the chart. Traders use this zone to identify areas where the stock price may react, either bouncing off the support level or encountering resistance at the resistance level.
For example, if a stock price is moving up and reaches the Golden Zone, a trader may look for signs of resistance and consider selling the stock if the price begins to move back down. Conversely, if a stock price is moving down and reaches the Golden Zone, a trader may look for signs of support and consider buying the stock if the price begins to move back up.
The "Golden Zone" indicator is highly versatile and can be used in all markets, whether you are a swing trader or a day trader. It can be combined with other strategies, such as an EMA crossover strategy or price action, or as an area of confluence.
In summary, the "Golden Zone" indicator is a must-have tool for traders looking to identify potential price movements and locate key support and resistance levels. Its user-friendly inputs and clear display make it a valuable addition to any trading arsenal.
So, the "Golden Zone" indicator is like a magic tool that helps people who trade in the stock market find valuable things to buy or sell. And with its ability to identify key support and resistance levels, it can help traders make better-informed decisions when buying or selling stocks.
I hope you like it!
Yearly Open LevelsThis script is a custom indicator for TradingView that shows the yearly open price levels on a chart. It differs from other scripts as it plots a single line for each year, showing the open price for that year, and labels the line with the year and open price. This indicator can be useful for identifying key levels of support and resistance based on the yearly open price.
To use this indicator, you need to add it to your TradingView chart and adjust the input parameters, such as the starting year and color. The script will then automatically plot lines and labels for each year's open price.
This script can be used in any market that has a yearly open price, such as stocks, futures, forex, and cryptocurrencies. However, it may be most useful in markets that tend to have significant year-to-year price movements, as it can help identify important levels of support and resistance. It may also be most effective in markets with a clear yearly cycle, such as those that tend to be influenced by seasonal factors.

SuperTrend with Chebyshev FilterModified Super Trend with Chebyshev Filter
The Modified Super Trend is an innovative take on the classic Super Trend indicator. This advanced version incorporates a Chebyshev filter, which significantly enhances its capabilities by reducing false signals and improving overall signal quality. In this post, we'll dive deep into the Modified Super Trend, exploring its history, the benefits of the Chebyshev filter, and how it effectively addresses the challenges associated with smoothing, delay, and noise.
History of the Super Trend
The Super Trend indicator, developed by Olivier Seban, has been a popular tool among traders since its inception. It helps traders identify market trends and potential entry and exit points. The Super Trend uses average true range (ATR) and a multiplier to create a volatility-based trailing stop, providing traders with a dynamic tool that adapts to changing market conditions. However, the original Super Trend has its limitations, such as the tendency to produce false signals during periods of low volatility or sideways trading.
The Chebyshev Filter
The Chebyshev filter is a powerful mathematical tool that makes an excellent addition to the Super Trend indicator. It effectively addresses the issues of smoothing, delay, and noise associated with traditional moving averages. Chebyshev filters are named after Pafnuty Chebyshev, a renowned Russian mathematician who made significant contributions to the field of approximation theory.
The Chebyshev filter is capable of producing smoother, more responsive moving averages without introducing additional lag. This is possible because the filter minimizes the worst-case error between the ideal and the actual frequency response. There are two types of Chebyshev filters: Type I and Type II. Type I Chebyshev filters are designed to have an equiripple response in the passband, while Type II Chebyshev filters have an equiripple response in the stopband. The Modified Super Trend allows users to choose between these two types based on their preferences.
Overcoming the Challenges
The Modified Super Trend addresses several challenges associated with the original Super Trend:
Smoothing: The Chebyshev filter produces a smoother moving average without introducing additional lag. This feature is particularly beneficial during periods of low volatility or sideways trading, as it reduces the number of false signals.
Delay: The Chebyshev filter helps minimize the delay between price action and the generated signal, allowing traders to make timely decisions based on more accurate information.
Noise Reduction: The Chebyshev filter's ability to minimize the worst-case error between the ideal and actual frequency response reduces the impact of noise on the generated signals. This feature is especially useful when using the true range as an offset for the price, as it helps generate more reliable signals within a reasonable time frame.
The Great Replacement
The Modified Super Trend with Chebyshev filter is an excellent replacement for the original Super Trend indicator. It offers significant improvements in terms of signal quality, responsiveness, and accuracy. By incorporating the Chebyshev filter, the Modified Super Trend effectively reduces the number of false signals during low volatility or sideways trading, making it a more reliable tool for identifying market trends and potential entry and exit points.
In-Depth Guide to the Modified Super Trend Settings
The Modified Super Trend with Chebyshev filter offers a wide range of settings that allow traders to fine-tune the indicator to suit their specific trading styles and objectives. In this section, we will discuss each setting in detail, explaining its purpose and how to use it effectively.
Source
The source setting determines the price data used for calculations. The default setting is hl2, which calculates the average of the high and low prices. You can choose other price data sources such as close, open, or ohlc4 (average of open, high, low, and close prices) based on your preference.
Up Color and Down Color
These settings control the color of the trend line when the market is in an uptrend (up_color) and a downtrend (down_color). You can customize these colors to your liking, making it easier to visually identify the current market trend.
Text Color
This setting controls the color of the text displayed on the chart when using labels to indicate trend changes. You can choose any color that contrasts well with your chart background for better readability.
Mean Length
The mean_length setting determines the length (number of bars) used for the Chebyshev moving average calculation. A shorter length will make the moving average more responsive to price changes, while a longer length will produce a smoother moving average. It is crucial to find the right balance between responsiveness and smoothness, as a too-short length may generate false signals, while a too-long length might produce lagging signals. The default value is 64, but you can experiment with different values to find the optimal setting for your trading strategy.
Mean Ripple
The mean_ripple setting influences the Chebyshev filter's ripple effect in the passband (Type I) or stopband (Type II). The ripple effect represents small oscillations in the frequency response, which can impact the moving average's smoothness. The default value is 0.01, but you can experiment with different values to find the best balance between smoothness and responsiveness.
Chebyshev Type: Type I or Type II
The style setting allows you to choose between Type I and Type II Chebyshev filters. Type I filters have an equiripple response in the passband, while Type II filters have an equiripple response in the stopband. Depending on your preference for smoothness and responsiveness, you can choose the type that best fits your trading style.
ATR Style
The atr_style setting determines the method used for calculating the Average True Range (ATR). By default (false), it uses the traditional high-low range. When set to true, it uses the absolute difference between the open and close prices. You can choose the method that works best for your trading strategy and the market you are trading.
ATR Length
The atr_length setting controls the length (number of bars) used for calculating the ATR. Similar to the mean_length, a shorter length will make the ATR more responsive to price changes, while a longer length will produce a smoother ATR. The default value is 64, but you can experiment with different values to find the optimal setting for your trading strategy.
ATR Ripple
The atr_ripple setting, like the mean_ripple, influences the ripple effect of the Chebyshev filter used in the ATR calculation. The default value is 0.05, but you can experiment with different values to find the best balance between smoothness and responsiveness.
Multiplier
The multiplier setting determines the factor by which the ATR is multiplied before being added
Super Trend Logic and Signal Optimization
The Modified Super Trend with Chebyshev filter is designed to minimize false signals and provide a clear indication of market trends. It does so by using a combination of moving averages, Average True Range (ATR), and a multiplier. In this section, we will discuss the Super Trend's logic, its ability to prevent false signals, and the early warning crosses added to the indicator.
Super Trend Logic
The Super Trend's logic is based on a combination of the Chebyshev moving average and ATR. The Chebyshev moving average is a smooth moving average that effectively filters out market noise, while the ATR is a measure of market volatility.
The Super Trend is calculated by adding or subtracting a multiple of the ATR from the Chebyshev moving average. The multiplier is a user-defined value that determines the distance between the trend line and the price action. A larger multiplier results in a wider channel, reducing the likelihood of false signals but potentially missing out on valid trend changes.
Preventing False Signals
The Super Trend is designed to minimize false signals by maintaining its trend direction until a significant change in the market occurs. In a downtrend, the trend line will only decrease in value, and in an uptrend, it will only increase. This helps prevent false signals caused by temporary price fluctuations or market noise.
When the price crosses the trend line, the Super Trend does not immediately change its direction. Instead, it employs a safety logic to ensure that the trend change is genuine. The safety logic checks if the new trend line (calculated using the updated moving average and ATR) is more extreme than the previous one. If it is, the trend line is updated; otherwise, the previous trend line is maintained. This mechanism further reduces the likelihood of false signals by ensuring that the trend line only changes when there is a significant shift in the market.
Early Warning Crosses
To provide traders with additional insight, the Modified Super Trend with Chebyshev filter includes early warning crosses. These crosses are plotted on the chart when the price crosses the trend line without the safety logic. Although these crosses do not necessarily indicate a trend change, they can serve as a valuable heads-up for traders to monitor the market closely and prepare for potential trend reversals.
In conclusion, the Modified Super Trend with Chebyshev filter offers a significant improvement over the original Super Trend indicator. By incorporating the Chebyshev filter, this modified version effectively addresses the challenges of smoothing, delay, and noise reduction while minimizing false signals. The wide range of customizable settings allows traders to tailor the indicator to their specific needs, while the inclusion of early warning crosses provides valuable insight into potential trend reversals.
Ultimately, the Modified Super Trend with Chebyshev filter is an excellent tool for traders looking to enhance their trend identification and decision-making abilities. With its advanced features, this indicator can help traders navigate volatile markets with confidence, making more informed decisions based on accurate, timely information.

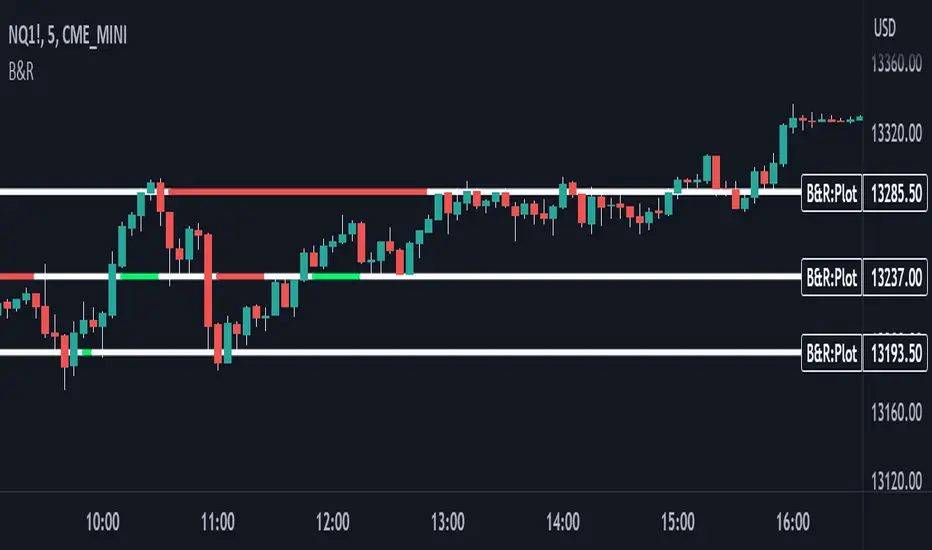
Support & Resistance With Breakout & RetestIntro
The Breakout Retest Indicator is a valuable tool utilized to confirm the occurrence of a proper breakout so you know when to enter on a retest. It analyses the price movement of an asset and identifies a breakout when the price level surpasses the inputted support and resistance values.
Conditions
The indicator operates based on simple yet reliable conditions. Once a candle closes above or below the specified line, the next candle's closure above or below without touching the high or low levels confirms the breakout. The indicator subsequently changes its color, signaling a long or short position. Upon retesting, it reverts to its original color.
Need Your Help
I am sharing this indicator to solicit your input in improving it. As a committed developer, I have ambitious plans for enhancing the indicator's functionality. To that end, I welcome your suggestions and ideas to build indicators that can contribute to the success of people's strategies.
Future Ideas
Some of the potential improvements that I plan to incorporate include the implementation of zones. Users will be able to define zones that require breaking above or below for a confirmed breakout. Additionally, a volume check will provide additional confirmation by evaluating the volume level relative to the breakout. Lastly, close above or below feature will ensure that a certain number of ticks, percentage, or price level has been breached to confirm the breakout.
Breaker Blocks with Signals [LuxAlgo]The Breaker Blocks with Signals indicator aims to highlight a complete methodology based on breaker blocks. Breakout signals between the price and breaker blocks are highlighted and premium/discount swing levels are included to provide potential take profit/stop loss levels.
This script also includes alerts for each signal highlighted.
🔶 SETTINGS
🔹 Breaker Blocks
Length: Sensitivity of the detected swings used to construct breaker blocks. Higher values will return longer term breaker blocks.
Use only candle body: Only use the candle body when determining the maximum/minimum extremities of the order blocks.
Use 2 candles instead of 1: Use two candles to confirm the occurrence of a breaker block.
Stop at first break of center line: Do not highlight breakout signals after invalidation until reset.
🔹 PD Array
Only when E is in premium/discount zone: Only set breaker block if point E of wave ABCDE is within the corresponding zone.
Show premium discount zone: Show premium/discount zone.
Highlight Swing Break: Highlight occurrences of price breaking a previous swing level.
Show Swings/PD Arrays: Show swing levels/labels and pd areas.
🔶 USAGE
The Breaker Blocks with Signals indicator aims to provide users with a minimalistic display alongside optimal signals to be aware of for finding trade setups as shown below.
Here we can see a MSS occurred allowing the indicator to detect a Breaker Block (-BB) & display a red arrow to confirm this signal.
The signal(s) that can be used for potential entries are only during retests of the breaker blocks.
A potential strategy traders could use with this indicator is to target the corresponding Discount PD Arrays detected (for a short position) and Premium PD Arrays (for a long position).
In the image above we can see price generated the potential entry signals in orange & fell to the Discount PD Arrays as a logical setup to look for with this indicator.
As we can see in the image above, signals can be considered invalid when price closes above the 50% level in which it would be suggested to wait for another setup.
Users still looking for more potential setups based on the same breaker block can disable the "Stop at first break of center line" setting within the settings menu.
In the image above we can see a bullish example whereas price confirmed a bullish breaker block (+BB), had a quick pullback into it that was confirmed by the green arrow, and then reached the Premium PD Arrays.
While retests of breaker blocks can still function well if they occur later in the price action, it's most preferable for users to look for entry signals that are near confirmed breaker blocks (5-10 bars) opposed to waiting 20+ bars.
Additional take profits based on the occurence of the breaker blocks are given in order to provide targets after the occurence of a breaker block breakout.
🔶 DETAILS
Breaker blocks are formed after a mitigated order block, these can provide change of polarity opportunities, thus playing a role as a potential support/resistance. It is the re-test/retrace of price to a breaker block that will set the conditions to provide signals.
The above chart describes the creation of a breaker block.
The signal generation logic makes use of various rules described below:
Bullish Breaker Blocks:
opening price is within the breaker block, while the closing price is above the upper extremity of the breaker block.
Price did not cross the breaker block average in the interval since the previous breakout.
Bearish Breaker Blocks:
opening price is within the breaker block, while the closing price is below the lower extremity of the breaker block.
Price did not cross the breaker block average in the interval since the previous breakout.
When a new pattern is formed, all previous drawings are removed.
🔶 RELATED SCRIPTS

EMA + ATR Support and Resistance + Take Profit SignalThe 'EMA+ ATR Support Resistance Take Profit signal' indicator is a technical analysis tool designed to help traders identify potential support and resistance levels, using the Exponential Moving Average (EMA) and the Average True Range (ATR) indicators. This indicator not only tracks the EMA and ATR but also plots these levels as support and resistance lines, providing useful insights into potential buy and sell points.
The indicator allows you to set the lengths for both the EMA and ATR, with default values set to 20 and 14, respectively. Moreover, you can specify the multiplier for the ATR in the Support/Resistance (S/R) length setting, which defaults to 2. The line width for the plotted lines can also be adjusted according to your preference.
The EMA line in center is invisible by default but you can change that by going to the setting of the indicator. The support and resistance lines are plotted in green and red, respectively. When the price hits the support or resistance levels, the indicator provides a visual signal with a cross shape below or above the respective bars, in lime and red, respectively. If you do not need the take profit signals you can disable them in the setting.
How to Use:
1. Define the EMA and ATR lengths according to your trading strategy. Higher lengths will provide smoother lines but may also lag the current price action.
2. Set the S/R length to determine the distance of the support and resistance lines from the EMA line. Higher values will place these lines further away from the EMA.
3. Monitor the chart for instances when the price hits the support or resistance levels. This is indicated by a cross shape below (for support hit) or above (for resistance hit) the price bar. These points may be considered as potential take profit points or entry/exit points, depending on your strategy.
4. Use the indicator in conjunction with other tools and indicators to confirm signals and reduce the risk of false signals. So the assumption is you enter a trade using your other indicators but you can rely on this indicator to remind you to take profit if you are long by a red cross of the resistance line and if you are short reminds you by a green cross on the support line.
Disclaimer: This indicator should not be used as the sole determinant for any investment decision. Always conduct thorough research and consider multiple factors before trading.

Volume-based Support & Resistance Zones-V1 By Trade Mastership™ The all-new Support & Resistance Zones indicator, which has been upgraded to offer traders more powerful features and functionality. This innovative indicator identifies high-volume fractal lows or highs to create zones based on the size of the wick for that timeframe's candle. This makes it easy for traders to visualize which price levels are the most significant for either a trend continuation or a reversal when zones are broken and retested.
The original script for this indicator was created by Trade Mastership, with additional modifications by L N Behera. Credit goes to both of them for the majority of the logic behind this script. Since then, the script has been improved with several changes, including:
Changing the default S/R lines from plots to lines, and giving users the option to change between solid, dashed, or dotted lines for both S/R lines
Adding additional timeframes and more options for TF1, beyond the current TF. Now, users have four timeframes to plot S/R zones from
Giving users the option to easily change the line thickness for all S/R lines
Making it easier to change the colors of S/R lines and zones by consolidating the options under settings (rather than under style)
Adding extensions to active SR Zones to extend all the way right
Adding the option to extend or not extend the previous S/R zones up to the next S/R zone
Adding optional timeframe labels to active S/R zones, with left and right options, as well as the option to adjust how far to the right the label is set
Fixing an issue where the higher timeframe S/R zone was not properly starting from the high/low of fractal. Now, any higher timeframe S/R will begin exactly at the High/Low points. Note that this may not work perfectly on stocks, and if a fractal high/low is too many bars in the past, it will revert to a default max bars back to avoid script errors.
Adding a function to prevent S/R zones from lower timeframes displaying while on a higher timeframe. This helps clean up the chart quite a bit.
Creating arrays for each timeframe's boxes and lines so that the number of S/R zones can be controlled for each timeframe and limit memory consumption.
Adding new alert options and customized alert messages
Here's how this indicator works: it looks for fractal highs or fractal lows with volume that pierces above the volume's Moving Average. This moving average value can be modified in the settings for each timeframe. The fractal highs will be confirmed with three successive higher highs followed by two successive lower highs and vice versa for the fractal lows. The zone is created from the fractal high/low and the close of the candle for whatever timeframe you selected. The bigger the zone, the more significant that zone is.
Traders can disable any zone, change the zones to show lines only, and modify all the colors, transparencies, and thickness of lines for all the zones. To create alerts, traders can enable the types of alerts they want for each timeframe in the indicator's settings. After applying changes, right-click on one of the zones on the chart, and click "Add Alert on Vol S/R Zones." You do not need to add a title, as the correct alert messages are already built-in.
The latest update has migrated the script to Pine Script Version 5 and added a higher number of total boxes/lines to show on the chart. It has also increased the max bars count to the maximum Pine Script allows, enabling traders to utilize as many bars as possible when drawing the left side of SR zones that are very far back on the chart. Additionally, the update fixed issues where the indicator would not load on 1 minute and 3-minute charts unless higher timeframe SR zones

Support/Resistance by Oddbeaker LLCThis is a port of an indicator I wrote for MT4 several years ago. At the time it was the only thing available that could accurately plot support/resistance lines in an automated way. Now there are many that do similar things, but I still think this is one of the cleanest and most straightforward ones to use.
Parameters :
Signal Bars - Number of candles to look back for the high and low.
Peak Bar - Which of the candles must be the high or low to be used as the support or resistance level.
Notes :
Setting Peak Bar to 3 gives the most accurate results. Lower values will give false signals and higher values might be late in generating a useful signal.
Adjust your Signal Bars according to the timeframe you use. For example, 20 days worth of candles on 1-hour or higher charts will produce strong entry signals.
Example Chart Settings:
Weekly - 52 / 3
Daily - 20 / 3
4-hour - 120 / 3
1-hour - 480 / 3
5-minute - 72 /3
1-minute - 240 / 3
(c) by Oddbeaker LLC. All Rights Reserved.

Auto Fib ZonesAuto Fib Zones is a extension of the ABC finder script that I released. It uses the pivot point system I developed in the ABC finder to identify major or significant trending moves in the market.
It will then draw the fibzones for the trend line. The fib zone will auto update for as long as the trend line continues (size will keep increasing).
The zones will continue to extend to the right along with price until it is tested. The start of the green teal zone is the 0.618 and fills to the 0.786 and the Blue zone is the 0.786 and fills to the trend start or 1 value of the fib.
You can adjust the Bars Back variable to require more or less candles to create/ validate a new trend. In the screen shot about it is set to 50 bars however I've seen good results on higher timeframes like 4h + with 15 bars as the setting.
This is basically ITC's Optimal Trade Entry concept at least that is what the original inspiration for modifying my base script was.
As always hope it helps. God bless

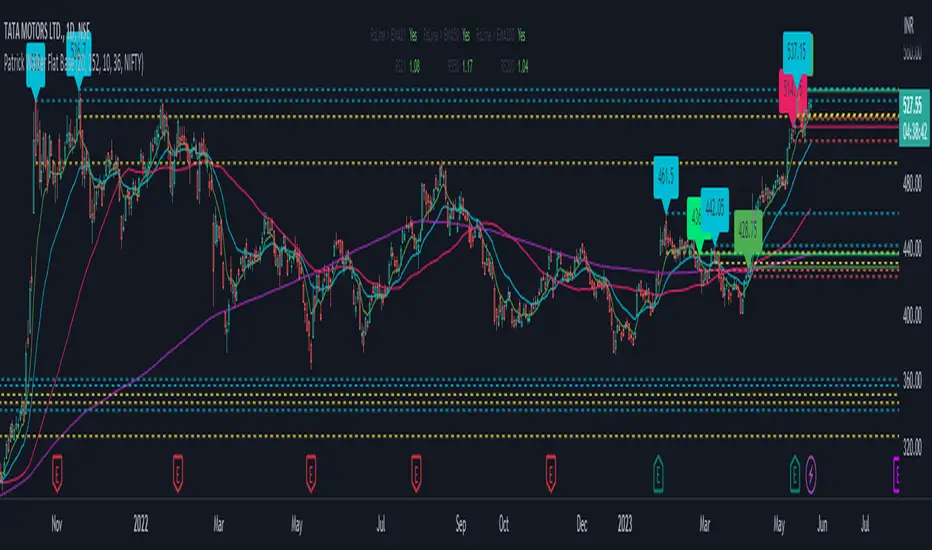
Patrick Walker Flat BaseThis pine script is provide recent support and resistance.
Script will use ema8, ema21, sma50 and sma200 to generate the support and resistance line.
Inspired from Patrick Walker style of trading. This is my personal logic i build studying the charts.
There is 3 types of resistance generated by this script.
1) top resistance 1
when ema8 > ema21 and low > ema8 and gap between ema21 and sma50 is less than 10% and in last 3 days previous 4th days highs is not crossed by close.
2) top resistance 2
when close/open below ema21 and ema8 > ema21 and high >= ema8 and ema21 > sma50 and gap between ema21 and sma50 is less than 10%
3) bottom resistance
when ema8 < ema21 and close/open cross above ema8 but high < ema21
Trend Reversal System with SR levelsHello All,
This is the Trend Reversal System with Support/Resistance levels script. long time ago I published it as closed source but now I upgraded it and and published as open-source with a different name. I hope it would be useful for you all while trading/analyzing.
The script has some parts in it: Setup, Count, SR levels, Risk levels & Targets . Now lets check them:
Setup Part: it has two part, Buy or Sell Setup. one of them can be active only. Buy setup: if current close checks if current is lower/equal than the close of the 5. bar. if yes then the script increases number of buy setup. and if it reaches 9 then the script checks if current low is lower/equal than the lows of last 3. and 4. bars, or if the low of the last bar is lower/equal than the lows of last 3. and 4. bars. if yes then the script increases the buy setup by 1. if these conditions met then it puts the label 'S' , same for Sell setup. S labels on both setup are potential reversals.
Count Part: If buy or sell setup reaches the 9 then Count part starts from 1. lets see buy count: If current close is lower/equal than the low of the 3. bar and buy count is lower than 12 or low of the bar 13 is less than or equal to the close of bar 8 then buy count increase or it's completed. if it's completed then the script puts C label, and it's potential reversal. of course there are some conditions that can cancel the count buy/sell or recycle/restart.
By using Setup and Count levels the script can show Support/Resistance Levels, Risk levels & Targets. SR levels are potential reversal levels.
Lets see some example screenshots:
Support/Resistance levels:
Potential Reversal levels and how setup/counts are shown:
Count part can recycle and the script shows it as 'R' , ( you can see the conditions for Recycle in the script ):
Count can be cancelled and and it's shown as 'x'
If the scripts find 9 on Setup or 13 on Count then it checks if it's a good level to buy/sell and if it decides it's good level then it shows TRSSetup Buy/Sell or TRSCount Buy/Sell and also shows the target. in following example the script checks and decide it's a good level to take long position. it can be aggressive or conservative, Conservative is recommended.
Enjoy!

Supply and Demand Visible Range [LuxAlgo]The Supply and Demand Visible Range indicator displays areas & levels on the user's chart for the visible range using a novel volume-based method. The script also makes use of intra-bar data to create precise Supply & Demand zones.
🔶 SETTINGS
Threshold %: Percentage of the total visible range volume used as a threshold to set supply/demand areas. Higher values return wider areas.
Resolution: Determines the number of bins used to find each area. Higher values will return more precise results.
Intra-bar TF: Timeframe used to obtain intra-bar data.
🔶 USAGE
The supply/demand areas and levels displayed by the script are aimed at providing potential supports/resistances for users. The script's behavior makes it recalculate each time the visible chart interval/range changes, as such this script is more suited as a descriptive tool.
Price reaching a supply (upper) area that might have been tested a few times might be indicative of a potential reversal down, while price reaching a demand (lower) area that might have been tested a few times could be indicative of a potential reversal up.
The width of each area can also indicate which areas are more liquid, with thinner areas indicating more significant liquidity.
The user can control the width of each area using the Threshold % setting, with a higher setting returning wider areas. The precision setting can also return wider supply/demand areas if very low values are used and has the benefit of improving the script execution time at the cost of precision.
The Supply and Demand Zones indicator returns various levels. The solid-colored levels display the average of each area, while dashed colored lines display the weighted averages of each area. These weighted averages can highlight more liquid price levels within the supply/demand areas.
Central solid/dashed lines display the average between the areas' averages and weighted averages.
🔶 DETAILS
Each supply/demand area is constructed from volume data. The calculation is done as follows:
The accumulated volume within the chart visible range is calculated.
The chart visible range is divided into N bins of equal width (where N is the resolution setting)
Calculation start from the highest visible range price value for the supply area, and lowest value for the demand area.
The volume within each bin after the starting calculation level is accumulated, once this accumulated volume is equal or exceed the threshold value ( p % of the total visible range volume) the area is set.
Each bin volume accumulation within an area is displayed on the left, this can help indicate how fast volume accumulates within an area.
🔶 LIMITATIONS
The script execution time is dependent on all of the script's settings, using more demanding settings might return errors so make sure to be aware of the potential scenarios that might make the script exceed the allowed execution time:
Having a chart's visible range including a high number of bars.
Using a high number of bins (high resolution value) will increase computation time, this can be worsened by using a high threshold %.
Using very low intra-bar timeframe can drastically increase computation time but can also simply throw an error if the chart timeframe is high.
Users facing issues can lower the resolution value or use the chart timeframe for intra-bar data.

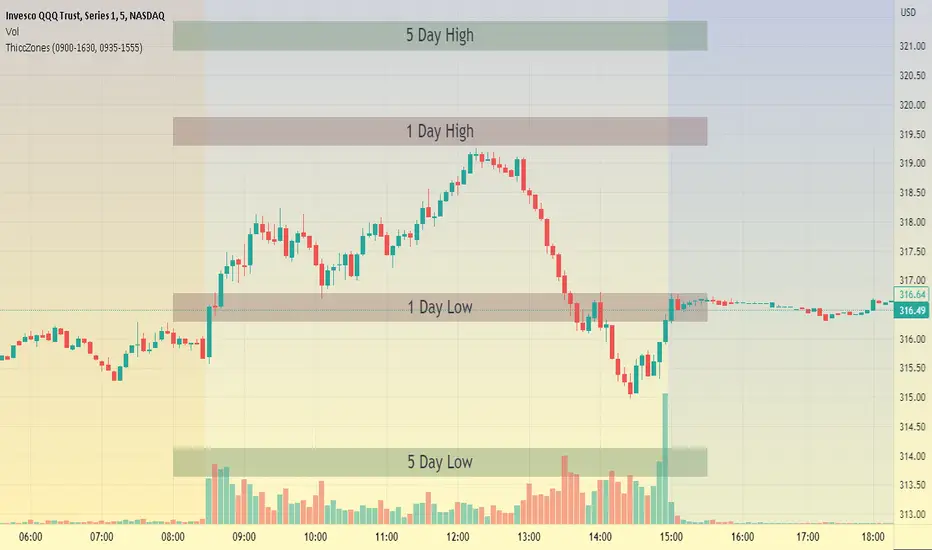
ThiccZonesThis indicator is a formula that includes 4 different zones which are different sizes based on the ticker you decide to use. It was optimized for SPY and other market ETFs but works well for all stocks on the market. The formula puts a zone at the previous day's high and low, and the previous 5 day's high and low. These zones are meant to be used as support and resistance and can even overlap, creating a 'master zone'. This is different than other zone indicators because the formula for these zones is something I created myself and have been unable to find on here. I have had the most success using a 1-15 minute chart and using my zones for reversal areas. I often look for other indications of reversal as well that line up with the area of the zones. It can also be used on the break and retest of these zones. I have found that when a stock breaks one of these zones it will often retest and continue that trend.
Volume Profile Fixed Range Support and Resistance LevelsThis script is based on the excellent Volume Profile / Fixed Range indicator by @LonesomeTheBlue, so all credit for the foundations of this indicator goes to @LonesomeTheBlue
I basically made 5 instances of the original script and added horizontal lines at the beginning and end of the each Value Area. To use the script as a support and resistance tool without the Value Areas and Point of Control (POC) labels you just need to untick "Boxes" and "Labels" in the "Style" section of the “Settings”.
The default look-back periods (in bars) are 7, 30, 60, 180 and 365, but you can change this or the colour of the lines easily in the “Settings”.
The dashed lines are the respective POC.
I find this tool to be very useful for quickly identifying interest levels on any chart while also ensuring a certain amount of objectivity in your TA.
Hope you find it useful and thanks again to @LonesomeTheBlue for going through the trouble of coding this and being so generous to share it with the rest of us!
Good luck out there!
