Strat Radar_vtStrat Radar is a visual tool to trade "TheStrat" methodology.
TheStrat is a simple yet powerful model to view the market. From one bar to the next, there are only three possible scenarios or three types of candles:
type 1 - an inside bar. Market is in consolidation.
type 2 - a directional bar (2 up or 2 down). Market is trending.
type 3 - an outside bar. This is a broadening formation and market is taking liquidity from both upside and downside.
So by looking at candle type and combination, one can visualize what price is doing in the market.
Strat Radar makes it possible for user to see candle type and sequence for all major time frames – from a 5m bar to a yearly bar - all in one chart! And even better, it allows user to see not just one bar but last three bars!
Certain candle combination creates high probability trade setups, for example 2-1-2 or 2-2 reversals, so by looking at Strat Radar, user can quickly determine whether there are any good trading opportunities. The simple and visual layout makes it easy to go through a watch list and use Strat Radar as a scanner. There is no need to flip through multiple time frame charts.
Features:
Show candle type and color for twelve time frames from 5m to yearly bar
Show candle type and color for last three bars of each time frame
Location of candle number and candle color have specific meaning:
For non-directional bars ( 1 and 3):
Below candle means close > open
Above candle means close < open
For directional bar 2:
Below candle means: 2 up
Above candle means: 2 down
Candle color: green - close>open, red – close < open
A built-in trend strength system that can be turned on or off
A reversal marker that can be turned on or off. It is based on a combination of Strat candle sequence and trend strength
Since candle type and combination are clearly shown for each time frame, it is easy to determine whether is Full Time Frame Continuity (FTFC).
Strat Radar_vt is a light version of the full indicator and covers:
- most futures market
- 30 stocks in Dow Index
- Index and sector ETFs : SPY , QQQ , DIA, IWM , XLE , XLF , XLU , GDX , XLK , XLV , XLY , XLB , ITB , XRT , SMH , IBB , KRE , XLC , GDXJ , KBE
- Some key stocks: AAPL , AMZN , FB , GOOGL , TSLA , NVDA , NFLX
- Forex pairs: DXY , AUDCAD , AUDJPY , AUDNZD , AUDUSD , EURCAD , EURGBP , EURJPY , EURUSD , GBPJPY , GBPUSD , NZDUSD , USDCAD , USDJPY
Full version works on all stocks and assets. If you like this indicator and require the full version, please contact the author.
Thestrat

The Strat Numbers & CombosThis indicator is an all-in-one " The Strat " script. This script displays the following:
The Strat candle numbers (1's, 2's, & 3's)
The Strat Combo labels along with trigger line
Pivot Machine Gun ( PMG ) dynamic labels
Hammer & Shooter candle labels
The Strat Candle Numbers label each candle, on any timeframe, either a 1, 2, or 3. 1's are inside bars of the previous candles. 2's take out only one side of the previous candle. And 3's go outside both sides of the previous candle.
The Strat Combo labels (which are made of the 1's, 2's, 3's outlined above) display labels when a Strat Combo occurs. The script displays a label, direction arrow, and trigger line for each Strat Combo. This indicator finds the following Strat Combos:
2-1-2 bullish reversal (BLR)
2-1-2 bullish continuation (BLC)
3-1-2 BLR
3-2-2 BLR
1-2-2 rev strat BLR
2-2 BLR
2-1-2 bearish reversal (BRR)
2-1-2 bearish continuation (BRC)
3-1-2 BRR
3-2-2 BRR
1-2-2 rev strat BRR
2-2 BRR
Double inside candles
The Pivot Machine Gun (PMG) labels any 5 or more consecutive candles that make higher lows or 5 or more consecutive candles that make lower highs. A PMG can continue going in its direction or it can reverse and come back through the range. The logic in this indicator dynamically finds each level in a PMG and draws a line for easy identification.
The script also identifies if the candle type is a Hammer, Inverted Hammer, Shooting Star, or Hanging Man. These candle types are highly likely reversal points in price action.The indicator will plot a shape with a color coded icon identifying the candle. The distance between the shape and the candles can be manually adjusted in the inputs section.
This indicator has many style options . The user can independently toggle on/off the Strat numbers, boxes around the Strat Combos, and Hammer and Shooter shapes. Also all of the colors used in this script can be changed from the inputs section, so a user can easily change colors to match their current color scheme.

*SSS 50% [4/8/D/W]** SSS 50% - 4HR, 8HR, Day and Week Timeframe Edition **
This indicator is based on Sara Strat Sniper's - 50% Rule for trading Outside Bars and helps you visual the method quickly.
As per user request this indicator allows you to select: Outside 4HR, 8HR, Daily and Weekly 50% Levels with Previous High and Low Levels, available within the indicators settings.
Please note - Daily 50% warning and high/low levels are set to the indicators default. Feel free to change and save as required. Any issues let me know.
** Indicator Setup Requirements **
For Indicator to correctly display the 50% price level you need to setup your chart correctly. Right-click your chart background, select Settings, select Scales and Tick “Indicator Last Value Label". Now your 50% Price level will be displayed.

*SSS 50% [Intra]SSS 50% Rule Indicator - Intraday 5/15/30/60 Version
This indicator is based on Sara Strat Sniper's - 50% Rule for trading Outside Bars and helps you visual the method quickly.
This indicator allows you to select: Outside 5/15/30/60 minute Warning Levels with Previous High and Low Levels all available within the indicators settings.
Please note - 60 minute warning and high/low levels are set to the indicators default. Feel free to change and save as required. Any issues let me know.
** Indicator Setup Requirements **
For Indicator to correctly display the 50% price level you need to setup your chart correctly. Right-click your chart background, select Settings, select Scales and Tick “Indicator Last Value Label". Now your 50% Price level will be displayed.
Nov 30, 2021
Custom functions added as requested by users to produce cleaner charts.
H Line added for 50% level
Ability to change color for H/L Levels and Labels.
Adjust Line Width and Line Style
Adjust 50% and High/Low Label Offsets
Basic Alert Function added for 50% Level. Add Alert and Select Condition: SSS 50%, followed by your desired Outside Day Warning.
Please note alert functions have been tested and work once the current close price crosses the 50% level. Any issues please let me know and I will update when required.

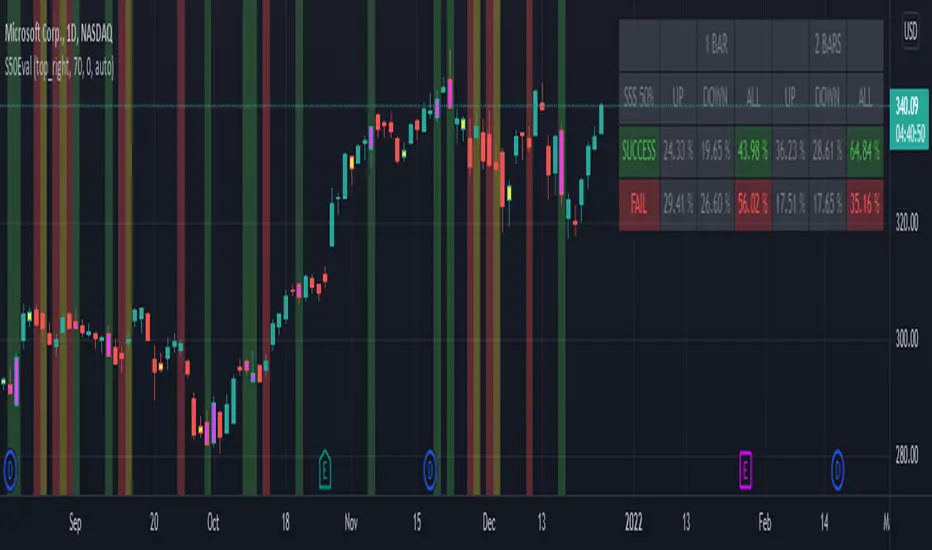
[BM] SSS 50% Rule EvaluatorSara Strat Sniper 50% Rule Evaluator
█ OVERVIEW
This indicator is based on Sara Strat Sniper's - 50% Rule for trading Outside Bars and helps you to evaluate the historical success rate of that rule.
█ FEATURES
Calculation
• You can choose to evaluate only the current bar to see if it forms an outside bar (success) or not (fail), but you can also choose to include the next bar to see if that one forms a compound outside bar.
• You can enable a start and/or end date to limit the calculation period.
Table
• Show or hide the table with the calculation results.
• Show or hide the calculation details (up/down data).
• Position of the table, opacity, cell width and text size can be customized.
Colors
• Table colors can be customized.
• You can choose to show the inside/outside bars in customizable bar colors.
• You can choose to identify successful/failed/recovered outside bars in customizable background colors.
█ LIMITATIONS
• This script uses a special characteristic of the `security()` function allowing the inspection of intrabars — which is not officially supported by TradingView.
• Intrabar inspection only works on some chart timeframes: 5, 10, 15, 30, 45 and 195 minutes, 1, 2, 3, 4, 5, 6, 7 and 8 hours, 1, 2, 3, 4 and 5 days, 1, 2, 3 and 4 weeks, 1, 2, 3, 4, 5, 6, 7, 8, 9, 10, 11 and 12 months. The script’s code can be modified to run on other resolutions.
• There is a limit to how far back intrabar calculations can be performed, and is dependant on both the intrabar resolution and your subscription (which determines the number of available bars).
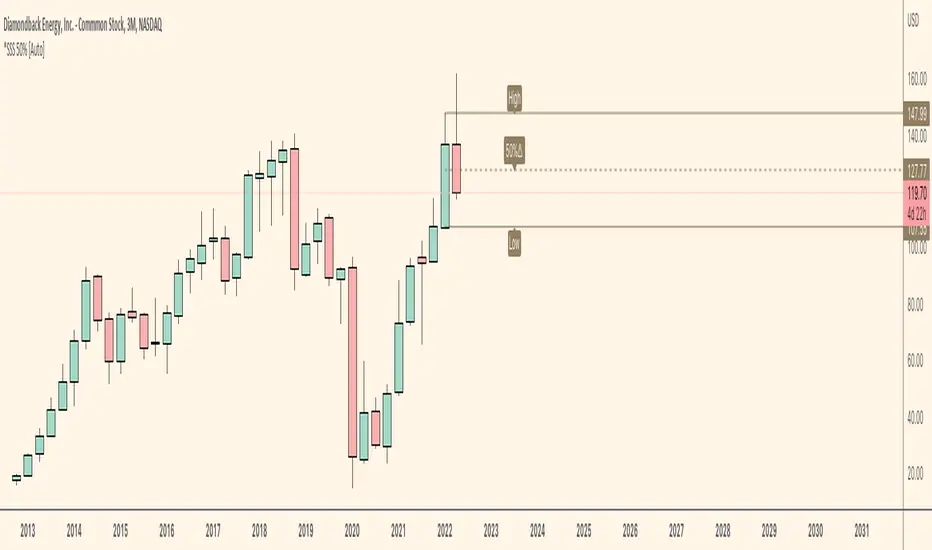
*SSS 50% [Auto]** SSS 50% - Displays Outside Warning and Previous High/Low on Current chart timeframe or Custom Timeframe Selection **
Outside Warning and Previous high/low levels default is set to the current charts timeframe.
For all Custom Timeframes, select within Indicator settings. Note this indicator is a simple version of my previous SSS Rule Indicator and HTF as this is allows for ONE Timeframe only!
This indicator is based on Sara Strat Sniper's - 50% Rule for trading Outside Bars and helps you visual the method quickly.
** Indicator Setup Requirements **
For Indicator to correctly display the 50% price level you need to setup your chart correctly. Right-click your chart background, select Settings, select Scales and Tick “Indicator Last Value Label". Now your 50% Price level will be displayed.
Known Issues:
This indicator does not work when you try to view a lower timeframes levels on a higher timeframe chart.
Example 1: Selecting Daily Warning, High and Low Levels will not be displayed correctly on a Weekly timeframe and above etc. The Daily selection however will be displayed correctly on all lower timeframes from the 1 minute chart to the Daily.
Example 2: Selecting Weekly Warning, High and Low Levels will not be displayed correctly on a Monthly timeframe and above etc. The Weekly selection however will be displayed correctly on all lower timeframes from the 1 minute chart to the Weekly. Please apply these same rules for all other timeframe indicator selections.
Monthly Warning, High and Low levels will not work correctly on a Weekly chart when the current Weekly candlestick is forming between the end of a previous Month and start of new Month. Once the first Weekly candle of a new Month closes the Monthly levels will now be displayed correctly. Please note, selecting the Monthly levels when viewing a Monthly chart will work as normal and Monthly levels displayed on a Weekly chart will be corrected once the first Weeks candle has closed. I believe this error is caused by a pine script repainting issue when assessing historical price data which is out of my limited scripting brains control.
*SSS 50% HTF** SSS 50% - HTF (Higher Timeframe) -D/W/M/Q Edition **
This indicator is based on Sara Strat Sniper's - 50% Rule for trading Outside Bars and helps you visual the method quickly.
This indicator allows you to select: Outside: Day/Week/Month/Quarter Warning Levels with Previous High and Low Levels available within the indicators settings.
Please note - Daily warning and high/low levels are set to the indicators default. Feel free to change and save as required. Any issues let me know. See known issues below.
** Indicator Setup Requirements **
For Indicator to correctly display the 50% price level you need to setup your chart correctly. Right-click your chart background, select Settings, select Scales and Tick “Indicator Last Value Label". Now your 50% Price level will be displayed.
Known Issues:
This indicator does not work when you try to view a lower timeframes levels on a higher timeframe chart.
Example 1: Selecting Daily Warning, High and Low Levels will not be displayed correctly on a Weekly timeframe and above etc. The Daily selection however will be displayed correctly on all lower timeframes from the 1 minute chart to the Daily.
Example 2: Selecting Weekly Warning, High and Low Levels will not be displayed correctly on a Monthly timeframe and above etc. The Weekly selection however will be displayed correctly on all lower timeframes from the 1 minute chart to the Weekly. Please apply these same rules for all other timeframe indicator selections.
Monthly Warning, High and Low levels will not work correctly on a Weekly chart when the current Weekly candlestick is forming between the end of a previous Month and start of new Month. Once the first Weekly candle of a new Month closes the Monthly levels will now be displayed correctly. Please note, selecting the Monthly levels when viewing a Monthly chart will work as normal and Monthly levels displayed on a Weekly chart will be corrected once the first Weeks candle has closed. I believe this error is caused by a pine script repainting issue when assessing historical price data which is out of my limited scripting brains control.

*SSS 50% Rule IndicatorThis indicator is based on Sara Strat Sniper's - 50% Rule for trading Outside Bars and helps you visual the method quickly.
This indicator allows you to select: Outside Day/Week/Month Warning Levels with Previous High and Low Levels all available within the indicators settings.
Please note - Daily warning and high/low levels are set to the indicators default. Feel free to change and save as required. Any issues let me know.
** Indicator Setup Requirements **
For Indicator to correctly display the 50% price level you need to setup your chart correctly. Right-click your chart background, select Settings, select Scales and Tick “Indicator Last Value Label". Now your 50% Price level will be displayed.

RM Timeframe ContinuityThis indicator plots a table off to the right of the chart to help with determining timeframe continuity. Per the Strat, a great edge is only taking trades where full timeframe continuity is in place (i.e. if you are going long, make sure other timeframes are also green).
In this script:
Green candles have green colored boxes, red candles have red colored boxes.
Inside bars are represented by a circle - ⬤
Outside bars are represented by a tall rectangle - ▮
2-up bars are indicated by an up arrow - ▲
2-down bars are indicated by a down arrow - ▼
User defined options:
Pick any timeframe for the 4 boxes
Choose whether to plot the highs/lows of the larger timeframe candles as horizontal rays on your chart (along with the associated colors)

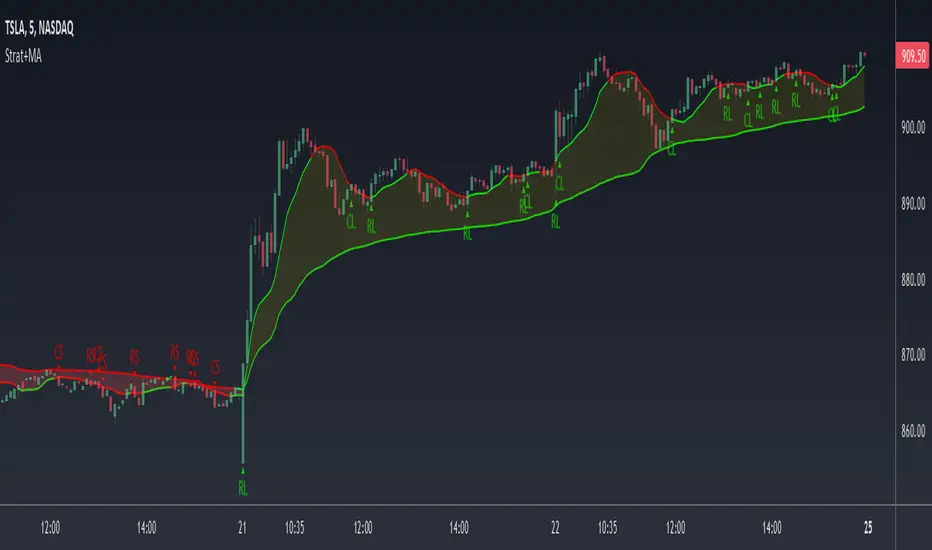
Strat+MA1= Inside Candle
2= One side, high or low of the previous candle is taken out
3= Engulfing Candle/Outside Candle. i.e. both sides of the previous candle are taken out
Enter any 2 moving averages.
Shows Strat setups(reversals/continuations) or when candles are above MA 1 and crosses MA 2
Choose between SMA, EMA or VWMA
Strat Setups: 22, 212, 312, etc.
RL = Reversal Long
CL = Continuation Long
RS = Reversal Short
CL = Continuation Short
L = Candle is above MA1 and has crossed above MA2
S = Candle is below MA1 and has crossed below MA2
Reversals Long(RL):
22 = last candle 2 down. current candle 2 up
212 = 3rd candle 2 down, last candle inside and current candle 2 up
312 = 3rd candle outside candle, last candle inside and current 2 up
Continuations Long(CL):
22 = last candle 2 up, current candle 2 up
212 = 3rd candle 2 up, last candle inside and current candle 2 up
312 = 3rd candle outside candle, last candle inside and current 2 up
Reversals Short(RS):
22 = last candle 2 up. current candle 2 down
212 = 3rd candle 2 up, last candle inside and current candle 2 down
312 = 3rd candle outside candle, last candle inside and current 2 down
Continuations ShortCS):
22 = last candle 2 down, current candle 2 down
212 = 3rd candle 2 down, last candle inside and current candle 2 down
312 = 3rd candle outside candle, last candle inside and current 2 down
You can choose to have the strat setups shown or just when the candles are above MA1 and cross MA2
When MA2 is above MA1, the fill is green and red when MA2 is below MA1
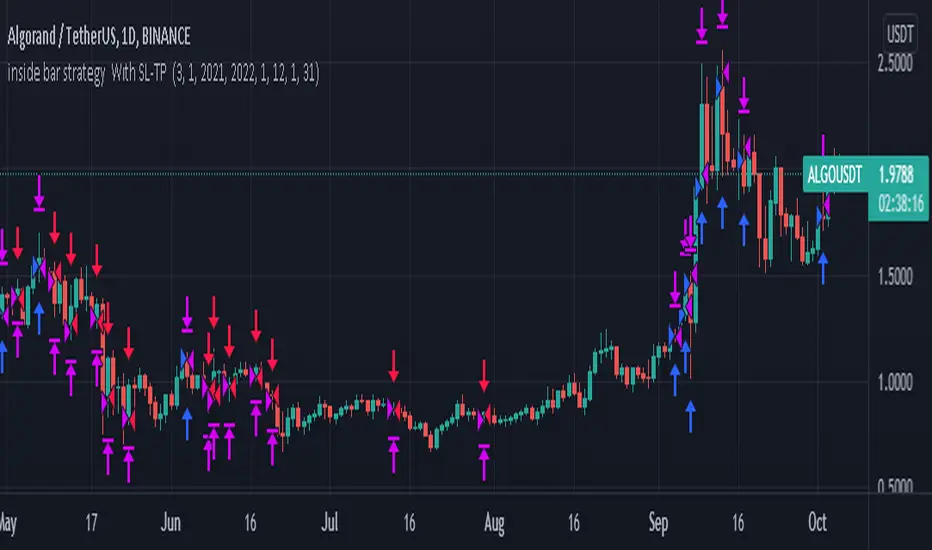
inside bar strategy Wıth SL-TP Based on strat bars to enter trades, you can use it with very low stop loss level and try all coins in daily frequency
TheStratFTFCBased on Rob Smith's TheStrat, indicates full time frame continuity
Will plot an indicator for all timeframes from 1 min up to 1 year with triangles to signify if the current price is above or below the open of that timeframe.
When all timeframes are above their respective opens, the FTFC will indicate a green up triangle
When all timeframes are below their respective opens, the FTFC will indicate a red down triangle
There are also indicators for Intraday, Swing, and Long Term FTFC
Intraday timeframes include 1 min to 1 hour
Swing timeframes include 1 hour to 1 month, on by default
Long Term time frames include 1 week to 1 year
There is an option to plot horizontal lines or show prices where the above 3 will become FTFC either red or green
Option to flip the order of the indicators and move them horizontally on the screen
On the settings > style tab, you can deselect timeframes you wish to hide
Limitations of script (due to pinescript):
Only the timeframes higher than or equal to the one shown on the chart will be included in the indicators. Pinescript does not allow indicators to use timeframes below the current chart's timeframe.
eg. the Intraday Timeframe FTFC indicator will show FTFC (green up triangle) if the chart is on the 1 hour timeframe and the close is above the hourly open EVEN IF the 15 minute price is below the 15 min open
- essentially, if you want to exclude timeframes, pick the lowest timeframe where you want the FTFC indicator to work
Any questions, let me know!
gkjch

Active Market FTFCIncludes most features of my original Strat Candles+Open Levels+Active FTFC indicator but this new addition is focused more for day traders.
Active Market FTFC allows you to add ONE broader average ticker (Indices, Sector or any other ticker you desire). When your stock and the selected ticker BOTH have Full Timeframe Continuity the Candle will light up.
In this example I have opened up $TSLA 15 minute chart. Once the Indicator has been applied I have entered $QQQ within my indicator settings and selected 15/30/60/D open levels with the Active FTFC function for 15/30/60/D.
Once TSLA's 15/30/60/D close price is more than the open price AND the QQQ broader average's 15/30/60/D close price is more than the open price the candle will change colour.
Please change your Active FTFC Candle Colours within the settings. I hope this indicator helps someone :)

The Strat info boxThis indicator is an all in one indicator for the "The strat" method by Rob Smith. This indicator DOES NOT provide trading advice or trade entry signals!
What is included:
* Candle Type 1 - Inside Candle
* Candle Type 2- Up or Down Candle
* Candle Type 3 - Engulfing Candle
* Strat signal:
- 2-1-2 setup
- 3-2-2 setup
* Full Timeframe Continuity:
- from a 5min timeframe to a yearly timeframe. Green gives you an uptrend, Red a downtrend.
* middle of day and week
- this give you a support and resistance level at the middle of the day or week. This is a good indicator if the stock goes up or down
* extra info like:
- ATR of 14 days
- DTR of current day
- Volume info
- Float info
NASDAQ:FB

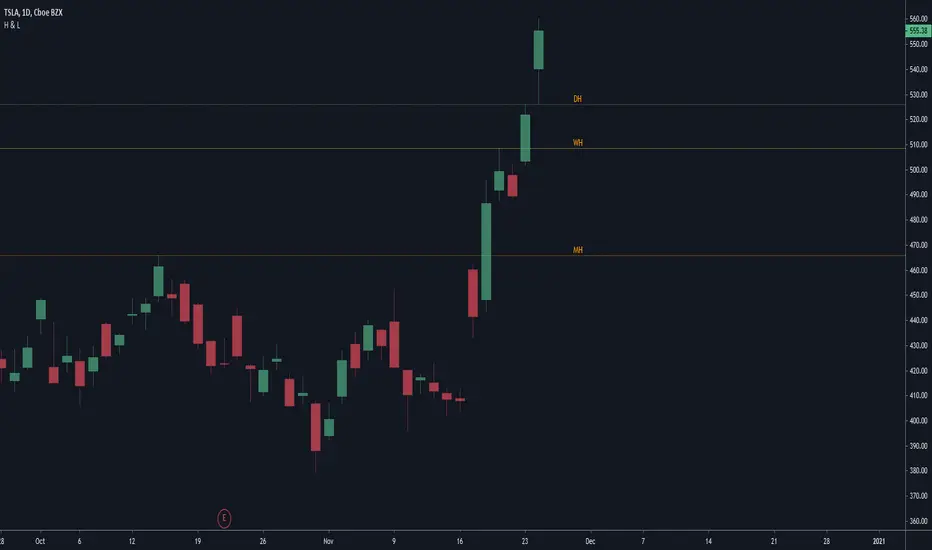
#TheStrat - Highs and Lows of Candles of 4 Custom Time framesThe bread and butter of strat traders is multi-timeframe analysis. We do MTFA in 2 different ways: 1) By Looking for entries confirmed by Full Timeframe Continuity which is just another way of saying that on multiple timeframes, the candles currently forming are all uniform in direction(ie. all red candles or all green candles), and 2) Looking for Strat reversal on lower timeframes that trigger your higher timeframes reversals.
This script is concerned with the latter piece of multi-timeframe analysis, and its application to the strat
Anyone who has watched Sara's videos teaching the strat can see how she uses the highs and lows of her major time periods, the monthly, weekly, and daily, to find entries from her lower time periods to trigger her higher timeframes. This script performs the process of marking the highs and lows of 4-major time periods automatically so that you do not need to mark every single chart you use manually. I have found this script to be very useful, and convenient. I hope that other stratters find it as useful as I am. Below outlines how to use this, although it is mostly self-explanatory. Special thanks and credit to millerrm, who I used his original code snippets to rework his original script to something more tailored to my personal use cases.
Settings -
You can change the time periods of the candles that you would like to mark to any time frame using the 4 dropdown boxes marked TF#
You can choose to toggle the lines for each given time period on and off, in the settings by checking off each time period.
The default colors are purple, blue, orange, and white, in order respective of time from shortest to highest
The default time periods are 3hr, 6hr, 12hr, and daily

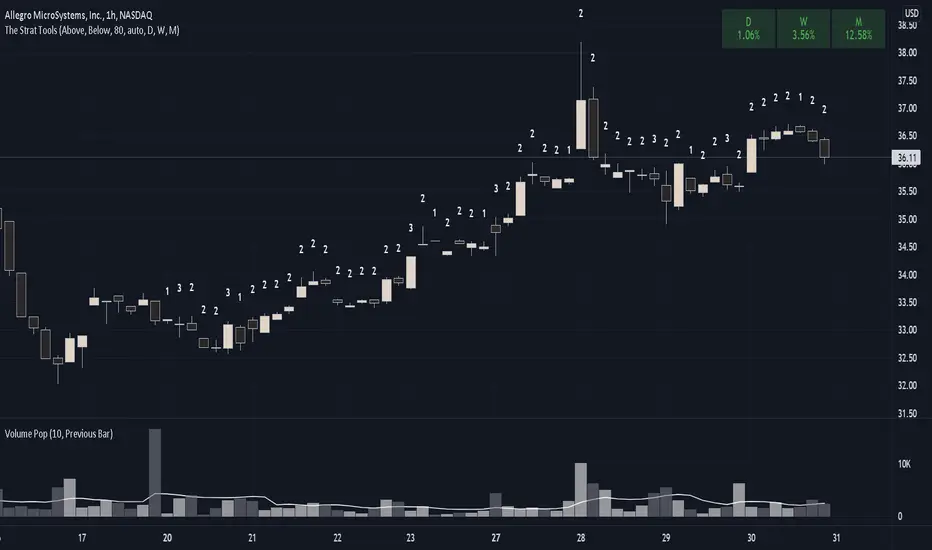
The Strat ToolsThis indicator will be collection of tools for using Rob Smith's The Strat.
Currently only bar numbers is implemented.
Every individual tool can be enabled or disabled and customized.
#TheStrat
RM StratThis is my attempt to code up the rules of "The Strat." I've seen other scripts that do parts of what my script does, but this script combines all of them into one script and allows the user control over how they interact with each other.
What's in this indicator?
Show the Strat Candle Numbers (1 - inside bar, 2 - continuation bar, 3 - outside bar) on the chart.
Show a widget off to the right of the chart for multi-timeframe analysis. This widget tells you whether the D/W/M/Q candles are currently green or red as well as the Candle type (White Circle - (1) Inside Bar, Up Green Arrow - (2U) Continuation Bar, Down Red Arrow - (2D) Continuation Bar, Green/Red Square - (3) Outside Bar)
Integrates the long and short rules into the chart. These can also be turned off if you don't want to see them. Note: this is a simplified version of these rules - if you look at the cheat sheets floating around the internet, you'll notice that all trade initiations occur on a break of the high (for longs) or low (for shorts) of the previous candle as long as that previous candle was not a 2. So that's my only rule for going long or short. I think it matches well with the cheat sheets but is way simpler to code and to think of how it works. The other benefit is it shows you failed trades that the cheat sheet won't catch - where a 2 becomes a 3 in the other direction and stops you out. You'll see that now with this script.
Ability to filter out the long/short rules based on the timeframe continuity of the higher timeframe candles. This is user-configurable so that you can experiment with timeframe continuity and see how strict you want to be with this on your trades.
Show the high/low of the Day, Week, and Month on your chart as horizontal lines that you can use as a reference. This could be used for planning profit targets or seeing how likely a reversal might indicate moving into timeframe continuity.

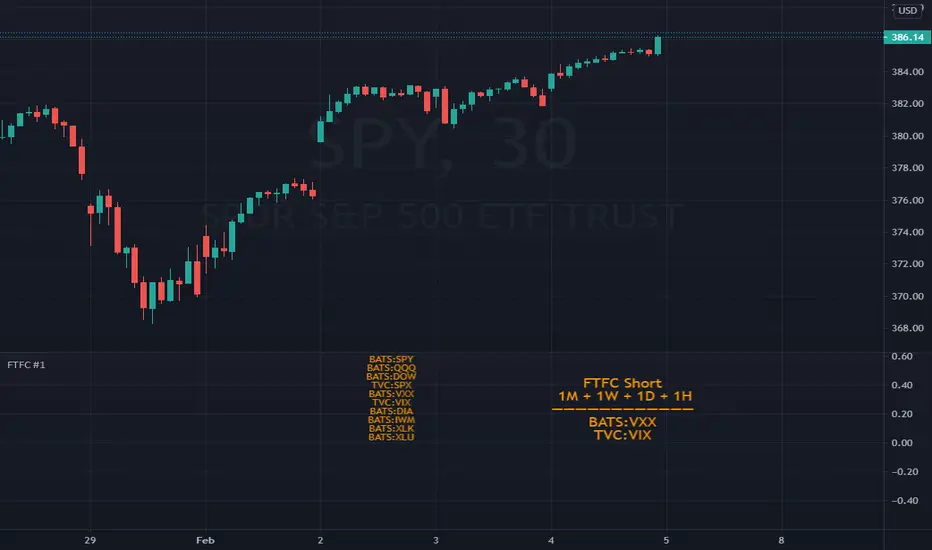
FTFC Scanner #1Full Time Frame Continuity Scanner
Scans for Monthly, Weekly, Daily and Hourly timeframes. There are multiple combinations available for these timeframes.
10 stocks in one indicator
Long FTFC = full time frame continuity to the long side. Meaning all the timeframes selected are green (going up)
Short FTFC = full time frame continuity to the short side. Meaning all the timeframes selected are red (going down)
The chart needs to be in 1 Hour or lower timeframe for the indicator to display correct results.
A trial is available. Please DM me for access.
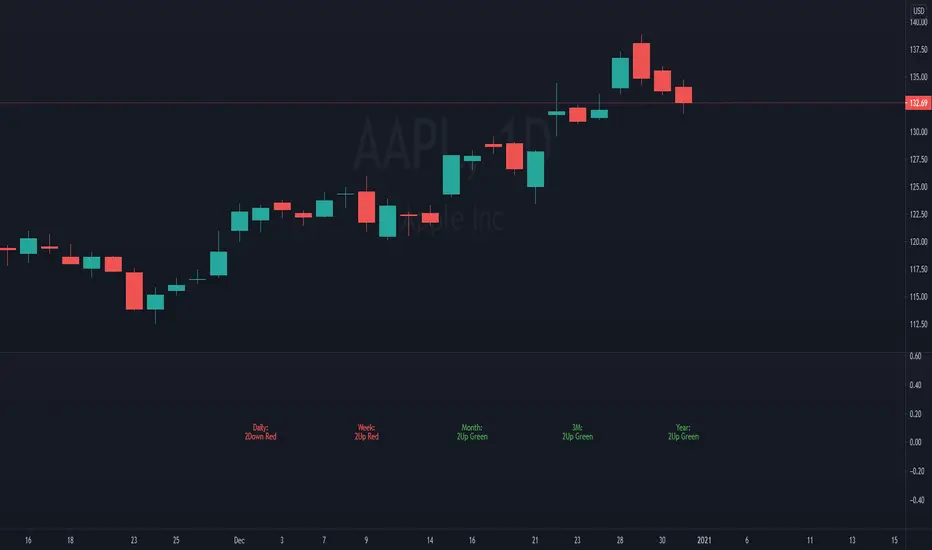
TFC - HTF1 = Inside Bar
2 = Breaks one side of the previous bar
3 = Breaks both sides of the previous bar
2up Green = Current bar breaks previous bar's high and it is a green bar
2up Red = Current bar breaks previous bar's high but it is a red bar
2Down Green = Current bar breaks previous bar's low but it is a green bar
2Down Red = Current bar breaks previous bar's low and it is a red bar
Inside Green = Current bar is an inside bar (1) and it is a green bar
Inside Red = Current bar is an inside bar (1) and it is a red bar
Outside Green = Current bar is an outside bar (3) and it is a green bar
Outside Red = Current bar is an outside bar (3) and it is red bar
Looking for above setups on Daily, Weekly, Monthly, 3Month, Year
Only higher timeframe data shows up
e.g. If the chart timeframe is 1D or less, all of the above timeframe analysis will appear
If the chart timeframe is 1Month, only 1M, 3M and Yearly analysis will show up
Please DM me for access
TFC - LTF1 = Inside Bar
2 = Breaks one side of the previous bar
3 = Breaks both sides of the previous bar
2up Green = Current bar breaks previous bar's high and it is a green bar
2up Red = Current bar breaks previous bar's high but it is a red bar
2Down Green = Current bar breaks previous bar's low but it is a green bar
2Down Red = Current bar breaks previous bar's low and it is a red bar
Inside Green = Current bar is an inside bar (1) and it is a green bar
Inside Red = Current bar is an inside bar (1) and it is a red bar
Outside Green = Current bar is an outside bar (3) and it is a green bar
Outside Red = Current bar is an outside bar (3) and it is red bar
Looking for above setups on 15 Minutes, 30 Minutes, 1 Hour, 2 Hour and 4 Hours
Only higher timeframe data shows up
e.g. If the chart timeframe is M15 or less, all of the above timeframe analysis will appear
If the chart timeframe is H1, only H1, H2 and H4 analysis will show up
Please DM me for access
TheStratHelper - Watchlist MakerEnter 13 symbols of your choice in the input tab. By default some symbols are already entered.
2 Up = Current bar higher than the previous bar.
2 Down = Current bar lower than the previous bar.
Scanning for 2 Up or 2 Down on monthly, weekly and daily timeframes.
2up In Force Only = If the current price is still above the last bar.
E.g. of how I use this..If a symbol is 2Up on Monthly, then I want to know if it's 2Up on Weekly. Then I can look for a trade opportunity on 1D.
If a symbol is 2up on monthly, weekly and daily, then I look for a trade opportunity on intraday timeframe.
IMPORTANT: Scans will show the correct results ONLY IF the chart timeframe is 1D or less.
Please DM me to find out how to get access.

Previous Highs & LowsPlots highs and lows for yesterday, last week and last month.
You can see all of them in the intraday tf. If weekly tf is selected, yesterday's daily high and low won't be plotted and if monthly tf is selected, weekly and daily highs and lows won't be plotted.
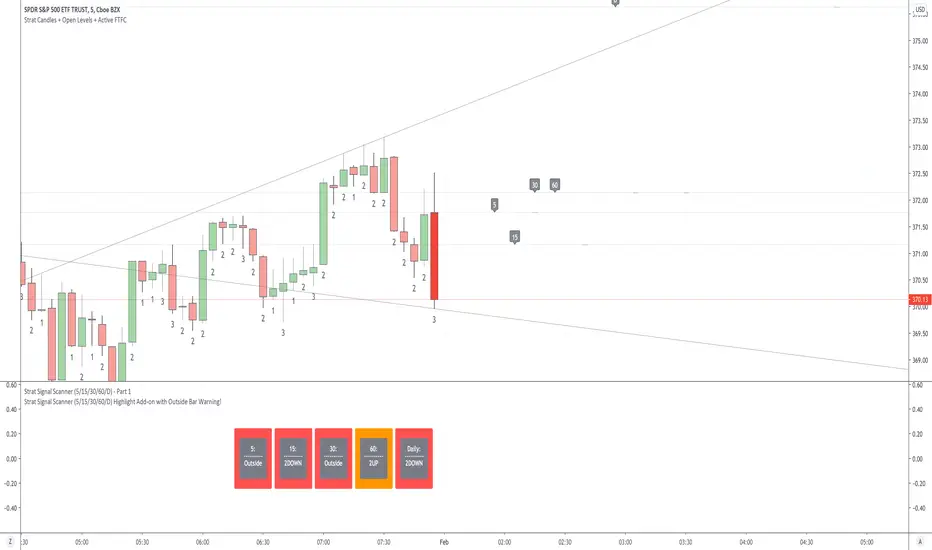
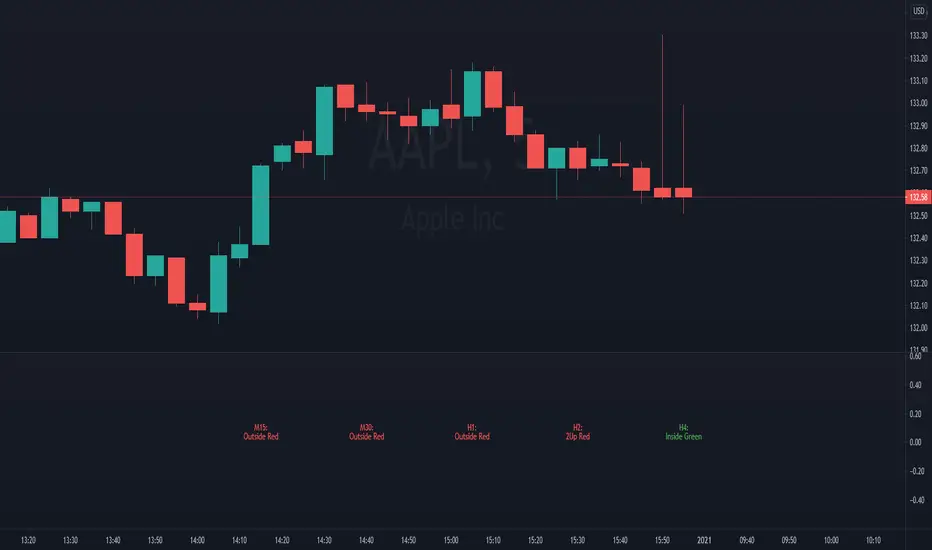
Strat Signal Scanner (5/15/30/60/D) Highlight Add-onStrat Signal Scanner (5/15/30/60/D) - Part 1 Highlight Add-on with Outside Bar Warning Indicator Info
Must be used with the “Strat Signal Scanner (5/15/30/60/D) - Part 1” Indicator only.
Two functions:
1. Add’s the current Candle color to each Timeframe box (Green or Red).
2. Possible Outside Bar Warning when a 2 Bar appears to be failing (Amber Box).
Amber Box - Outside Bar Warning Trigger Conditions:
- a 2UP Red Bar falls >60%* of previous candles range (High to Low).
- a 2DOWN Green Bar rises >60%* of previous candles range (Low to High).
*Customise previous candles range % within Indicator settings.
How to use:
- Add Indicator to chart
- click More (3 dots next to indicator settings)
- click Move - Exisiting pane above.
- Move the Highlight Indicator to line up with the Part 1 Indicator and make sure its in the background to prevent blocking the Part 1 indicator boxes.
- Open Highlight Indicator settings to adjust % if required.