Advanced Time TechniqueAdvanced Time Technique (ATT)
The Advanced Time Technique (ATT) identifies mathematically significant price levels based on candle count sequences within higher timeframes. The indicator tracks specific numerical patterns to project potential reversal zones.
Calculation Methodology:
- Monitors candle cycles in user-selected higher timeframes (1H, 2H, 3H)
- Identifies key candle counts: 3, 11, 17, 29, 41, 47, 53, 59
- Projects these counts as visual markers on the current chart
- Uses pure price action without lagging indicators
Key Features:
- HTF Candle Boxes: Displays higher timeframe candle ranges as colored boxes
- ATT Circles: Places circular markers at specified candle counts
- Multi-timeframe Analysis: References 1-hour, 2-hour, or 3-hour timeframes
- Prediction Labels: Shows upcoming ATT levels within user-defined range
- Historical Display: Optional viewing of past ATT markers
Visual Components:
- Colored boxes representing HTF candle ranges (bullish/bearish)
- Circle markers positioned above/below bars based on candle color
- Optional numerical display on ATT circles
- Customizable colors and transparency settings
Trading Applications:
- Identifies potential reversal zones at mathematically significant intervals
- Highlights liquidity concentration areas
- Useful for intraday and scalp trading strategies
- Complements price action and market structure analysis
The indicator works by counting candles within the selected higher timeframe and marking specific numerical sequences where price reactions commonly occur.
Timing

Gann Dynamic Levels [SmartFoxy]# 🌌 Gann Dynamic Levels
Gann Dynamic Levels is a dynamic Gann-based framework that calculates proportional and exponential levels using customizable methods — including planetary ratios.
Perfect for traders focused on cycles , ratios , and harmonic structures .
Inspired by the geometric and harmonic principles of W.D. Gann , this multifunctional tool automatically plots time–price projection levels based on user-defined anchor points.
It combines multiple calculation techniques to capture both linear and exponentia l market symmetries.
The indicator adapts dynamically to price movement, helping traders identify potential reversal zones , time clusters , and harmonic expansions derived from proportional and planetary relationships.
---
## ⚙️ Core Features
Five Calculation Methods — Linear, ratio-based, geometric, and exponential spacing for multi-perspective analysis.
Planetary Scaling Mode — Optional mode based on astronomical distances (Titius–Bode Law), adding an astronomical dimension to level spacing.
Adaptive Offset Control — Shifts all projected levels left or right proportionally without changing their internal spacing.
Automatic Label Management — Dynamically updates or reuses labels for better clarity and improved chart performance.
Custom Styling — Full control over colors, widths, label positions, and line styles for each method.
---
## 🌐 Purpose
Designed for traders who combine Gann theory , harmonic ratios , and cyclical timing to visualize equilibrium zones and future market symmetry.
Whether used for short-term timing or long-term structural projections, Gann Dynamic Levels provides an adaptive, geometry-based framework for interpreting market behavior.
---
## 📘 How to Use
When first applied, the indicator prompts you to place two points on the chart — for example, at the start and end of a significant price range.
The indicator calculates the number of bars between these two points, known as Delta .
Delta serves as the base unit for all calculations in Methods #1–#5 .
The computed results are displayed in Table 1 , which can be toggled using the parameter “📱 Show Gann Levels Table”.
You can reset or reposition the initial points in two ways:
Drag the existing points to new positions on the chart.
Hover over the indicator name, click ⦁⦁⦁ (More) → select “ Reset Points ”, then set new reference points.
---
## ⚙️ Method Logic
Classic – Evenly spaced levels based on the base Delta value. Ideal for identifying key support and resistance zones.
Coefficient (Coeff) – Scales Delta by fractional or whole-number coefficients for proportional level spacing.
Rounded – Rounds each calculated level to the nearest significant price value to align with major zones.
Subtractive – Generates levels by subtracting multiples of Delta from a reference point, emphasizing retracement-type structures.
Exponential – Applies an exponential growth model (10a = 4 + 3×2ⁿ) to project dynamic, non-linear level expansion.
Planetary – Uses the average distances of planets from the Sun (in Astronomical Units, AU ) as ratio multipliers to create harmonic projections.
Planetary distances can be customized in the user settings.
Data for Method #6 (Planetary) is displayed in Table 2 , toggled via “ 🪐 Show Planetary Table. ”
---
## ➡️ Additional Feature
Offset – Shifts all Gann levels horizontally (left or right) without changing their spacing.
Useful for visually aligning levels with key market structures.
---
### 🧭 Summary
A multi-method Gann framework combining geometric, harmonic, and planetary ratios for dynamic level projection and cycle analysis.

3CRGANG - SESSIONSOverview
The "3CRGANG - SESSIONS" indicator is a comprehensive tool for visualizing and monitoring major global trading sessions on TradingView charts. It highlights sessions for key exchanges—New York (NYSE), London (LSE), Frankfurt (FSE), Sydney (ASX), Tokyo (TSE), and Hong Kong (HKSE)—with customizable alerts, background coloring on low timeframes, and an interactive dashboard table. Designed for traders who operate across timezones or need session-based context, it accounts for holidays, half-days, and daylight saving time (DST) adjustments to provide accurate, real-time session status. On charts of 1-minute or lower, it overlays semi-transparent background colors to mark active sessions visually. Across all timeframes, a compact table at the bottom center displays session cells with dynamic coloring, and hovering over each reveals a tooltip with the weekly schedule, time until open/close, and holiday notes.
Built on Pine Script v6, this overlay indicator enhances situational awareness for forex, stocks, futures, and other assets by syncing with exchange-specific calendars. Its invite-only status ensures access to refined features that go beyond standard session tools, making it ideal for multi-market strategies.
How It's Built: Core Concepts and Calculations
The indicator leverages a modular approach to session detection, drawing from time-based logic for precision. Sessions are defined by fixed start/end times in their native timezones (e.g., NYSE: 0930-1600 America/New_York), adjusted dynamically for DST via timezone-aware functions. Key components include:
Session Activation Checks: Using helper functions like f_isSessionActive, it evaluates if the current bar or real-time timestamp falls within session hours, excluding weekends. Time is broken into minutes since midnight for comparisons, with special handling for overnight sessions (though none here cross midnight significantly).
Holiday and Half-Day Integration: Pre-loaded holiday maps for each exchange detect full closures or early closes (e.g., NYSE half-days end at custom times like 1300). If a half-day is identified, session end times are overridden, and pre-close periods recalculated (e.g., 30/5 minutes before adjusted close).
Pre-Open/Pre-Close Detection: Sub-sessions (e.g., 30 minutes before open) use similar logic to flag impending events, triggering only on the first bar of these windows via f_SessionOpen and f_SessionClose for efficiency.
Timestamp Calculations: Functions like f_SessionTimes and f_SessionTimesForTooltip compute open/close timestamps from timenow, adjusting for next trading day if after close or on weekends/holidays. This ensures forward-looking accuracy in tooltips.
Alert System: Configurable per-session, it fires notifications for pre-open (30/5 min), open, pre-close (30/5 min), close, and holidays. Alerts use alert.freq_once_per_bar to avoid spam, gated by market open status.
Visual Dashboard: A 6-column table is drawn with table.new, positioned via input (default bottom-center). Cells update colors based on state: active (session color at 75% opacity), pre-active (yellow), or inactive (gray). Tooltips via f_getSessionTooltip compile weekly schedules using f_formatScheduleEntry, which converts session times to user timezone, formats dates (DD/MM), weekdays (padded for alignment), and notes holidays/early closes. Time remaining uses f_formatTimeRemainingtooltip for human-readable countdowns (e.g., "1h:30m").
Background Coloring: On ≤1m timeframes, bgcolor applies session-specific hues (e.g., green for NYSE) at 90-95% transparency, configurable via light/dark themes.
User Customization: Inputs handle timezone (90+ options with DST), time format (standard/military, though not fully implemented in script), device (adjusts text padding/sizes), and theme (swaps colors for readability).
This setup combines timestamp arithmetic, conditional mapping, and array-based date iteration to create a robust, adaptive system that respects global market nuances without relying on simplistic built-in session strings.
Why It's Useful
Trading sessions drive liquidity, volatility, and price action—e.g., London open often sparks trends in forex, while NYSE influences equities. This indicator demystifies these by providing at-a-glance visuals and alerts, reducing the need for manual timezone conversions or external calendars. Background colors on low TFs help spot session overlaps (e.g., London/NY for high volume), while the table's tooltips offer quick weekly overviews, ideal for planning around holidays like Lunar New Year (HKSE-specific additions). Alerts prevent missing key events, and holiday detection avoids false expectations during closures.
For global traders, it minimizes errors in multi-asset setups; scalpers benefit from pre-open warnings, while swing traders use schedules for longer-term context. Its non-intrusive design (transparent on higher TFs) keeps charts clean, enhancing overall workflow efficiency.
How to Use It
Add to Chart: Access via invite-only on TradingView; apply to any timeframe, best on intraday for backgrounds or any for the dashboard.
Configure Inputs:
Time Settings: Select your timezone (e.g., UTC+3 Jerusalem) for accurate tooltip conversions; choose time format (standard preferred for readability).
Visualization Setup: Pick device (Desktop/Tablet/Mobile) for optimized text sizing/padding; select Light/Dark theme to match your chart.
Sessions Dashboard: Adjust table position if needed (default bottom-center).
Notifications Settings: Toggle alerts per exchange (e.g., enable NYSE for US focus).
Trading Application:
Visual Cues: On ≤1m charts, watch for color changes to enter/exit during active sessions. Hover table cells for schedules—current day highlighted, future/past separated, holidays marked (*).
Alerts: Set up in TradingView's alert manager for "alert() function calls only" to get notifications like "New York Session is about to Open in less than 5 minutes!"
Strategies: Use pre-open for setups (e.g., range breaks), closes for profit-taking. Combine with volume indicators during overlaps.
Best Practices: Test on demo; adjust alerts to avoid overload. For non-realtime, tooltips use current date for projections.
Why It's Unique and Worth Invite-Only Access
Unlike basic session highlighters that use rigid time strings or ignore holidays, this indicator integrates a custom holiday library with half-day adjustments and additional events (e.g., Buddha's Birthday for HKSE), ensuring precision across exchanges. Its tooltip system—generating timezone-converted weekly schedules with day adjustments, countdowns, and holiday notes—provides unmatched planning utility, while adaptive visuals (device/theme-aware) and granular alerts (pre-events included) elevate it beyond public tools. The logic for timestamp forward-projection, weekend skipping, and formatted entries builds on but significantly enhances built-in functions and educational examples.
This originality—protecting the proprietary blend of global calendar handling, alert gating, and interactive dashboards—justifies closed-source status. As invite-only, it delivers premium value through reliable, low-maintenance features that free traders from external apps, warranting access for those seeking an edge in session-based trading. Contact via TradingView for support.
Disclaimer
This indicator is a tool for analyzing market sessions and does not guarantee success. Trading involves risk, and past performance is not indicative of future results. Always use proper risk management.

Cyclic Reversal Engine [AlgoPoint]Overview
Most indicators focus on price and momentum, but they often ignore a critical third dimension: time. Markets move in rhythmic cycles of expansion and contraction, but these cycles are not fixed; they speed up in trending markets and slow down in choppy conditions.
The Cyclic Reversal Engine is an advanced analytical tool designed to decode this rhythm. Instead of relying on static, lagging formulas, this indicator learns from past market behavior to anticipate when the current trend is statistically likely to reach its exhaustion point, providing high-probability reversal signals.
It achieves this by combining a sophisticated time analysis with a robust price-action confirmation.
How It Works: The Core Logic
The indicator operates on a multi-stage process to identify potential turning points in the market.
1. Market Regime Analysis (The Brain): Before analyzing any cycles, the indicator first diagnoses the current "personality" of the market. Using a combination of the ADX, Choppiness Index, and RSI, it classifies the market into one of three primary regimes:
- Trending: Strong, directional movement.
- Ranging: Sideways, non-directional chop.
- Reversal: An over-extended state (overbought/oversold) where a turn is imminent.
2. Adaptive Cycle Learning (The "Machine Learning" Aspect): This is the indicator's smartest feature. It constantly analyzes past cycles by measuring the bar-count between significant swing highs and swing lows. Crucially, it learns the average cycle duration for each specific market regime. For example, it learns that "in a strong trending market, a new swing low tends to occur every 35 bars," while "in a ranging market, this extends to 60 bars."
3. The Countdown & Timing Signal: The indicator identifies the last major swing high or low and starts a bar-by-bar countdown. Based on the current market regime, it selects the appropriate learned cycle length from its memory. When the bar count approaches this adaptive target, the indicator determines that a reversal is "due" from a timing perspective.
4. Price Confirmation (The Trigger): A signal is never generated based on timing alone. Once the timing condition is met (the cycle is "due"), the indicator waits for a final price-action confirmation. The default confirmation is the RSI entering an extreme overbought or oversold zone, signaling momentum exhaustion. The signal is only triggered when Time + Price Confirmation align.
How to Use This Indicator
- The Dashboard: The panel in the bottom-right corner is your command center.
- Market Regime: Shows the current market personality analyzed by the engine.
- Adaptive Cycle / Bar Count: This is the core of the indicator. It shows the target cycle length for the current regime (e.g., 50) and the current bar count since the last swing point (e.g., 45). The background turns orange when the bar count enters the "due zone," indicating that you should be on high alert for a reversal.
- BUY/SELL Signals: A label appears on the chart only when the two primary conditions are met:
The timing is right (Bar Count has reached the Adaptive Cycle target).
The price confirms exhaustion (RSI is in an extreme zone).
A BUY signal suggests a downtrend cycle is likely complete, and a SELL signal suggests an uptrend cycle is likely complete.
Key Settings
- Pivot Lookback: Controls the sensitivity of the swing point detection. Higher values will identify more significant, longer-term cycles.
- Market Regime Engine: The ADX, Choppiness, and RSI settings can be fine-tuned to adjust how the indicator classifies the market's personality.
- Require Price Confirmation: You can toggle the RSI confirmation on or off. It is highly recommended to keep it enabled for higher-quality signals.

Sessions [New_ProfitEfex]This script is use for displaying session in a very attractive an clarity way
You can give it a try for free

NOMANOMA Adaptive Confidence Strategy —
What is NOMA?
NOMA is a next-generation, confidence-weighted trading strategy that fuses modern trend logic, multi-factor market structure, and adaptive risk controls—delivering a systematic edge across futures, stocks, forex, and crypto markets. Designed for precision, adaptability, and hands-off automation, NOMA provides actionable trade signals and real-time alerts so you never miss a high-conviction opportunity.
Key Benefits & Why Use NOMA?
Trade With Confidence, Not Guesswork:
NOMA combines over 11 institutional-grade confirmations (market structure, order flow, volatility, liquidity, SMC/ICT concepts, and more) into a single “confidence score” engine. Every trade entry is filtered through customizable booster weights, so only the strongest opportunities trigger.
Built-In Alerts:
Get instant notifications on all entries, take-profits, trailing stop events, and exits. Connect alerts to your mobile, email, or webhook for seamless automation or just peace of mind.
Advanced Position Management:
Supports up to 5 separate take-profit levels with adjustable quantities, plus dynamic and stepwise trailing stops. Protects your gains and adapts exit logic to market movement, not just static targets.
Anti-Chop/No Trade Zones:
Eliminate low-probability, sideways market conditions using the “No Chop Zone” filter, so you only trade in meaningful, trending environments.
Full Market Session Control:
Restrict trades to custom sessions (e.g., New York hours) for added discipline and to avoid overnight risk.
— Ideal for day traders and prop-firm requirements.
Multi-Asset & Timeframe Support:
Whether you trade micro futures, stocks, forex, or crypto, NOMA adapts its TP/SL logic to ticks, pips, or points and works on any timeframe.
How NOMA Works (Feature Breakdown)
1. Adaptive Trend Engine
Uses a custom NOMA line that blends classic moving averages with dynamic momentum and a proprietary “Confidence Momentum Oscillator” overlay.
Visual trend overlay and color fill for easy chart reading.
2. Multi-Factor Confidence Scoring
Each trade is scored on up to 11 confidence “boosters,” including:
Market Manipulation & Accumulation (detects smart money traps and true range expansions)
Accumulation/Distribution (AD line)
ATR Volatility Rank (prioritizes trades when volatility is “just right”)
COG Cross (center of gravity reversal points)
Change of Character/Break of Structure (CHoCH/BOS logic, SMC/ICT style)
Order Blocks, Breakers, FVGs, Inducements, OTE (Optimal Trade Entry) Zones
You control the minimum score required for a trade to trigger, plus the weight of each factor (customize for your asset or style).
3. Smart Trade Management
Step Take-Profits:
Up to 5 profit targets, each with individual contract/quantity splits.
Step Trailing Stop:
Trail your stop with a ratcheting logic that tightens after each TP is hit, or use a fully dynamic ATR-based trail for volatile markets.
Kill-Switch:
Instant trailing stop logic closes all open contracts if price reverses sharply.
4. Session Filter & Cooldown Logic
Restricts trading to key sessions (e.g., NY open) to avoid low-liquidity or dead zones.
Cooldown bars prevent “overtrading” or rapid re-entries after an exit.
5. Chop Zone Filter
Optionally blocks trades during flat/choppy periods using a custom “NOMA spread” calculation.
When enabled, background color highlights no-trade periods for clarity.
6. Real-Time Alerts
Receive alerts for:
Trade entries (long & short, with confidence score)
Every take-profit target hit
Trailing stop exits or full position closes
Easy setup: Create alerts for all conditions and get notified instantly.
Customization & Inputs
TP/SL Modes: Choose between manual, ATR-multiplied, or hybrid take-profit and trailing logic.
Position Sizing: Fixed contracts/quantity per trade, with customizable splits for scaling out.
Session Settings: Restrict to any time window.
Confidence Engine: User-controlled weights and minimum score—tailor for your asset.
Risk & Volatility Filters: ATR length/multiplier, min/max range, and more.
How To Use
Add NOMA to your chart.
Customize your settings (session, TPs, confidence scores, etc.).
Set up TradingView alerts (“Any Alert() function call”) to receive notifications.
Monitor trade entries, profit targets, and stops directly on your chart or in your inbox.
Adjust confidence weights as you optimize for your favorite asset.
Pro Tips
Start with default settings—they are optimized for NQ micro futures, 15m timeframe.
Increase the minimum confidence score or weights for stricter filtering in volatile or low-liquidity markets.
Adjust your take-profit and trailing stop settings to match your trading style (scalping vs. swing).
Enable “No Chop Zone” during sideways conditions for cleaner signals.
Test in strategy mode before trading live to dial in your risk and settings.
Disclaimer
This script is for educational and research purposes only. No trading system guarantees future results.
Performance will vary by symbol, timeframe, and market regime—always test settings and use at your own risk. Not investment advice.
If alerts or strategy entries are not triggering as expected, try lowering the minimum confidence score or disabling certain boosters.
This will come with a user manual please do not hesitate to message me to gain access. TO THE MOON AND BEYOND

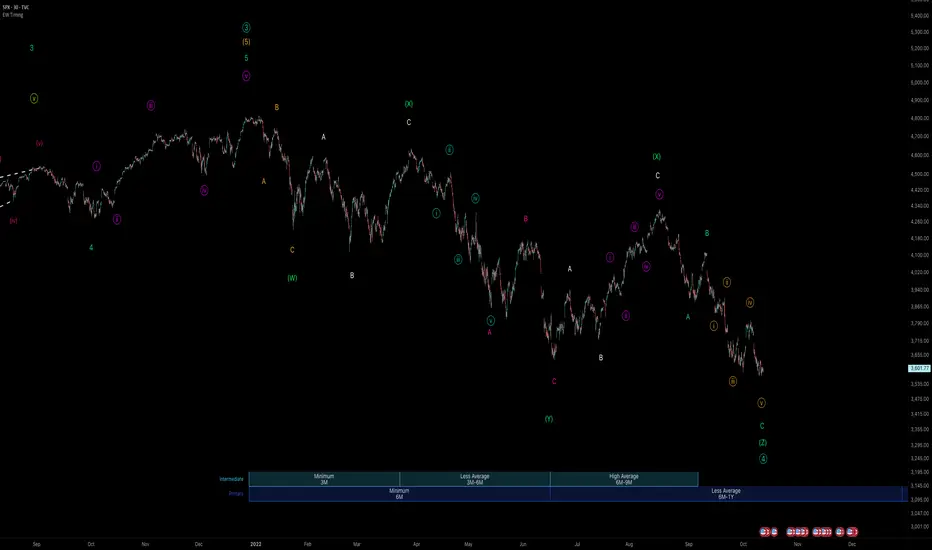
zSph x Larry Waves Wave Degree TimingElliott Waves are fractal structures governed by time. The categorization of time in relation to Elliott Wave is named ‘Wave Degree’.
All waves are characterized by relative size called degree. The degree of a wave is determined by its size and position relative to lesser waves (smaller time and size), corresponding waves (similar time and size) and encompassing waves (greater time and size).
Elliott named 9 degrees (Supercycle – Subminuette).
Elliott also stated the Subminuette degree is discernable on the HOURLY chart.
# Concept
BINANCE:BTCUSDT
Degree is governed by Time yet it is not based upon time lengths (or price lengths), rather it is based on form and structure – a function of both price and time.
The precise degree may not be identified in real time, yet the objective is to be within +/- 1 standard deviation of the expected degree to be aware of the overall market progression.
Understanding degree helps in the identification of when an impulse or a correction is nearing completion and to be aware of the major pivot in price action to occur as a result of the completion of a major expansion or major retracement and be aware of when major pivots in price relating to major expansions and major retracements by managing expectations from a time perspective.
*Important to understand* : If price is currently in a Wave Degree Extension or a Very Complex Correction, the wave degree timings will be distorted (extended in time).
Example: A Cycle typically lasts a few years - yet can last a decade(s) in an Extension.
It’s best to keep the analysis on the Minute/Minuette timeframe to manage timing expectations yet always refer back to the Higher Time Frame Structure.***
# Correct Usage
BEFORE PLACING THE ANCHOR TO DISPLAY ZONES:
Completion of prior wave structure should be completed and there needs to be confirmation the next wave structure is in progression, such as a change in market structure.
Anchor :
Best to anchor on the higher time frame to ensure you always have the anchor point defined when you scale down/move down in the timeframes.
Ensure the anchor point is placed at the termination of a structure/beginning of a new structure (Generally they will be price extremes – extreme highs and lows)
Zones :
Minimum Zones : The minimum amount of time of completion for a single wave structure to complete for a degree.
Average Zones : The average amount of time of completion for a single wave structure to complete for a degree.
Maximum Zones : The general maximum amount of time of completion for a single wave structure to complete for a degree.
Wave Degree Timeframe Analysis :
Higher-Level Degrees (Primary, Intermediate, Minor) - Utilize on H4+ timeframe
Lower-Level Degrees (Minute, Minuette, Subminuette) – Utilize on 15M to H4 timeframe
Micro-Level Degrees (Micro and Submicro) – Utilize on timeframes less than 15M
(There is a chart in the settings you can toggle on/off that reiterates this as well.)
# Settings
Y-Axis Offset :
It is a scale relative to the asset being viewed. Example:
- If using on Bitcoin, Bitcoin moves on average $1,000 of dollars up or down (on the Y-Axis), therefore it would be relevant to use values with 4 nominal values to offset it correctly to view easier on the chart as needed.
- If using on SP500, SP500 moves on average $50-100 of dollars up or down (on the Y-Axis), therefore it would be relevant to use values with 2 or 3 nominal values to offset it correctly to view easier on the chart as needed.
Extend :
This option allows to extend lines for the borders of the zones towards price action.
F&O Time Zones – Final Fixed📌 This indicator highlights high-probability intraday time zones used in Indian F&O (Futures & Options) strategies. Ideal for scalping, breakout setups, and trap avoidance.
🕒 Covered Time Zones:
• 9:15 – 9:21 AM → Flash Trades (first 1-minute volatility)
• 9:21 – 9:30 AM → Smart Money Trap (VWAP fakeouts)
• 9:30 – 9:50 AM → Fake Breakout Zone
• 9:50 – 10:15 AM → Institutional Entry Timing
• 10:15 – 10:45 AM → VWAP Range Scalps
• 10:45 – 11:15 AM → Second Trap Zone
• 11:15 – 1:00 PM → Trend Continuation Window
• 1:00 – 1:45 PM → Volatility Compression
• 1:45 – 2:15 PM → Institutional Exit Phase 1
• 2:15 – 2:45 PM → Trend Acceleration / Reversals
• 2:45 – 3:15 PM → Expiry Scalping Zone
• 3:15 – 3:30 PM → Dead Zone (square-off time)
🔧 Features:
✓ Clean vertical lines per zone
✓ Optional label positions (top or bottom)
✓ Adjustable line style, width, and color
🧠 Best used on: NIFTY, BANKNIFTY, FINNIFTY (5-min or lower)
---
🔒 **Disclaimer**:
This script is for **educational purposes only**. It is not financial advice. Trading involves risk. Please consult a professional or do your own research before taking any positions.
—
👤 Script by: **JoanJagan**
🛠️ Built in Pine Script v5

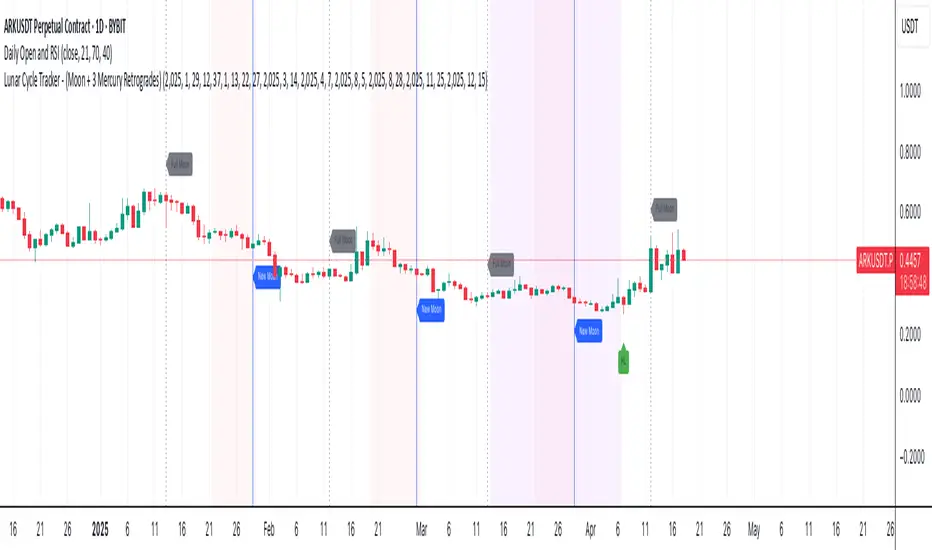
Lunar Cycle Tracker - (Moon + 3 Mercury Retrogrades)This script overlays the lunar and Mercury retrograde cycles directly onto your chart, helping traders visualize natural timing intervals that may influence market behavior.
Key Features:
🌑 New Moon & Full Moon Markers:
Vertical lines and labels indicate new and full moon events each month. You can fully customize their colors.
🌗 Last Quarter Moon Fill:
A soft pink background highlights the last quarter moon phase (from 7.4 days after the full moon to the next new moon).
🪐 Three Mercury Retrograde Zones:
Highlight up to three retrograde periods per year with customizable date inputs and background color. Great for spotting potential reversal or volatility windows.
Customization:
Moon event dates and colors
Manual input for Mercury retrograde periods (year, month, day)
Full compatibility with all timeframes (1H, 4H, daily, etc.)
Great for astro-cycle traders, Gann-based analysts, or anyone who respects time symmetry in the markets.
Fully customizable & works across all timeframes.
This tool was created by AngelArt as part of a larger astro-market model using lunar timing and planetary retrogrades for cycle-based market analysis.
LIT - ConfirmationsOverview
The LIT - Confirmations Indicator is a dynamic checklist tool designed for traders who uses LIT Strategy (Liquidity Inducement Theory) following liquidity and smart money concepts as benefit. This tool allows users to document and track essential trading confirmations directly on their TradingView charts, offering a structured and visual approach to market analysis.
What Makes This Unique?
Unlike other open-source tools, the LIT - Confirmations Indicator introduces a fully interactive and customizable table directly on the chart. This table provides real-time feedback with clear ✅ (checked) and ❌ (unchecked) visual indicators for each confirmation. The user can position the table on the chart according to their preference, ensuring it integrates seamlessly into their trading workflow without obscuring critical chart data.
How It Works
1. Predefined Confirmations
The indicator includes a set of commonly used trading confirmations:
Identify Liquidity: Mark areas where liquidity might pool.
Inducement: Confirm the presence of inducements before market reversals.
Relevant Break of Structure (BOS): Validate critical structural changes.
Mitigation after RBoS: Check for mitigation following a BOS.
Smart Money Trap (SMT): Identify traps often utilized by smart money.
Timing: Ensure trades are entered during high-probability time windows.
Mitigation to the Leftside: Confirm whether price action aligns with prior mitigations.
Set Targets: Define and document logical take-profit or stop-loss levels.
2.Interactive Table Display
A table is dynamically created on the chart, showing all confirmations with their current state (checked or unchecked).
Users can choose the position of the table (top, middle, or bottom and left, center, or right) and customize its background color for better visibility.
3. Customization
All confirmations are toggled through the input settings, allowing traders to adapt the indicator to their unique strategies.
The display can be easily adjusted to match the trader’s preferences without cluttering the chart.
How to Use
1. Add the indicator to your chart.
2. Open the settings panel to activate the relevant confirmations for your analysis.
3. Use the Display Settings section to adjust the table's position and background color.
4. View the table on your chart to track selected confirmations in real-time.
Who Is This For?
This indicator is ideal for traders who:
Use Liquidity Inducent Theory strategy in their analysis.
Prefer a structured and systematic trading approach.
Need an on-chart tool to document confirmations without relying on external notes or tools.
Why Closed Source?
The logic behind the interactive table and confirmation system is specifically tailored to LIT practitioners and is not publicly available in existing open-source scripts. The closed-source nature of this script protects its unique implementation, ensuring the integrity and exclusivity of the tool.
Disclaimer
This indicator does not provide trading signals or strategies. It is a tool to document user-defined confirmations and should be used in conjunction with a thorough understanding of market behavior and risk management practices.

Customizable Vertical LinesCustomizable Vertical Lines (CVL) Indicator
Version 2.0 (November 2023)
Description:
The Customizable Vertical Lines (CVL) indicator is a powerful tool for traders who want to mark specific times on their charts with vertical lines. This indicator allows users to customize the appearance of these lines, including their color, line style, and width, providing a flexible and visually intuitive way to highlight key time points.
Key Features:
User-Friendly Inputs: Easily set up to five distinct times, each associated with a unique color for the vertical lines.
Color Customization: Choose from a wide range of colors for each vertical line, allowing for clear differentiation.
Line Style Options: Tailor the appearance of the lines with three selectable styles: solid, dotted, or dashed.
Adjustable Line Width: Modify the thickness of the lines to suit your preferred visual style.
Timezone Offset: Account for different time zones by adjusting the timezone offset parameter.
How to Use:
Simply input the desired times, colors, and other parameters in the script settings. The CVL indicator will then automatically plot vertical lines at the specified times on the chart with the chosen customization.
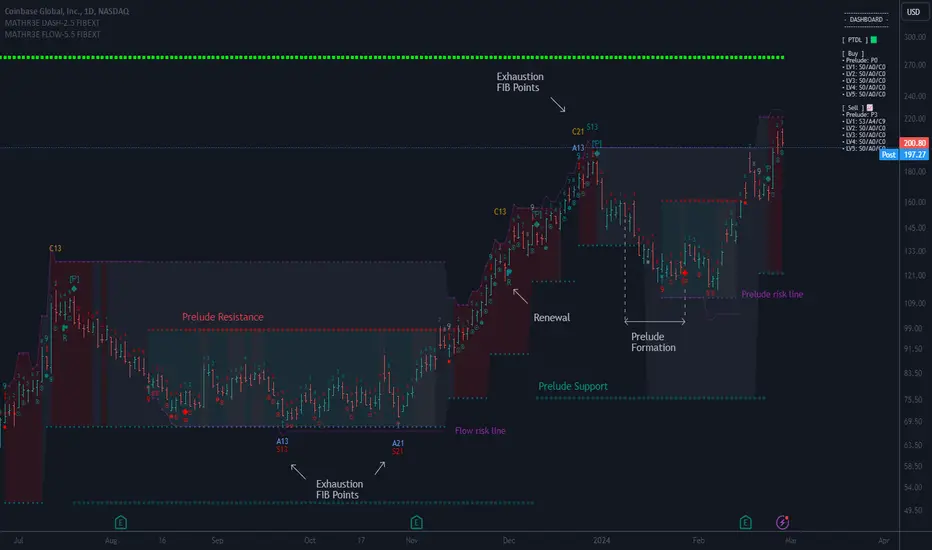
MATHR3E FLOW EXTENSION DASHBOARD█ OVERVIEW
MATHR3E Flow Extension Dashboard is a market timing tool which aims to anticipate trend reversals and highlight potential low risk entries.
█ CONCEPTS
Disclaimer:
MATHR3E Flow Extension Dashboard indicator is intended for advanced traders and may fit your profile, whether you are a day trader or a long-term investor.
It was originally developed by a renowned market analyst and documented in numerous books. Among them is the author Jason Perl.
It is recommended to have read the trading techniques mentioned in the books covering this indicator beforehand.
How to use:
Fibonacci Flow is a very complex tool, the purpose is not to detail it here but rather to introduce it briefly.
For a complete understanding, it is strongly recommended to read the books mentioned in the disclaimer section.
This indicator has two main components:
1 — The Prelude, which relies on momentum to define price ranges.
From a Price Reversal there must be nine consecutive closes;
Each one less/greater than the corresponding close four bars earlier.
Preludes are numbered from 1 to 9. A complete Prelude occurs on bar 9.
It can be: Sharpened / Flawed / Ignored / Extended / Over-Extended / Renewed
Cross over parameter can also evaluate the slowdown in a price trend's intensity and qualify the inception of Flow
2 — The Flow, which comes into play once the Prelude is complete.
They are trend based, and look for low-risk opportunities to fade established directional moves.
Flows are counts numbered from 1 to 13. There are 3 of them:
• SEQ: compares the current close with the low/high two bars earlier
• AGG: compares the current low/high with the low/high two bars earlier
• CMB: complex set of comparison with 2 available methods (not detailed here)
To handle the large amount of data to be displayed, they have been distributed over two indicators.
This indicator therefore works in pair with its companion: MATHR3E Flow Extension.
The distribution of the display is as follows:
Current indicator:
• Prelude points
• Markers for sharpened/flawed/valid/invalid completed preludes.
• Markers for Nested preludes (with brackets)
• Markers for Extension preludes (E)
• Markers for Over Extension preludes (O)
• Markers for Renewed preludes (R)
• Prelude Risk lines
• Flow Risk lines
• Prelude Trend Support and resistance
• Dashboard for supervision of ongoing counts
Companion indicator:
• Flow points
• Markers for Flows cancelation (X)
• Markers for Nested Exhaustion points (with brackets)
• Exhaustions points for:
• SEQ: 13 up to 55 (Identify trend fading)
• AGG: 13 up to 55 (For higher trading frequency)
• CMB: 13 up to 34 (Identify prospective turning points following an abrupt price movement)
█ FEATURES & BENEFITS
Fibonacci Sequence
The number 13 is part of the Fibonacci sequence which is nature’s numbering system.
Even if a Prelude Renewal is not triggered, a trend may extend beyond Fibonacci number 13.
MATHR3E Flow Extension can unveil the next exhaustion points based on this same Fibonacci sequence (21, 34, 55) while respecting the logic of the Flow.
Exhaustion points
Potential exhaustion points emerge whenever the individual flows reach Fibonacci numbers.
These points may help traders to identify low-risk buy or sell opportunities.
Risk Lines
Once the trader has selected an entry point, the displayed risk lines should encourage the trader to remain disciplined and apply proper money management.
Position sizing remains the responsibility of the trader.
Available risk lines:
• buy/sell Preludes
• buy/sell Flows
Nested Flows
The indicator can track up to five nested Flows.
Nested exhaustion points will have markups brackets.
Renewing
During the path to reach point number 13, it is very common to trigger other Prelude in the same direction as the previously initiated trend.
MATHR3E Flow Extension will address these potential market renewals with multiples options:
• Prelude range qualifiers
• Renewal Multiplier
• Renewal Method (Before/On/After, Before/On, Only Before, After/On, Only After, Ignore All)
Dashboard:
The dashboard makes it easier to monitor multiple buy and sell signals at the same time:
• Prelude: (P from 1 to 9) / Compares the current close with the corresponding close four bars earlier
• SEQ: (S from 1 to 55) / Compares the current close with the low/high two bars earlier
• AGG: (A from 1 to 55) / Compares the current low/high with the low/high two bars earlier
• CMB: (C from 1 to 34) / Requires four conditions to be satisfied simultaneously
Dashboard also provides the possibility to monitor up to 5 levels of flows
Alerts
The indicator also provides programmable alerts whose format can be adapted to be received on Discord servers
Configure your alerts and get notified on:
• Trend changes
• BUY or SELL P9
• BUY or SELL S13 to S55
• BUY or SELL A13 to A55
• BUY or SELL C13 to C34

MATHR3E FLOW EXTENSION█ OVERVIEW
MATHR3E Flow Extension is a market timing tool which aims to anticipate trend reversals and highlight potential low risk entries.
█ CONCEPTS
Disclaimer:
MATHR3E Flow indicator is intended for advanced traders and may fit your profile, whether you are a day trader or a long-term investor.
It was originally developed by a renowned market analyst and documented in numerous books. Among them is the author Jason Perl.
It is recommended to have read the trading techniques mentioned in the books covering this indicator beforehand.
How to use:
Fibonacci Flow is a very complex tool, the purpose is not to detail it here but rather to introduce it briefly.
For a complete understanding, it is strongly recommended to read the books mentioned in the disclaimer section.
This indicator has two main components:
1 — The Prelude, which relies on momentum to define price ranges.
From a Price Reversal there must be nine consecutive closes;
Each one less/greater than the corresponding close four bars earlier.
Preludes are numbered from 1 to 9. A complete Prelude occurs on bar 9.
It can be: Sharpened / Flawed / Ignored / Extended / Over-Extended / Renewed
Cross over parameter can also evaluate the slowdown in a price trend's intensity and qualify the inception of Flow
2 — The Flow, which comes into play once the Prelude is complete.
They are trend based, and look for low-risk opportunities to fade established directional moves.
Flows are counts numbered from 1 to 13. There are 3 of them:
• SEQ: compares the current close with the low/high two bars earlier
• AGG: compares the current low/high with the low/high two bars earlier
• CMB: complex set of comparison with 2 available methods (not detailed here)
To handle the large amount of data to be displayed, they have been distributed over two indicators.
This indicator therefore works in pair with its companion: MATHR3E Flow Extension Dashboard.
The distribution of the display is as follows:
Current indicator:
• Flow points
• Markers for Flows cancelation (X)
• Markers for Nested Exhaustion points (with brackets)
• Exhaustions points for:
• SEQ: 13 up to 55 (Identify trend fading)
• AGG: 13 up to 55 (For higher trading frequency)
• CMB: 13 up to 34 (Identify prospective turning points following an abrupt price movement)
Companion indicator:
• Prelude points
• Markers for Sharpened/flawed/valid/invalid completed preludes.
• Markers for Nested preludes (with brackets)
• Markers for Extension preludes (E)
• Markers for Over Extension preludes (O)
• Markers for Renewed preludes (R)
• Prelude Risk lines
• Flow Risk lines
• Prelude Trend Support and resistance
• Dashboard for supervision of ongoing counts
█ FEATURES & BENEFITS
Fibonacci Sequence
The number 13 is part of the Fibonacci sequence which is nature’s numbering system.
Even if a Prelude Renewal is not triggered, a trend may extend beyond Fibonacci number 13.
MATHR3E Flow Extension can unveil the next exhaustion points based on this same Fibonacci sequence (21, 34, 55) while respecting the logic of the Flow.
Exhaustion points
Potential exhaustion points emerge whenever the individual flows reach Fibonacci numbers.
These points may help traders to identify low-risk buy or sell opportunities.
Risk Lines
Once the trader has selected an entry point, the displayed risk lines should encourage the trader to remain disciplined and apply proper money management.
Position sizing remains the responsibility of the trader.
Available risk lines:
• buy/sell Preludes
• buy/sell Flows
Nested Flows
The indicator can track up to five nested Flows.
Nested exhaustion points will have markups brackets.
Renewing
During the path to reach point number 13, it is very common to trigger other Prelude in the same direction as the previously initiated trend.
MATHR3E Flow Extension will address these potential market renewals with multiples options:
• Prelude range qualifiers
• Renewal Multiplier
• Renewal Method (Before/On/After, Before/On, Only Before, After/On, Only After, Ignore All)
Alerts
Its Companion indicator also provides programmable alerts whose format can be adapted to be received on Discord servers
Configure your alerts and get notified on:
• Trend changes
• BUY or SELL P9
• BUY or SELL S13 to S55
• BUY or SELL A13 to A55
• BUY or SELL C13 to C34
Consolidation Breakout [Indian Market Timing]OK let's get started ,
A Day Trading (Intraday) Consolidation Breakout Indication Strategy that explains time condition for Indian Markets .
The commission is also included in the strategy .
The basic idea is ,
1) Price crosses above upper band , indicated by a color change (green) is the Long condition .
2) Price crosses below lower band , indicated by a color change (red) is the Short condition .
3) ATR is used for trailing after entry
// ═══════════════════════════════//
// ————————> TIME CONDITION <————————— //
// ═══════════════════════════════//
The Indian Markets open at 9:15am and closes at 3:30pm.
The time_condition specifies the time at which Entries should happen .
"Close All" function closes all the trades at 2:57pm.
All open trades get closed at 2:57pm , because some brokers dont allow you to place fresh intraday orders after 3pm.
NSE:NIFTY1!
// ═══════════════════════════════════════════════ //
// ————————> BACKTEST RESULTS ( 114 CLOSED TRADES )<————————— //
// ═══════════════════════════════════════════════ //
LENGTH , MULT (factor) and ATR can be changed for better backtest results.
The strategy applied to NIFTY (3 min Time-Frame and contract size 5) gives us 60% profitability , as shown below
It was tested for a period a 8 months with a Profit Factor of 2.2 , avg Trade of 6000Rs profit and Sharpe Ratio : 0.67
The graph has a Linear Curve with consistent profits.
NSE:NIFTY1!
Save it favorites.
Apply it to your charts Now !!
Thank me later ;)

Fibonacci Timing PatternThe Fibonacci Timing Pattern is a price-based counter that seeks to determine short-term and medium-term reversals in price action. It is based on the following set of conditions:
* For a bullish Fibonacci timing signal: The market must shape 8 consecutive close prices where each close price is lower than the close prices from 3 and 5 periods ago.
* For a bearish Fibonacci timing signal: The market must shape 8 consecutive close prices where each close price is higher than the close prices from 3 and 5 periods ago.
The signals of the pattern are ideally used in a sideways market or used in tandem with the trend (bullish signals are taken in a bullish market and bearish signals are taken in a bearish market).

Phantom - My Session RangeThis is a modification of a script by RobMinty, "FXN - Asian Session Range" The script provides functionality to track specific trading sessions based on user preference rather than just the market sessions open and close. The idea is to help you hold yourself accountable to your specific trading times as well as backtest various marketing timings suitable to your schedule.
This script utilizes RobMinty's pine code to visualize your market session. We have adjusted the script to project the end of the session before the candles print - as well as adding/subtracting the horizontal and/or vertical lines around the current session box. This should help you understand how much time you have left in your session with a quick visual representation. While we have made some additions and adjustments to RobMinty's script- The inputs and functions of the combined script have not changed significantly from the originals. Like the originals, the code has been made open-source. If this script is reused or modified, please provide credit to RobMinty. If you plan to use this specific code with the ability to remove lines from the box and project session end forward, please credit both of us.
First day o month, year and weekendsThis is just a simple study to visualize and analyze seasonality based on months, weeks, and years.

Gann Seasonal Dates V1.1Gann Seasonal Dates
// ========================================================================//
This script helps you spot important events in the market using Gann seasonal dates and cycles
This script inludes 4 major seasonal dates and 6 minor seasonal dates. All of which are very powerful if you are a time trader.
This script also complements the Gann ToolBox that I have on my tradingview page giving you good measurement of the market and some of its volatility dates.
// ========================================================================//
To get access to this add-on or for the full package including the toolbox you can see my information below.

ALT_FLAMES00.00 - alt-flames
component breakdown:
a) various combinations of EMA crossovers taken from the primeval_series to create a complete sequence of background colored-lines that subdivide into a bullish portion
and a bearish portion for directional identification
b) specific macd crossovers for predictive power in the form of directional flames located directly above the chart price (navy & yellow flames)
c) unique fast & slow rsi combinations for momentum + strength in the form of power flames located directly above the chart price (orange, red, green, & lime flames)
when the alternation of flames are used in concert with the sequence of background colors, one can identify impending explosive price action, can better navigate through periods of slower activity, identify where they are currently in the trend's lifecycle and, MOST IMPORTANTLY, improve the TIMELINESS of entry and exit strategies
00.01 - primeval_series - overview
the primeval_series is a group of transformed universally-renowned mathematical constants that have been transformed and embedded into a series of EMAs
each of these EMAs relates in some meaningful way to the "original wave' or 'wave_0': i.e. the wave that began at t=0, when humanity first made technological progress
the transformations made ensure that the inherent linkages to the original wave remain intact while being applicable to the structures inherent to indicator development
for the purposes of the alt-flames indicator, certain numbers selected from the primeval_series exist and are the basis of each ema , MACD and RSI calculation made herein
00.02 - alt-flames - best practices, and ideal targets
for best use: start with the daily timeframe for broad pattern, then use hourly going forward
ideal for swing trades, shorter-term options, and stocks that already have well-established uptrends, but have also started consolidating for 1+ week
patience is required to catch the ideal break, so best to use mildly OTM calls with at least 2 weeks on them before expiry.
for great use: pick out stocks that have recently broken out heavily from their pivot . Do not enter until the retracement from the top has a defined local low
for average use: any sort of intraday play. this tool is meant for swing trades and sustained breakouts. picking out significant bottom reversals.
the MACD portion is not geared for big reversals here. Rather, it is complementary to the EMA sequences, which are at the core of the indicator
not useful for: shorting stocks that are trending downward or that are in sideways trends

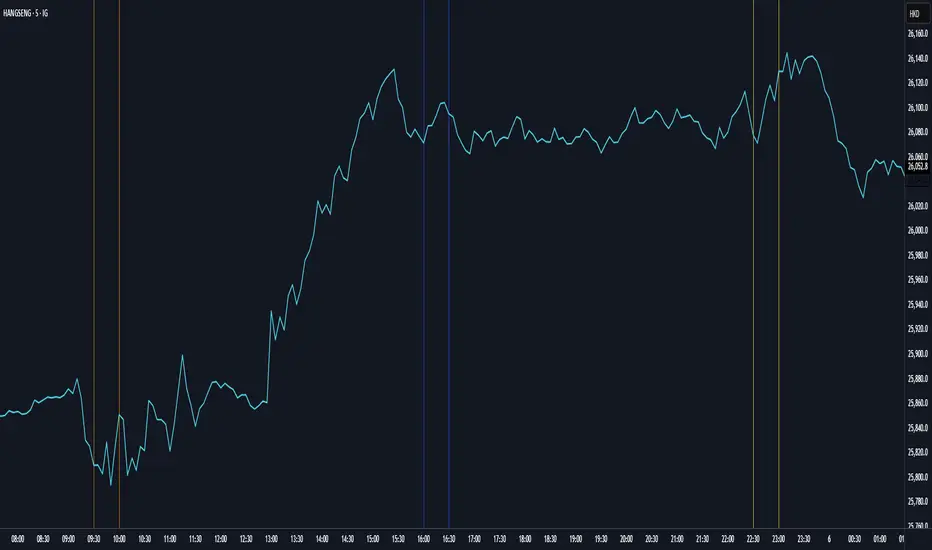
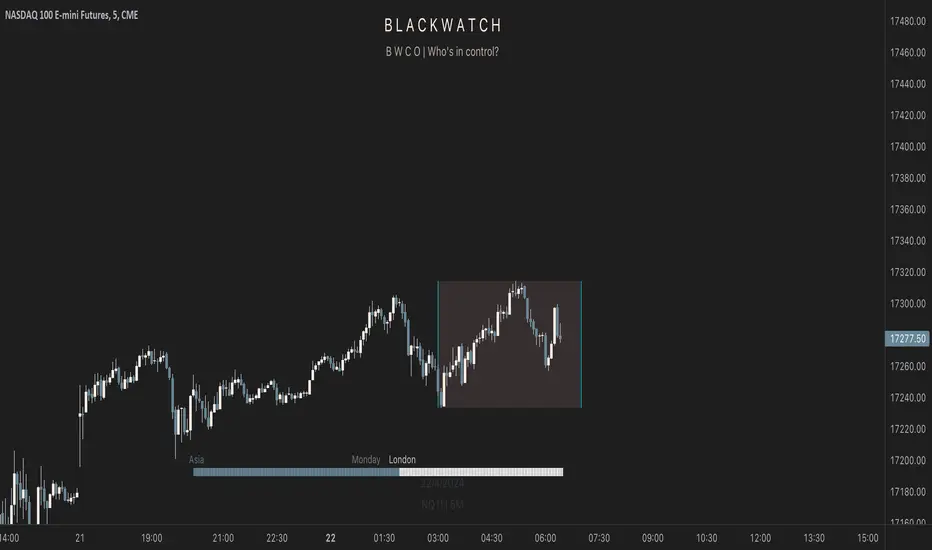
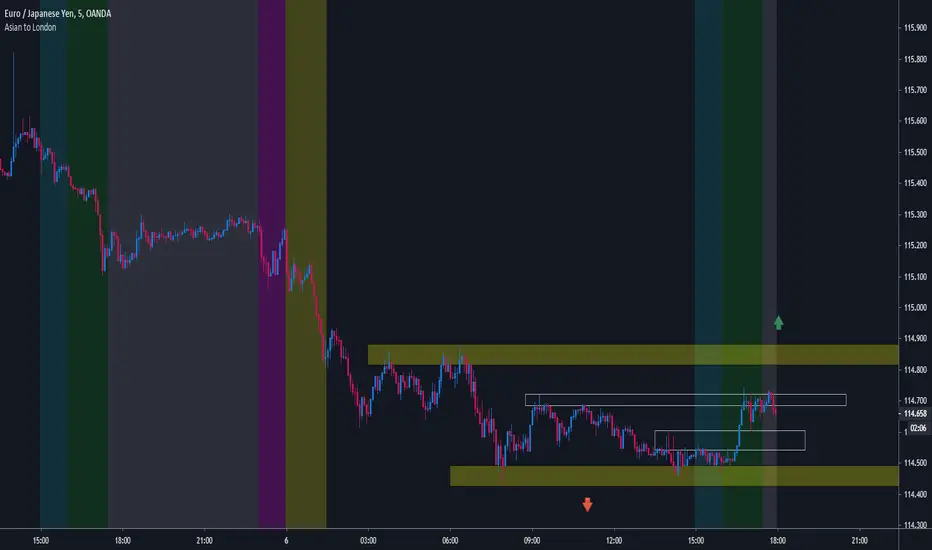
MF Custom Sessions - Asian to LondonThis indicator is meant to be used as a visual aid for understanding when major volumes / session timings are taking place. Asian to london sessions are covered.
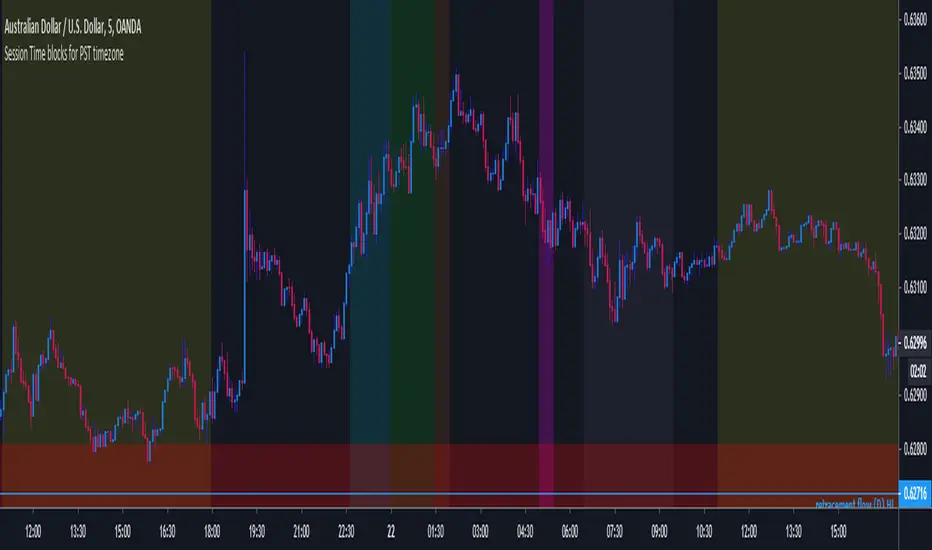
MF Custom Sessions (PST)Public Version - This is a session timing indicator for people in the PST time zone and represents each major session with a different color time block for intraday studies.
Megalodon Pro Utility PanelHow to use?
Simply, add the indicator and follow the timing and kill zone signals on the screen.
This indicator is designed for Daily time frame for longer term analysis and 1 minute time frame for shorter term analysis.
Turn on the kill zone feature for overlaying different kill zones.
Turn on Day Trading checklist feature for becoming a better Day Trader using Megalodon indicators.

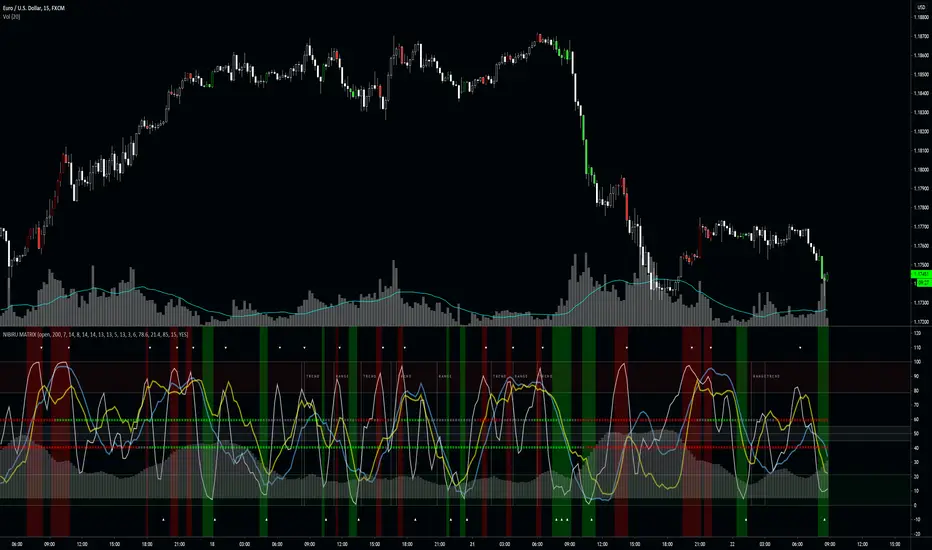
NIBIRU MATRIXThe Nibiru Matrix is an entry timing tool based on oscillators and trends. It's to provide an intuitive way of timing trades when price is at the resistance or on the support.
The Nibiru Matrix provides trade entry hints and information about the current market behavior (trending or ranging). If the market is trending, it also shows the trend strength and direction. It is a secondary indicator meaning it trade should be made on the support or resistance using Nibiru Matrix as a confluence indicator.
What it plots?
Slow, fast and stochastic oscillators
Bar coloring to warn about possible setups
Trending/ranging market indication
Current volatility
2 methods of trend confirmation based on 2 different algorithms
Indicator components:
Trend/range setup - provides information about current possible trade strategy. Following a RANGE indicator, Voodoo Matrix suggests that the safest way to trade will be between the local support and resistance shown by Voodoo Support and Resistance, and following a TREND indicator, it is likely that a trending strategy or taking profit on larger ranges is more profitable.
Fast trend indicator - providing color based information on direction of the short-term trend. This is the most reactive trend indication shown by Voodoo Matrix. This can even be used for counter-main-trend scalping.
Green - uptrend
Red - downtrend
Gray - indecision
Slow trend indicator - providing color based information on direction of the long-term trend. It is based on the behavior of a longer period EMAs.
Green - uptrend
Red - downtrend
Gray - indecision
Volatility histogram - information on current price strength. Best used in confluence with the short term trend indicator.
Fast oscillator - oscillator based on stochastic RSI, modified to provide better information on timing and price movement. It's fast moving which helps time the shorter-term moves.
Slow oscillator - oscillator based on stochastic RSI, modified to provide better information on timing and price movement. It's slow moving and provides useful information about the price direction and strength of the move.
Stochastic oscillator - simple stochastic oscillator. Best used with both Fast and Slow Oscillators to get best timing and price movement strength and direction.
Overbought zone - area of the chart where the modified stochastic oscillator suggests the market is currently overbought.
Oversold zone - area of the chart where the modified stochastic oscillator suggests the market is currently oversold.
Neutral zone - area of the chart where the modified stochastic oscillator suggests the market is currently neutral.
Timing confirmation hints - signaling confirmation of fast oscillator forming a buy/sell setup.
Fast oscillator buy/sell color hint s – bar coloring to bring a focus and attention to possible buy/sell signal forming on the fast oscillator.
Use the link below or PM me to gain access to the indicator.