Adaptive VWAP [QuantAlgo]Introducing the Adaptive VWAP by QuantAlgo 📈🧬
Enhance your trading and investing strategies with the Adaptive VWAP , a versatile tool designed to provide dynamic insights into market trends and price behavior. This indicator offers a flexible approach to VWAP calculations by allowing users to adapt it based on lookback periods or fixed timeframes, making it suitable for a wide range of market conditions.
🌟 Key Features:
🛠 Customizable VWAP Settings: Choose between an adaptive VWAP that adjusts based on a rolling lookback period, or switch to a fixed timeframe (e.g., daily, weekly, monthly) for a more structured approach. Adjust the VWAP to suit your trading or investing style.
💫 Dynamic Bands and ATR Filter: Configurable deviation bands with multipliers allow you to visualize price movement around VWAP, while an ATR-based noise filter helps reduce false signals during periods of market fluctuation.
🎨 Trend Visualization: Color-coded trend identification helps you easily spot uptrends and downtrends based on VWAP positioning. The indicator fills the areas between the bands for clearer visual representation of price volatility and trend strength.
🔔 Custom Alerts: Set up alerts for when price crosses above or below the VWAP, signaling potential uptrend or downtrend opportunities. Stay informed without needing to monitor the charts constantly.
✍️ How to Use:
✅ Add the Indicator: Add the Adaptive VWAP to your favourites and apply to your chart. Choose between adaptive or timeframe-based VWAP calculation, adjust the lookback period, and configure the deviation bands to your preferred settings.
👀 Monitor Bands and Trends: Watch for price interaction with the VWAP and its deviation bands. The color-coded signals and band fills help identify potential trend shifts or price extremes.
🔔 Set Alerts: Configure alerts for uptrend and downtrend signals based on price crossing the VWAP, so you’re always informed of significant market movements.
⚙️ How It Works:
The Adaptive VWAP adjusts its calculation based on the user’s chosen configuration, allowing for a flexible approach to market analysis. The adaptive setting uses a rolling lookback period to continuously adjust the VWAP, while the fixed timeframe option anchors VWAP to key timeframes like daily, weekly, or monthly periods. This flexibility enables traders and investors to use the tool in various market environments.
Deviation bands, calculated with customizable multipliers, provide a clear visual of how far the price has moved from the VWAP, helping you gauge potential overbought or oversold conditions. To reduce false signals, an ATR-based filter can be applied, ensuring that only significant price movements trigger trend confirmations.
The tool also includes a fast exponential smoothing function for the VWAP, helping smooth out price fluctuations without sacrificing responsiveness. Trend confirmation is reinforced by the number of bars that price stays above or below the VWAP, ensuring a more consistent trend identification process.
Disclaimer:
The Adaptive VWAP is designed to enhance your market analysis but should not be relied upon as the sole basis for trading or investing decisions. Always combine it with other analytical tools and practices. No statements or signals from this indicator constitute financial advice. Past performance is not indicative of future results.
Trading

Volatility-Adjusted DEMA Supertrend [QuantAlgo]Introducing the Volatility-Adjusted DEMA Supertrend by QuantAlgo 📈💫
Take your trading and investing strategies to the next level with the Volatility-Adjusted DEMA Supertrend , a dynamic tool designed to adapt to market volatility and provide clear, actionable trend signals. This innovative indicator is ideal for both traders and investors looking for a more responsive approach to market trends, helping you capture potential shifts with greater precision.
🌟 Key Features:
🛠 Customizable Trend Settings: Adjust the period for trend calculation and fine-tune the sensitivity to price movements. This flexibility allows you to tailor the Supertrend to your unique trading or investing strategy, whether you're focusing on shorter or longer timeframes.
📊 Volatility-Responsive Multiplier: The Supertrend dynamically adjusts its sensitivity based on real-time market volatility. This could help filter out noise in calmer markets and provide more accurate signals during periods of heightened volatility.
✨ Trend-Based Color-Coding: Visualize bullish and bearish trends with ease. The indicator paints candles and plots trend lines with distinct colors based on the current market direction, offering quick, clear insights into potential opportunities.
🔔 Custom Alerts: Set up alerts for key trend shifts to ensure you're notified of significant market changes. These alerts would allow you to act swiftly, potentially capturing opportunities without needing to constantly monitor the charts.
📈 How to Use:
✅ Add the Indicator: Add the Volatility-Adjusted DEMA Supertrend to your chart. Customize the trend period, volatility settings, and price source to match your trading or investing style. This ensures the indicator aligns with your market strategy.
👀 Monitor Trend Shifts: Watch the color-coded trend lines and candles as they dynamically shift based on real-time market conditions. These visual cues help you spot potential trend reversals and confirm your entries and exits with greater confidence.
🔔 Set Alerts: Configure alerts for key trend shifts, allowing you to stay informed of potential market reversals or continuation patterns, even when you're not actively watching the market.
⚙️ How It Works:
The Volatility-Adjusted DEMA Supertrend is designed to adapt to changes in market conditions, making it highly responsive to price volatility. The indicator calculates a trend line based on price and volatility, dynamically adjusting it to reflect recent market behavior. When the market experiences higher volatility, the trend line becomes more flexible, potentially allowing for greater sensitivity to rapid price movements. Conversely, during periods of low volatility, the indicator tightens its range, helping to reduce noise and avoid false signals.
The indicator includes a volatility-responsive multiplier, which further enhances its adaptability to market conditions. This means the trend direction would always be based on the latest market data, potentially helping you stay ahead of shifts or continuation trends. The Supertrend's visual color-coding simplifies the process of identifying bullish or bearish trends, while customizable alerts ensure you can stay on top of significant changes in market direction.
This tool is versatile and could be applied across various markets and timeframes, making it a valuable addition for both traders and investors. Whether you’re trading in fast-moving markets or focusing on longer-term investments, the Volatility-Adjusted DEMA Supertrend could help you remain aligned with the current market environment.
Disclaimer:
This indicator is designed to enhance your analysis by providing trend information, but it should not be used as the sole basis for making trading or investing decisions. Always combine it with other forms of analysis and risk management practices. No statements or claims aim to be financial advice, and no signals from us or our indicators should be interpreted as such. Past performance is not indicative of future results.

Dynamic Volume RSI (DVRSI) [QuantAlgo]Introducing the Dynamic Volume RSI (DVRSI) by QuantAlgo 📈✨
Elevate your trading and investing strategies with the Dynamic Volume RSI (DVRSI) , a powerful tool designed to provide clear insights into market momentum and trend shifts. This indicator is ideal for traders and investors who want to stay ahead of the curve by using volume-responsive calculations and adaptive smoothing techniques to enhance signal clarity and reliability.
🌟 Key Features:
🛠 Customizable RSI Settings: Tailor the indicator to your strategy by adjusting the RSI length and price source. Whether you’re focused on short-term trades or long-term investments, DVRSI adapts to your needs.
🌊 Adaptive Smoothing: Enable adaptive smoothing to filter out market noise and ensure cleaner signals in volatile or choppy market conditions.
🎨 Dynamic Color-Coding: Easily identify bullish and bearish trends with color-coded candles and RSI plots, offering clear visual cues to track market direction.
⚖️ Volume-Responsive Adjustments: The DVRSI reacts to volume changes, giving greater significance to high-volume price moves and improving the accuracy of trend detection.
🔔 Custom Alerts: Stay informed with alerts for key RSI crossovers and trend changes, allowing you to act quickly on emerging opportunities.
📈 How to Use:
✅ Add the Indicator: Set up the DVRSI by adding it to your chart and customizing the RSI length, price source, and smoothing options to fit your specific strategy.
👀 Monitor Visual Cues: Watch for trend shifts through the color-coded plot and candles, signaling changes in momentum as the RSI crosses key levels.
🔔 Set Alerts: Configure alerts for critical RSI crossovers, such as the 50 line, ensuring you stay on top of potential market reversals and opportunities.
🔍 How It Works:
The Dynamic Volume RSI (DVRSI) is a unique indicator designed to provide more accurate and responsive signals by incorporating both price movement and volume sensitivity into the RSI framework. It begins by calculating the traditional RSI values based on a user-defined length and price source, but unlike standard RSI tools, the DVRSI applies volume-weighted adjustments to reflect the strength of market participation.
The indicator dynamically adjusts its sensitivity by factoring in volume to the RSI calculation, which means that price moves backed by higher volumes carry more weight, making the signal more reliable. This method helps identify stronger trends and reduces the risk of false signals in low-volume environments. To further enhance accuracy, the DVRSI offers an adaptive smoothing option that allows users to reduce noise during periods of market volatility. This adaptive smoothing function responds to market conditions, providing a cleaner signal by reducing erratic movements or price spikes that could lead to misleading signals.
Additionally, the DVRSI uses dynamic color-coding to visually represent the strength of bullish or bearish trends. The candles and RSI plots change color based on the RSI values crossing critical thresholds, such as the 50 level, offering an intuitive way to recognize trend shifts. Traders can also configure alerts for specific RSI crossovers (e.g., above 50 or below 40), ensuring that they stay informed of potential trend reversals and significant market shifts in real-time.
The combination of volume sensitivity, adaptive smoothing, and dynamic trend visualization makes the DVRSI a robust and versatile tool for traders and investors looking to fine-tune their market analysis. By incorporating both price and volume data, this indicator delivers more precise signals, helping users make informed decisions with greater confidence.
Disclaimer:
The Dynamic Volume RSI is designed to enhance your market analysis but should not be used as a sole decision-making tool. Always consider multiple factors before making any trading or investment decisions. Past performance is not indicative of future results.

Kenji Indicator Version 2.0KenJi Indicator Version 2.0
Indicator Class : Average analysis/trend following
Trading type : Any
Time frame : Any
Purpose : Trend-based trading
Level of aggressiveness : Flexible
Introduction
The basic rule of trading is as follows: "trend is your friend." Means, it is extremely important to follow the current market sentiments rather than resisting them. Following this principle allows a trader to feel as comfortable as possible during the trading: positions typically are in a profit zone and there is no psychological pressure of a negative financial result that often leads to hasty position closures.
Despite the advantages of trend-following strategies, many traders struggle to accurately identify the prevailing trend and market sentiments, resulting in bad trading decisions and, consequently, unfavorable trading outcomes.
To address these challenges, streamline the analysis process, and enhance the overall quality of trading decisions, our team of analysts has developed The KenJi Indicator Version 2.0.
About the KenJi Indicator Version 2.0
The KenJi Indicator Version 2.0 offers a novel approach to traditional average-based analysis. Many conventional strategies relying on averages tend to generate numerous false signals, especially in “flat” markets where frequent crossovers and shifts in direction are common. This reduces the overall effectiveness of average analysis.
The KenJi Indicator Version 2.0 addresses these issues by incorporating a unique algorithm, which combines correlation and moving average analysis to avoid the pitfalls of traditional methods. It accurately identifies market conditions—indicated by colors: red for a downtrend, blue for an uptrend, and green for a “flat” market—thereby improving the quality of signals and helping traders manage trends more effectively.
The KenJi Indicator Version 2.0 indicator not only identifies optimal entry points but also assists in timing exits for profit-taking. Moreover, it assesses the aggressiveness of signals, making it suitable for both novice and experienced traders.
Trading Rules
Using the KenJi Indicator Version 2.0 is straightforward. When the price enters the buy or sell zone—represented by a blue or red area between the fast and slow averages—it generates a signal to enter a position. This position remains active until the market condition changes (such as a shift from a downtrend to “flat”) or until a close signal appears, indicated by a significant divergence shown by a blue or red cross.
Indicator Structure
The KenJi Indicator Version 2.0 consists of colored zones, level lines and stop crosses:
Trend Zones : These are color-coded (blue, red, or green) to highlight trend conditions and entry points.
Level Lines : The lines indicate the nearest support/resistance lines (red for resistance, blue for support). Available for 4H time-frame and below
Stop Crosses : Blue or Red crosses are displayed on the Chart to show the moments of extreme price divergence from the current trend. A good moment to fix profits.
For ease of use, the indicator shows buy and sell signals directly on the chart.
Signal Types:
Standard : Uses the basic lot size for trades.
Aggressive : Uses double the standard lot size for higher risk/reward trades.
Profit zones are marked by blue/red x-crosses: red x-crosses indicate "sell" take-profit zones, while blue x-crosses indicate "buy" take-profit zones.
Alerts and Notifications
The indicator includes built-in alerts and notifications, ensuring traders don’t miss any "buy" or "sell" signals.
Input Parameters
The KenJi Indicator Version 2.0 offers several input parameters for customization:
Slow Average Period : Defines the period for the slow average. Longer periods provide a more stable, conservative response to price changes.
Fast Average Period : Defines the period for the fast average. Similar to the slow average, a longer period provides more conservative signals.
Correlation Period : Used to calculate the Pearson correlation coefficient and estimate the relationship between the fast and slow averages, improving trend identification.
Divergence Sensitivity : Determines the placement of take-profit zones, with higher values increasing the distance of these zones.
Access to the KenJi Indicator Version 2.0
For more information or to request access to the Kenji 2.0 Indicator, please send inquiries via private messages.

Season ChartThis overlay is built on the idea of seasonal charts.
It is constructed by taking the percentage change from each close and recording that change for every trading day of any year that is within the sample. We then take the average for each day of all the years.
These averages are then cumulated to create the chart as per traditional seasonal chart construction.
I have also taken a trimmed mean of the averages to try and dampen the impact one off moves that may have a dramatic effect on the daily averages (for example the crash to $0 in oil in April 2020) however, even removing 10% may not guarantee one off moves won’t affect the average.
The construction of the chart is completely dependent on the data provided by TradingView and so it is recommended that if longer sample sizes are used, the user go back to check that the years contained within the sample have a full history. Some data may have large gaps in their history and this can distort the seasonality readings.
I have attempted to align the chart with the first trading day of the year, but the start of some months may be out by a day or two as it becomes difficult to track all weeks with differing market holidays closures each year and this in turn varies the total amount of actual trading days in each year as well as leap years.
This overlay is designed for the Daily time frame only and will not work on Crypto or any other instrument that trades outside of usual business weekdays. Future updates may include the ability to adapt to Crypto instruments.
All feedback and comments welcome!

Arithmetic Candlesticks (Zeiierman)█ Arithmetic Candlestick - Overview
Arithmetic Candlesticks (Zeiierman) introduce a new way to read charts by applying logical arithmetic to real price data. These candlesticks focus on filtering out noise and smoothing price movements using a bell-shaped curve, which helps to refine the data and highlight the true trend. This approach provides a clearer view of market trends, allowing traders to interpret price action more effectively with minimal lag and distraction.
⚪ What is Arithmetic Candlesticks
Arithmetic Candlesticks use a calculation method rooted in the idea that the market moves in patterns that can be identified and predicted by examining past price movements.
Analyzing momentum, price action, and trend patterns is useful for traders who want to quickly scan and identify price patterns, trends, and momentum in the market. The system searches for these patterns and trends to anticipate future price movements. Traders and investors can identify trends hidden in market noise, enabling them to uncover trading opportunities that might not be immediately obvious to the naked eye.
⚪ Eliminates price noise
The Arithmetic Candlestick noise filtering function is used to reduce price noise, which is the randomness in the price movement of an asset caused by market participants trading on a short-term basis. The idea behind the filter is that it eliminates the impact of short-term fluctuations in the price, thus providing a more accurate picture of the overall trend.
█ Capturing Trends with precise chart reading
Trend moves are some of the biggest moneymakers in trading; in fact, trading in the direction of the trend reduces risk and increases profit potential. Arithmetic Candlestick helps traders do just that.
In a fast-moving and volatile market characterized by high-frequency algorithms, retail traders have a hard time distinguishing the real trend from the noise. Arithmetic Candlesticks are designed to filter out the noise created by insignificant price moves and leave traders with the price action that matters, namely a clear and insightful chart reading. Due to its sophisticated mathematical calculations, Arithmetic Candlesticks are able to analyze any market and timeframe.
█ How to use Arithmetic Candlesticks
Arithmetic Candlesticks is an all-in-one trend and momentum tool that can be used stand-alone or in conjunction with other indicators. Its primary use is to provide a clear chart reading, easily identify trends, and help traders stay longer in trends.
The indicator includes excellent momentum features that offer insights into the current momentum and the strength of the price action. This provides traders with a unique chart experience that yields valuable insights. The indicator boasts numerous features, each of which can be used stand-alone or in combination with others. Read more about the features below.
These candles can be used in conjunction with other indicators such as support/resistance, trendlines, ICT trading, and other patterns.
█ Arithmetic Candlesticks features
The indicator comes with tons of great features that make the indicator into its own system that can be used stand-alone. You find everything from trend reading, entry/exit points, identifying momentum, and auto-stop loss.
⚪ Candle Modes:
Traders can select from three different types of arithmetic candle calculations and enable our volatility-adjusted filter for all of them. By default, the candles are set to Arithmetic candlesticks. However, depending on their trading preferences, users can select Arithmetic + Heikin Ashi Candles or Impulse + Wicks Candles.
The Heikin Ashi mode of the candlesticks makes the indicator smoother and more trend-friendly.
The Impulse + Wick mode of the candlesticks makes the indicator responsive to momentum. The length of the wicks represents the strength of the current momentum. The longer the wicks, the greater the momentum in the market.
If traders enable the Volatility Adjusted candles , the indicator becomes much more responsive to volatility moves, which is a way of making the candlesticks more responsive to significant price movements.
⚪ Trend coloring
Arithmetic candlesticks come in three different color modes: the default one, the gradient one, and the advanced trend coloring. Enable the Trend coloring if you want to engage in long-term trend trading. This filter does not change the arithmetic candlesticks, only the bar coloring.
⚪ Buy and Sell signals
To make trend trading easier to understand, we have included Buy/Sell signals. These signals are based both on the type of candlesticks selected and the type of coloring used. In addition, they come with three filters and are available in scalping and trend modes.
Candle Color Filter: A buy signal will only occur if the candlesticks are bullish, and a sell signal will only occur if the candlesticks are bearish.
Trend Tracker Filter: A buy signal will only occur if the Trend Tracker is bullish, and a sell signal will only occur if the Trend Tracker is bearish.
When both filters are applied, it means that both the candle color and the Trend Tracker should have the same sign in order to trigger a signal.
These filters are very effective and should be used when utilizing the signals.
Take Profit signals can be enabled to help traders know when to take profits.
Adaptive Stop Loss can be enabled for the signals, helping traders manage their risk.
⚪ Trend Tracker
The Trend Tracker line provides insights about the underlying trend. Adjust it if you want to engage in scalping, which makes the line much more responsive. Set the underlying speed of the trend to either Fast or Slow. This Trend Tracker works well in conjunction with Arithmetic Candlesticks and the associated signals.
⚪ Trend Sentiment
Enable Trend Sentiment to identify the levels at which the market is considered bullish or bearish. This feature helps you gauge the overall market direction, allowing you to align your trades with the prevailing trend. The Trend Sentiment also measures the strength of the trend, highlighting whether the current price action reflects a strong or weak trend. Adjust the sensitivity to determine how early or late you want to capture these trend signals.
⚪ Impulse
Enable Impulse Signals to understand when the market is making a significant move, often leading to a pullback or pause. These Impulse Signals can indicate the very start of a trend or serve as the first sign of a reversal. Enable 'Significant Impulses' if you only want to display the most significant market impulses.
█ How is Arithmetic Candlesticks Calculated?
⚪ Candlesticks
These candlesticks combine advanced smoothing techniques with price pattern recognition, giving traders a clearer view of market dynamics.
Adaptive Smoothing: The core of this smoothing approach is its ability to adjust dynamically based on market conditions. It reduces lag while staying responsive to price changes. This adaptive nature allows the candlesticks to follow the price action smoothly, minimizing the influence of short-term fluctuations. As a result, the trend is depicted with greater accuracy, helping traders to stay in tune with the market’s true direction.
Refined Smoothing with Weighted Averages: Another key component of the smoothing process involves applying a refined technique that uses a bell-shaped curve to weight price data. This method reduces the impact of outlier movements, resulting in a smoother, more continuous curve that accurately represents the market's central trend. This ensures that the candlesticks reflect a more balanced view of price action, focusing on the significant movements while filtering out unnecessary noise.
⚪ Trend Coloring
The Trend Coloring feature offers a powerful visualization tool that helps traders quickly identify the prevailing market trend and its strength. By analyzing market structure and the velocity of price movements, this feature provides a clear, dynamic view of the long-term trend direction.
Market Structure Analysis: The Trend Coloring is rooted in a thorough analysis of market structure, focusing on key price levels over time. By evaluating these levels, the system determines whether the market is in an uptrend, downtrend, or ranging phase. This information is then used to color the chart according to the current trend direction, providing a visual cue that makes it easier to align your trades with the broader market movement.
Velocity of Price Movements: . In addition to identifying the trend direction, the system also calculates the velocity of price movements. This involves assessing how quickly or slowly prices are advancing in a particular direction, offering deeper insight into the trend's strength and momentum. Faster price movements suggest a stronger trend, while slower movements may indicate a weakening or consolidating market. This dynamic approach ensures that the Trend Coloring not only highlights the trend but also reflects its intensity and potential sustainability.
⚪ Buy and Sell signals
The Buy/Sell signals are generated using a sophisticated approach that tracks key price action levels to determine market direction and momentum. This method constantly evaluates the relationship between the current price and dynamically adjusting levels that reflect the underlying market conditions. By staying in tune with the flow of the market, this approach effectively captures the onset of new trends while reducing the lag typically associated with traditional indicators.
Dynamic Price Action Levels: The signals are based on critical price action levels that adapt in real-time to market movements. These levels serve as flexible thresholds that help identify potential buy or sell opportunities. When the price interacts with these levels, it triggers signals that indicate possible entry or exit points, aligning your trades with the prevailing market direction.
Price Patterns: The algorithm also recognizes and integrates specific price patterns that are often precursors to significant market moves. By identifying these patterns, the system can anticipate changes in market direction more accurately, enabling earlier and more precise signals. This helps in capturing trend reversals or continuations effectively.
Momentum-Driven Adjustments: The system's price action levels are not static; they adjust dynamically in response to strong price movements. This ensures that the signals are not only timely but also in sync with the underlying market momentum, making the system highly effective in volatile conditions where quick decision-making is crucial.
⚪ Trend Tracker
The Trend Tracker utilizes the core principles of Arithmetic Candlesticks, including their sophisticated smoothing techniques and pattern recognition capabilities. By leveraging these features, the Trend Tracker effectively filters out market noise, allowing it to present a smooth and accurate representation of the current trend. This makes it easier to identify whether the market is trending upwards, downwards, or entering a period of consolidation.
Adaptive to Market Conditions: The Trend Tracker is not static; it dynamically adjusts as market conditions change. Whether the market is experiencing high volatility or moving through a quieter phase, the Trend Tracker remains responsive, continuously updating to reflect the most recent price action. This ensures that traders are always working with the most relevant information, making it easier to stay in sync with the market's true direction.
⚪ Trend Sentiment
Trend Sentiment analyzes key price levels and market structure to determine whether the current market sentiment is bullish or bearish. By examining the direction and momentum of price movements, it provides a straightforward view of the market's overall trend direction.
⚪ Impulse
Impulse monitors the market for sudden shifts in momentum, recognizing when the price is making a strong move that could lead to a trend continuation or a reversal. The feature is tuned to distinguish between regular market fluctuations and significant impulses. It focuses on the most meaningful price movements, ensuring that the signals you receive are relevant and actionable.
█ Important Note
Caution! Arithmetic candlesticks do not always reflect the actual price. Arithmetic uses smoothing and noise filtering to capture trends; hence, it might deviate from the actual close.
It's important to understand that Arithmetic Candlesticks are intended to provide a clearer picture of trend direction rather than exact price levels. Therefore, they should not be used as a substitute for actual market prices, especially in scenarios like backtesting or precise trade execution where exact price data is crucial. Instead, use Arithmetic Candlesticks as a tool for understanding trends and overall market direction, while relying on actual price data for decisions that require precise price points.
-----------------
Disclaimer
The information contained in my Scripts/Indicators/Ideas/Algos/Systems does not constitute financial advice or a solicitation to buy or sell any securities of any type. I will not accept liability for any loss or damage, including without limitation any loss of profit, which may arise directly or indirectly from the use of or reliance on such information.
All investments involve risk, and the past performance of a security, industry, sector, market, financial product, trading strategy, backtest, or individual's trading does not guarantee future results or returns. Investors are fully responsible for any investment decisions they make. Such decisions should be based solely on an evaluation of their financial circumstances, investment objectives, risk tolerance, and liquidity needs.
My Scripts/Indicators/Ideas/Algos/Systems are only for educational purposes!

Price Action Smart Money Concepts [BigBeluga]THE SMART MONEY CONCEPTS Toolkit
The Smart Money Concepts [ BigBeluga ] is a comprehensive toolkit built around the principles of "smart money" behavior, which refers to the actions and strategies of institutional investors.
The Smart Money Concepts Toolkit brings together a suite of advanced indicators that are all interconnected and built around a unified concept: understanding and trading like institutional investors, or "smart money." These indicators are not just randomly chosen tools; they are features of a single overarching framework, which is why having them all in one place creates such a powerful system.
This all-in-one toolkit provides the user with a unique experience by automating most of the basic and advanced concepts on the chart, saving them time and improving their trading ideas.
Real-time market structure analysis simplifies complex trends by pinpointing key support, resistance, and breakout levels.
Advanced order block analysis leverages detailed volume data to pinpoint high-demand zones, revealing internal market sentiment and predicting potential reversals. This analysis utilizes bid/ask zones to provide supply/demand insights, empowering informed trading decisions.
Imbalance Concepts (FVG and Breakers) allows traders to identify potential market weaknesses and areas where price might be attracted to fill the gap, creating opportunities for entry and exit.
Swing failure patterns help traders identify potential entry points and rejection zones based on price swings.
Liquidity Concepts, our advanced liquidity algorithm, pinpoints high-impact events, allowing you to predict market shifts, strong price reactions, and potential stop-loss hunting zones. This gives traders an edge to make informed trading decisions based on liquidity dynamics.
🔵 FEATURES
The indicator has quite a lot of features that are provided below:
Swing market structure
Internal market structure
Mapping structure
Adjustable market structure
Strong/Weak H&L
Sweep
Volumetric Order block / Breakers
Fair Value Gaps / Breakers (multi-timeframe)
Swing Failure Patterns (multi-timeframe)
Deviation area
Equal H&L
Liquidity Prints
Buyside & Sellside
Sweep Area
Highs and Lows (multi-timeframe)
🔵 BASIC DEMONSTRATION OF ALL FEATURES
1. MARKET STRUCTURE
The preceding image illustrates the market structure functionality within the Smart Money Concepts indicator.
➤ Solid lines: These represent the core indicator's internal structure, forming the foundation for most other components. They visually depict the overall market direction and identify major reversal points marked by significant price movements (denoted as 'x').
➤ Internal Structure: These represent an alternative internal structure with the potential to drive more rapid market shifts. This is particularly relevant when a significant gap exists in the established swing structure, specifically between the Break of Structure (BOS) and the most recent Change of High/Low (CHoCH). Identifying these formations can offer opportunities for quicker entries and potential short-term reversals.
➤ Sweeps (x): These signify potential turning points in the market where liquidity is removed from the structure. This suggests a possible trend reversal and presents crucial entry opportunities. Sweeps are identified within both swing and internal structures, providing valuable insights for informed trading decisions.
➤ Mapping structure: A tool that automatically identifies and connects significant price highs and lows, creating a zig-zag pattern. It visualizes market structure, highlights trends, support/resistance levels, and potential breakouts. Helps traders quickly grasp price action patterns and make informed decisions.
➤ Color-coded candles based on market structure: These colors visually represent the underlying market structure, making it easier for traders to quickly identify trends.
➤ Extreme H&L: It visualizes market structure with extreme high and lows, which gives perspective for macro Market Structure.
2. VOLUMETRIC ORDER BLOCKS
Order blocks are specific areas on a financial chart where significant buying or selling activity has occurred. These are not just simple zones; they contain valuable information about market dynamics. Within each of these order blocks, volume bars represent the actual buying and selling activity that took place. These volume bars offer deeper insights into the strength of the order block by showing how much buying or selling power is concentrated in that specific zone.
Additionally, these order blocks can be transformed into Breaker Blocks. When an order block fails—meaning the price breaks through this zone without reversing—it becomes a breaker block. Breaker blocks are particularly useful for trading breakouts, as they signal that the market has shifted beyond a previously established zone, offering opportunities for traders to enter in the direction of the breakout.
Here's a breakdown:
➤ Bear Order Blocks (Red): These are zones where a lot of selling happened. Traders see these areas as places where sellers were strong, pushing the price down. When the price returns to these zones, it might face resistance and drop again.
➤ Bull Order Blocks (Green): These are zones where a lot of buying happened. Traders see these areas as places where buyers were strong, pushing the price up. When the price returns to these zones, it might find support and rise again.
These Order Blocks help traders identify potential areas for entering or exiting trades based on past market activity. The volume bars inside blocks show the amount of trading activity that occurred in these blocks, giving an idea of the strength of buying or selling pressure.
➤ Breaker Block: When an order block fails, meaning the price breaks through this zone without reversing, it becomes a breaker block. This indicates a significant shift in market liquidity and structure.
➤ A bearish breaker block occurs after a bullish order block fails. This typically happens when there's an upward trend, and a certain level that was expected to support the market's rise instead gives way, leading to a sharp decline. This decline indicates that sellers have overcome the buyers, absorbing liquidity and shifting the sentiment from bullish to bearish.
Conversely, a bullish breaker block is formed from the failure of a bearish order block. In a downtrend, when a level that was expected to act as resistance is breached, and the price shoots up, it signifies that buyers have taken control, overpowering the sellers.
3. FAIR VALUE GAPS:
A fair value gap (FVG), also referred to as an imbalance, is an essential concept in Smart Money trading. It highlights the supply and demand dynamics. This gap arises when there's a notable difference between the volume of buy and sell orders. FVGs can be found across various asset classes, including forex, commodities, stocks, and cryptocurrencies.
FVGs in this toolkit have the ability to detect raids of FVG which helps to identify potential price reversals.
Mitigation option helps to change from what source FVGs will be identified: Close, Wicks or AVG.
4. SWING FAILURE PATTERN (SFP):
The Swing Failure Pattern is a liquidity engineering pattern, generally used to fill large orders. This means, the SFP generally occurs when larger players push the price into liquidity pockets with the sole objective of filling their own positions.
SFP is a technical analysis tool designed to identify potential market reversals. It works by detecting instances where the price briefly breaks a previous high or low but fails to maintain that breakout, quickly reversing direction.
How it works:
Pattern Detection: The indicator scans for price movements that breach recent highs or lows.
Reversal Confirmation: If the price quickly reverses after breaching these levels, it's identified as an SFP.
➤ SFP Display:
Bullish SFP: Marked with a green symbol when price drops below a recent low before reversing upwards.
Bearish SFP: Marked with a red symbol when price rises above a recent high before reversing downwards.
➤ Deviation Levels: After detecting an SFP, the indicator projects white lines showing potential price deviation:
For bullish SFPs, the deviation line appears above the current price.
For bearish SFPs, the deviation line appears below the current price.
These deviation levels can serve as a potential trading opportunity or areas where the reversal might lose momentum.
With Volume Threshold and Filtering of SFP traders can adjust their trading style:
Volume Threshold: This setting allows traders to filter SFPs based on the volume of the reversal candle. By setting a higher volume threshold, traders can focus on potentially more significant reversals that are backed by higher trading activity.
SFP Filtering: This feature enables traders to filter SFP detection. It includes parameters such as:
5. LIQUIDITY CONCEPTS:
➤ Equal Lows (EQL) and Equal Highs (EQH) are important concepts in liquidity-based trading.
EQL: A series of two or more swing lows that occur at approximately the same price level.
EQH: A series of two or more swing highs that occur at approximately the same price level.
EQLs and EQHs are seen as potential liquidity pools where a large number of stop loss orders or limit orders may be clustered. They can be used as potential reverse points for trades.
This multi-period feature allows traders to select less and more significant EQL and EQH:
➤ Liquidity wicks:
Liquidity wicks are a minor representation of a stop-loss hunt during the retracement of a pivot point:
➤ Buy and Sell side liquidity:
The buy side liquidity represents a concentration of potential buy orders below the current price level. When price moves into this area, it can lead to increased buying pressure due to the execution of these orders.
The sell side liquidity indicates a pool of potential sell orders below the current price level. Price movement into this area can result in increased selling pressure as these orders are executed.
➤ Sweep Liquidation Zones:
Sweep Liquidation Zones are crucial for understanding market structure and potential future price movements. They provide insights into areas where significant market participants have been forced out of their positions, potentially setting up new trading opportunities.
🔵 USAGE & EXAMPLES
The core principle behind the success of this toolkit lies in identifying "confluence." This refers to the convergence of multiple trading indicators all signaling the same information at a specific point or area. By seeking such alignment, traders can significantly enhance the likelihood of successful trades.
MS + OBs
The chart illustrates a highly bullish setup where the price is rejecting from a bullish order block (POC), while simultaneously forming a bullish Swing Failure Pattern (SFP). This occurs after an internal structure change, marked by a bullish Change of Character (CHoCH). The price broke through a bearish order block, transforming it into a breaker block, further confirming the bullish momentum.
The combination of these elements—bullish order blocks, SFP, and CHoCH—creates a powerful bullish signal, reinforcing the potential for upward movement in the market.
SFP + Bear OB
This chart above displays a bearish setup with a high probability of a price move lower. The price is currently rejecting from a bear order block, which represents a key resistance area where significant selling pressure has previously occurred. A Swing Failure Pattern (SFP) has also formed near this bear order block, indicating that the price briefly attempted to break above a recent high but failed to sustain that upward movement. This failure suggests that buyers are losing momentum, and the market could be preparing for a move to the downside.
Additionally, we can toggle on the Deviation Area in the SFP section to highlight potential levels where price deviation might occur. These deviation areas represent zones where the price is likely to react after the Swing Failure Pattern:
BUY – SELL sides + EQL
The chart showcases a bullish setup with a high probability of price breaking out of the current sell-side resistance level. The market structure indicates a formation of Equal Lows (EQL), which often suggests a build-up of liquidity that could drive the price higher.
The presence of strong buy-side pressure (69%), indicated by the green zone at the bottom, reinforces this bullish outlook. This area represents a key support zone where buyers are outpacing sellers, providing the foundation for a potential upward breakout.
EQL + Bull ChoCh
This chart illustrates a potential bullish setup, driven by the formation of Equal Lows (EQL) followed by a bullish Change of Character (CHoCH). The presence of Equal Lows often signals a liquidity build-up, which can lead to a reversal when combined with additional bullish signals.
Liquidity grab + Bull ChoCh + FVGs
This chart demonstrates a strong bullish scenario, where several important market dynamics are at play. The price begins its upward momentum from Liquidity grab following a bullish Change of Character (CHoCH), signaling the transition from a bearish phase to a bullish one.
As the price progresses, it performs liquidity grabs, which serve to gather the necessary fuel for further movement. These liquidity grabs often occur before significant price surges, as large market participants exploit these areas to accumulate positions before pushing the price higher.
The chart also highlights a market imbalance area, showing strong momentum as the price moves swiftly through this zone.
In this examples, we see how the combination of multiple “smart money” tools helps identify a potential trade opportunities. This is just one of the many scenarios that traders can spot using this toolkit. Other combinations—such as order blocks, liquidity grabs, fair value gaps, and Swing Failure Patterns (SFPs)—can also be layered on top of these concepts to further refine your trading strategy.
🔵 SETTINGS
Window: limit calculation period
Swing: limit drawing function
Mapping structure: show structural points
Algorithmic Logic: (Extreme-Adjusted) Use max high/low or pivot point calculation
Algorithmic loopback: pivot point look back
Show Last: Amount of Order block to display
Hide Overlap: hide overlapping order blocks
Construction: Size of the order blocks
Fair value gaps: Choose between normal FVG or Breaker FVG
Mitigation: (close - wick - avg) point to mitigate the order block/imbalance
SFP lookback: find a higher / lower point to improve accuracy
Threshold: remove less relevant SFP
Equal H&L: (short-mid-long term) display longer term
Liquidity Prints: Shows wicks of candles where liquidity was grabbed
Sweep Area: Identify Sweep Liquidation areas
By combining these indicators in one toolkit, traders are equipped with a comprehensive suite of tools that address every angle of the Smart Money Concept. Instead of relying on disparate tools spread across various platforms, having them integrated into a single, cohesive system allows traders to easily see confluence and make more informed trading decisions.

Fibonacci-Only StrategyFibonacci-Only Strategy
This script is a custom trading strategy designed for traders who leverage Fibonacci retracement levels to identify potential trade entries and exits. The strategy is versatile, allowing users to trade across multiple timeframes, with built-in options for dynamic stop loss, trailing stops, and take profit levels.
Key Features:
Custom Fibonacci Levels:
This strategy calculates three specific Fibonacci retracement levels: 19%, 82.56%, and the reverse 19% level. These levels are used to identify potential areas of support and resistance where price reversals or breaks might occur.
The Fibonacci levels are calculated based on the highest and lowest prices within a 100-bar period, making them dynamic and responsive to recent market conditions.
Dynamic Entry Conditions:
Touch Entry: The script enters long or short positions when the price touches specific Fibonacci levels and confirms the move with a bullish (for long) or bearish (for short) candle.
Break Entry (Optional): If the "Use Break Strategy" option is enabled, the script can also enter positions when the price breaks through Fibonacci levels, providing more aggressive entry opportunities.
Stop Loss Management:
The script offers flexible stop loss settings. Users can choose between a fixed percentage stop loss or an ATR-based stop loss, which adjusts based on market volatility.
The ATR (Average True Range) stop loss is multiplied by a user-defined factor, allowing for tailored risk management based on market conditions.
Trailing Stop Mechanism:
The script includes an optional trailing stop feature, which adjusts the stop loss level as the market moves in favor of the trade. This helps lock in profits while allowing the trade to run if the trend continues.
The trailing stop is calculated as a percentage of the difference between the entry price and the current market price.
Multiple Take Profit Levels:
The strategy calculates seven take profit levels, each at incremental percentages above (for long trades) or below (for short trades) the entry price. This allows for gradual profit-taking as the market moves in the trade's favor.
Each take profit level can be customized in terms of the percentage of the position to be closed, providing precise control over exit strategies.
Strategy Backtesting and Results:
Realistic Backtesting:
The script has been backtested with realistic account sizes, commission rates, and slippage settings to ensure that the results are applicable to actual trading scenarios.
The backtesting covers various timeframes and markets to ensure the strategy's robustness across different trading environments.
Default Settings:
The script is published with default settings that have been optimized for general use. These settings include a 15-minute timeframe, a 1.0% stop loss, a 2.0 ATR multiplier for stop loss, and a 1.5% trailing stop.
Users can adjust these settings to better fit their specific trading style or the market they are trading.
How It Works:
Long Entry Conditions:
The strategy enters a long position when the price touches the 19% Fibonacci level (from high to low) or the reverse 19% level (from low to high) and confirms the move with a bullish candle.
If the "Use Break Strategy" option is enabled, the script will also enter a long position when the price breaks below the 19% Fibonacci level and then moves back up, confirming the break with a bullish candle.
Short Entry Conditions:
The strategy enters a short position when the price touches the 82.56% Fibonacci level and confirms the move with a bearish candle.
If the "Use Break Strategy" option is enabled, the script will also enter a short position when the price breaks above the 82.56% Fibonacci level and then moves back down, confirming the break with a bearish candle.
Stop Loss and Take Profit Logic:
The stop loss for each trade is calculated based on the selected method (fixed percentage or ATR-based). The strategy then manages the trade by either trailing the stop or taking profit at predefined levels.
The take profit levels are set at increments of 0.5% above or below the entry price, depending on whether the position is long or short. The script gradually exits the trade as these levels are hit, securing profits while minimizing risk.
Usage:
For Fibonacci Traders:
This script is ideal for traders who rely on Fibonacci retracement levels to find potential trade entries and exits. The script automates the process, allowing traders to focus on market analysis and decision-making.
For Trend and Swing Traders:
The strategy's flexibility in handling both touch and break entries makes it suitable for trend-following and swing trading strategies. The multiple take profit levels allow traders to capture profits in trending markets while managing risk.
Important Notes:
Originality: This script uniquely combines Fibonacci retracement levels with dynamic stop loss management and multiple take profit levels. It is not just a combination of existing indicators but a thoughtful integration designed to enhance trading performance.
Disclaimer: Trading involves risk, and it is crucial to test this script in a demo account or through backtesting before applying it to live trading. Users should ensure that the settings align with their individual risk tolerance and trading strategy.

Market Structure Based Stop LossMarket Structure Based Dynamic Stop Loss
Introduction
The Market Structure Based Stop Loss indicator is a strategic tool for traders designed to be useful in both rigorous backtesting and live testing, by providing an objective, “guess-free” stop loss level. This indicator dynamically plots suggested stop loss levels based on market structure, and the concepts of “interim lows/highs.”
It provides a robust framework for managing risk in both long and short positions. By leveraging historical price movements and real time market dynamics, this indicator helps traders identify quantitatively consistent risk levels while optimizing trade returns.
Legend
This indicator utilizes various inputs to customize its functionality, including "Stop Loss Sensitivity" and "Wick Depth," which dictate how closely the stop loss levels hug the price's highs and lows. The stop loss levels are plotted as lines on the trading chart, providing clear visual cues for position management. As seen in the chart below, this indicator dynamically plots stop loss levels for both long and short positions at every point in time.
A “Stop Loss Table” is also included, in order to enhance precision trading and increase backtesting accuracy. It is customizable in both size and positioning.
Case Study
Methodology
The methodology behind this indicator focuses on the precision placement of stop losses using market structure as a guide. It calculates stop losses by identifying the "lowest close" and the corresponding "lowest low" for long setups, and inversely for short setups. By adjusting the sensitivity settings, traders can tweak the indicator's responsiveness to price changes, ensuring that the stop losses are set with a balance between tight risk control and enough room to avoid premature exits due to market noise. The indicator's ability to adapt to different trading styles and time frames makes it an essential tool for traders aiming for efficiency and effectiveness in their risk management strategies.
An important point to make is the fact that the stop loss levels are always placed within the wicks. This is important to avoid what can be described as a “floating stop loss”. A stop loss placed outside of a wick is susceptible to an outsized degree of slippage. This is because traders always cluster their stop losses at high/low wicks, and a stop loss placed outside of this level will inevitably be caught in a low liquidity cascade or “wash-out.” When price approaches a cluster of stop losses, it is highly probable that you will be stopped out anyway, so it is prudent to attempt to be the trader who gets stopped out first in order to avoid high slippage, and losses above what you originally intended.
// For long positions: stop-loss is slightly inside the lowest wick
float dynamic_SL_Long = lowestClose - (lowestClose - lowestLow) * (1 - WickDepth)
// For short positions: stop-loss is slightly inside the highest wick
float dynamic_SL_Short = highestClose + (highestHigh - highestClose) * (1 - WickDepth)
The percentage depth of the wick in which the stop loss is placed is customisable with the “Wick Depth” variable, in order to customize stop loss strategies around the liquidity of the market a trader is executing their orders in.

Multi-Step Vegas SuperTrend - strategy [presentTrading]Long time no see! I am back : ) Please allow me to gain some warm-up.
█ Introduction and How it is Different
The "Vegas SuperTrend Strategy" is an enhanced trading strategy that leverages both the Vegas Channel and SuperTrend indicators to generate buy and sell signals.
What sets this strategy apart from others is its dynamic adjustment to market volatility and its multi-step take profit mechanism. Unlike traditional single-step profit-taking approaches, this strategy allows traders to systematically scale out of positions at predefined profit levels, thereby optimizing their risk-reward ratio and maximizing potential gains.
BTCUSD 6hr performance
█ Strategy, How it Works: Detailed Explanation
The Vegas SuperTrend Strategy combines the strengths of the Vegas Channel and SuperTrend indicators to identify market trends and generate trade signals. The following subsections delve into the details of how each component works and how they are integrated.
🔶 Vegas Channel Calculation
The Vegas Channel is based on a simple moving average (SMA) and the standard deviation (STD) of the closing prices over a specified period. The channel is defined by upper and lower bounds that are dynamically adjusted based on market volatility.
Simple Moving Average (SMA):
SMA_vegas = (1/N) * Σ(Close_i) for i = 0 to N-1
where N is the length of the Vegas Window.
Standard Deviation (STD):
STD_vegas = sqrt((1/N) * Σ(Close_i - SMA_vegas)^2) for i = 0 to N-1
Vegas Channel Upper and Lower Bounds:
VegasChannelUpper = SMA_vegas + STD_vegas
VegasChannelLower = SMA_vegas - STD_vegas
The details are here:
🔶 Trend Detection and Trade Signals
The strategy determines the current market trend based on the closing price relative to the SuperTrend bounds:
Market Trend:
MarketTrend = 1 if Close > SuperTrendPrevLower
-1 if Close < SuperTrendPrevUpper
Previous Trend otherwise
Trade signals are generated when there is a shift in the market trend:
Bullish Signal: When the market trend shifts from -1 to 1.
Bearish Signal: When the market trend shifts from 1 to -1.
🔶 Multi-Step Take Profit Mechanism
The strategy incorporates a multi-step take profit mechanism that allows for partial exits at predefined profit levels. This helps in locking in profits gradually and reducing exposure to market reversals.
Take Profit Levels:
The take profit levels are calculated as percentages of the entry price:
TakeProfitLevel_i = EntryPrice * (1 + TakeProfitPercent_i/100) for long positions
TakeProfitLevel_i = EntryPrice * (1 - TakeProfitPercent_i/100) for short positions
Multi-steps take profit local picture:
█ Trade Direction
The trade direction can be customized based on the user's preference:
Long: The strategy only takes long positions.
Short: The strategy only takes short positions.
Both: The strategy can take both long and short positions based on the market trend.
█ Usage
To use the Vegas SuperTrend Strategy, follow these steps:
Configure Input Settings:
- Set the ATR period, Vegas Window length, SuperTrend Multiplier, and Volatility Adjustment Factor.
- Choose the desired trade direction (Long, Short, Both).
- Enable or disable the take profit mechanism and set the take profit percentages and amounts for each step.
█ Default Settings
The default settings of the strategy are designed to provide a balanced approach to trading. Below is an explanation of each setting and its effect on the strategy's performance:
ATR Period (10): This setting determines the length of the ATR used in the SuperTrend calculation. A longer period smoothens the ATR, making the SuperTrend less sensitive to short-term volatility. A shorter period makes the SuperTrend more responsive to recent price movements.
Vegas Window Length (100): This setting defines the period for the Vegas Channel's moving average. A longer window provides a broader view of the market trend, while a shorter window makes the channel more responsive to recent price changes.
SuperTrend Multiplier (5): This base multiplier adjusts the sensitivity of the SuperTrend to the ATR. A higher multiplier makes the SuperTrend less sensitive, reducing the frequency of trade signals. A lower multiplier increases sensitivity, generating more signals.
Volatility Adjustment Factor (5): This factor dynamically adjusts the SuperTrend multiplier based on the width of the Vegas Channel. A higher factor increases the sensitivity of the SuperTrend to changes in market volatility, while a lower factor reduces it.
Take Profit Percentages (3.0%, 6.0%, 12.0%, 21.0%): These settings define the profit levels at which portions of the trade are exited. They help in locking in profits progressively as the trade moves in favor.
Take Profit Amounts (25%, 20%, 10%, 15%): These settings determine the percentage of the position to exit at each take profit level. They are distributed to ensure that significant portions of the trade are closed as the price reaches the set levels, reducing exposure to reversals.
Adjusting these settings can significantly impact the strategy's performance. For instance, increasing the ATR period or the SuperTrend multiplier can reduce the number of trades, potentially improving the win rate but also missing out on some profitable opportunities. Conversely, lowering these values can increase trade frequency, capturing more short-term movements but also increasing the risk of false signals.

Strategy CheckListStrategy CheckList
Overview
The Strategy CheckList is a customizable TradingView indicator designed to help traders maintain consistency and discipline in their trading strategies. By providing a visual checklist directly on the chart, this tool ensures that traders can quickly review and confirm their strategy criteria before making trading decisions.
Key Features
- Customizable checklist with up to 6 items
- Adjustable position on the chart (top-right or bottom-right)
- Configurable background and text colors
- Selectable font sizes for optimal visibility
- Interactive checkboxes for each list item
How It Works
1. Users can input up to 6 checklist items representing key aspects of their trading strategy.
2. Each item can be toggled on or off using a checkbox.
3. The checklist is displayed as a table overlay on the chart, allowing for quick reference without obstructing the view of price action.
4. The position, colors, and font size of the checklist can be easily customized to suit individual preferences and chart setups.
Use Cases
- Pre-trade checklist: Ensure all strategy conditions are met before entering a trade
- Risk management: Include reminders about position sizing, stop-loss placement, etc.
- Strategy adherence: Keep key rules visible to avoid impulsive decisions
- Performance improvement: Track adherence to your trading plan over time
Customization Options
- Background color
- Text color
- Font size (small, normal, large, huge)
- Position on chart (top-right, bottom-right)
- Individual checklist items and their checked/unchecked status
Benefits
- Improves trading discipline
- Reduces emotional decision-making
- Enhances strategy consistency
- Serves as a quick reference for complex strategies
- Adaptable to various trading styles and timeframes
This Strategy CheckList indicator is an invaluable tool for traders looking to enhance their decision-making process and maintain consistency in their trading approach. By keeping crucial strategy elements visible and interactive, it promotes disciplined trading and can potentially improve overall trading performance.

Normalized Hull Moving Average Oscillator w/ ConfigurationsThis indicator uniquely uses normalization techniques applied to the Hull Moving Average (HMA) and allows the user to choose between a number of different types of normalization, each with their own advantages. This indicator is one in a series of experiments I've been working on in looking at different methods of transforming data. In particular, this is a more usable example of the power of data transformation, as it takes the Hull Moving Average of Alan Hull and turns it into a powerful oscillating indicator.
The indicator offers multiple types of normalization, each with its own set of benefits and drawbacks. My personal favorites are the Mean Normalization , which turns the data series into one centered around 0, and the Quantile Transformation , which converts the data into a data set that is normally distributed.
I've also included the option of showing the mean, median, and mode of the data over the period specified by the length of normalization. Using this will allow you to gather additional insights into how these transformations affect the distribution of the data series.
Types of Normalization:
1. Z-Score
Overview: Standardizes the data by subtracting the mean and dividing by the standard deviation.
Benefits: Centers the data around 0 with a standard deviation of 1, reducing the impact of outliers.
Disadvantages: Works best on data that is normally distributed
Notes: Best used with a mid-longer length of transformation.
2. Min-Max
Overview: Scales the data to fit within a specified range, typically 0 to 1.
Benefits: Simple and fast to compute, preserves the relationships among data points.
Disadvantages: Sensitive to outliers, which can skew the normalization.
Notes: Best used with mid-longer length of transformation.
3. Mean Normalization
Overview: Subtracts the mean and divides by the range (max - min).
Benefits: Centers data around 0, making it easier to compare different datasets.
Disadvantages: Can be affected by outliers, which influence the range.
Notes: Best used with a mid-longer length of transformation.
4. Max Abs Scaler
Overview: Scales each feature by its maximum absolute value.
Benefits: Retains sparsity and is robust to large outliers.
Disadvantages: Only shifts data to the range , which might not always be desirable.
Notes: Best used with a mid-longer length of transformation.
5. Robust Scaler
Overview: Uses the median and the interquartile range for scaling.
Benefits: Robust to outliers, does not shift data as much as other methods.
Disadvantages: May not perform well with small datasets.
Notes: Best used with a longer length of transformation.
6. Feature Scaling to Unit Norm
Overview: Scales data such that the norm (magnitude) of each feature is 1.
Benefits: Useful for models that rely on the magnitude of feature vectors.
Disadvantages: Sensitive to outliers, which can disproportionately affect the norm. Not normally used in this context, though it provides some interesting transformations.
Notes: Best used with a shorter length of transformation.
7. Logistic Function
Overview: Applies the logistic function to squash data into the range .
Benefits: Smoothly compresses extreme values, handling skewed distributions well.
Disadvantages: May not preserve the relative distances between data points as effectively.
Notes: Best used with a shorter length of transformation. This feature is actually two layered, we first put it through the mean normalization to ensure that it's generally centered around 0.
8. Quantile Transformation
Overview: Maps data to a uniform or normal distribution using quantiles.
Benefits: Makes data follow a specified distribution, useful for non-linear scaling.
Disadvantages: Can distort relationships between features, computationally expensive.
Notes: Best used with a very long length of transformation.
Conclusion
This indicator is a powerful example into how normalization can alter and improve the usability of a data series. Each method offers unique insights and benefits, making this indicator a useful tool for any trader. Try it out, and don't hesitate to reach out if you notice any glaring flaws in the script, room for improvement, or if you just have questions.

Symbols Correlation, built for pair tradingOverview:
This script is designed for pairs trading. If you are not familiar with pairs trading, I suggest learning about it, as it can be a profitable strategy in neutral markets (or neutral trends between two assets). The correlation between two assets is the foundation of pairs trading, and without it, the chances of making a profit are low.
Correlation can be described in two opposite ways:
1: Absolute positive correlation (meaning the asset prices move together).
-1: Absolute negative correlation (meaning the asset prices move in opposite directions).
Any value between 1 and -1 indicates some degree of correlation, but generally, values higher than 0.7 or lower than -0.7 are considered significant.
Features:
Typically, correlation is measured using the closing prices. This script adds three more correlation studies based on open, high, and low prices. By using all four lines, we can get a better understanding of the pair's correlation.
How to Read This Indicator:
To use this indicator effectively, you need to input your pair as a ratio. For example, if your pair is TSN and ZBH, enter it in the symbol search as: TSN/ZBH
Gray Area : This area indicates "no high correlation" (default is between -0.8 and 0.8, adjustable in the settings).
Gray Line : This represents the close correlation within the "no high correlation" range.
Green Line : This represents the close correlation within the "high correlation" range.
Dot Lines : These represent the open, high, and low correlations.
Example Interpretations:
A : All four lines are close together & the line is green – very good correlation!
B : The line is gray, and the dot lines are apart – not a strong correlation.
C : When the close correlation remains green for a long time, it signals a strong correlation.
Application in Pairs Trading:
In pairs trading, aim for the highest possible correlation, and it is important to have a sustained correlation over a long period. Pairs that correlate only part of the year but not consistently are less reliable for pairs trading.
This is an example for good correlation for pairs trading:
This is an example for bad correlation for pairs trading:
Here is a view of my full indicators when doing pairs trading:

Price Excess with Adjustable RecoveryIndicator: Price Excess with Adjustable Recovery
This indicator detects excessive price movements and displays a potential recovery level. It is particularly useful for identifying trading opportunities after significant market movements.
>> Key Features:
1. Detection of upward and downward price excesses
2. Display of an adjustable recovery level
3. Customizable parameters to adapt to different instruments and timeframes
>> Adjustable Parameters:
- Period: Number of candles for calculating the average and standard deviation (default: 14)
- Excess Threshold: Number of standard deviations to consider a movement as excessive (default: 1.5)
- Recovery Percentage: Recovery level as a percentage (default: 50%)
>> Usage:
1. Red triangles indicate a downward excess
2. Green triangles signal an upward excess
3. The blue line represents the potential recovery level
>> Possible Strategies:
- Counter-trend: Consider buying during downward excesses and selling during upward excesses
- Trend-following: Use the recovery level as a potential profit target
>> Usage Tips:
- Combine this indicator with other technical analysis tools to confirm signals
- Adjust the parameters according to the asset's volatility and your trading horizon
- Use appropriate risk management, as excessive movements can sometimes continue
Feel free to experiment with the parameters to find the configuration that best suits your trading style. Happy trading!
By DL INVEST

Trend Momentum Strength Indicator, Built for Pairs TradingOverview:
This script combines multiple indicators to provide a comprehensive analysis of both trend strength and trend momentum. It is tailored specifically for pairs trading strategies but can also be used for other trading strategies.
Benefit of Comprehensive Analysis:
Having an indicator that evaluates both trend strength and trend momentum is crucial for traders looking to make informed decisions. It allows traders to not only identify the direction and intensity of a trend but also gauge the momentum behind it. This dual capability helps in confirming potential trade opportunities, whether for entering trades with strong trends or considering reversals during overbought or oversold conditions. By integrating both aspects into one tool, traders can gain a holistic view of market dynamics, enhancing their ability to time entries and manage risk effectively.
Features:
* Trend Strength:
Enhanced ADX Formula: The script includes modifications to the standard ADX formula along with DI+ and DI- to provide more responsive trend strength readings.
Directional Indicators: DI+ (green line) indicates positive directional movement, while DI- (red line) indicates negative directional movement.
Trend Momentum:
Modified Stochastic Indicators: The script uses %K and %D indicators, modified and combined with ADX to give a clear indication of trend momentum.
Momentum Strength: This helps determine the strength and direction of the momentum.
Trading Signals:
Combining Indicators: The script combines ADX, DI+, DI-, %K, and %D to generate comprehensive trading signals.
Optimal Entry Points: Designed to identify optimal entry points for trades, particularly in pairs trading.
Colored Area at Bottom:
This area provides two easy-to-read functions:
Color:
Green: Upward momentum (ratio above 1)
Red: Downward momentum (ratio below 1)
Height:
Higher in green: Stronger upward momentum
Lower in red: Stronger downward momentum
Legend:
Green Line: DI+ (Positive)
Red Line: DI- (Negative)
Black Line: ADX
How to Read This Indicator:
1) Trend Direction:
DI+ above DI-: Indicates an upward trend.
DI- above DI+: Indicates a downward trend.
2) Trend Strength:
ADX below 20: Indicates a neutral trend.
ADX between 20 and 25: Indicates a weak trend.
ADX above 25: Indicates a strong trend.
Trading Signals in Pairs Trading:
Neutral Trend: Ideal for pairs trading when no strong trend is detected.
Overbought/Oversold: Uses %K and %D to identify overbought/oversold conditions that support trade decisions.
Entry Signals: Green signals for long positions, red signals for short positions, based on combined criteria of neutral trend strength and supportive momentum.
Application in Pairs Trading:
Neutral trend: In pairs trading strategies, where neutral movement is often sought, this indicator provides signals that are especially relevant during periods of neutral trend strength and supportive momentum, aiding traders in identifying optimal entry
Risk Management: Combining signals from ADX, DI+, DI-, %K, and %D helps traders make more informed decisions regarding entry points, enhancing risk management.
Example Chart (The indicator is on the upper right corner):
Clean Presentation: The chart only includes the necessary elements to demonstrate the indicator’s functionality.
Demonstrates: Overbought/oversold conditions, upward/downward/no momentum, and trading signals with/without specific scenarios.

Percentage GridPercentage Grid Indicator
Description:
The Percentage Grid indicator is designed to assist traders in identifying significant support and resistance levels based on yearly percentage changes. This indicator plots horizontal lines on the chart from the start of the year, allowing you to customize how much percentage each line represents. Currently, you can set up to 5 horizontal lines, each representing a different percentage change from the beginning of the year.
For instance, when applied to the SBI Bank stock, you can customize the lines to display various percentage changes from the start of the year, such as 20%, 25%, and up to 35%, as the SBIN stock is currently trading around these levels. This visualization helps traders to easily identify key levels where price action tends to react, providing valuable insights for making trading decisions.
Principles of Trading Technical Analysis:
The Percentage Grid indicator is grounded in the principle of support and resistance levels, which are fundamental concepts in technical analysis. These levels are specific price points on a chart that tend to act as barriers, preventing the price from getting pushed in a certain direction. The indicator helps in:
Identifying Support Levels: Price levels where a downtrend can be expected to pause due to a concentration of buying interest.
Identifying Resistance Levels: Price levels where an uptrend can be expected to pause due to a concentration of selling interest.
By customizing and plotting percentage-based horizontal lines, the indicator highlights these critical levels based on the percentage change from the start of the year.
How to Use:
Add the Indicator to Your Chart:
Search for "Percentage Grid" in the TradingView indicator library and add it to your chart.
Customize Percentage Levels:
Access the indicator settings to customize the percentage change each line represents.
You can set up to 5 different percentage levels. For example, you can set lines at 20%, 25%, 30%, 35%, and 40%.
Interpret the Grid Lines:
The plotted lines will represent the specified percentage changes from the start of the year.
Use these lines to identify potential support and resistance levels where price action is likely to react.
Practical Application:
Look for price bounces or reversals around these levels, which can indicate strong support or resistance.
Combine the Percentage Grid with other technical analysis tools, such as moving averages or trend lines, to confirm potential trading opportunities.
Example:
In the accompanying screenshot, the Percentage Grid is applied to the SBI Bank stock. The lines are set to display 20%, 25%, 30%, 35%, and 40% changes from the start of the year. Notice how the price action respects these levels, providing clear areas where support and resistance are evident.
By incorporating the Percentage Grid into your trading strategy, you can enhance your ability to identify key price levels and make more informed trading decisions.
Happy Trading!
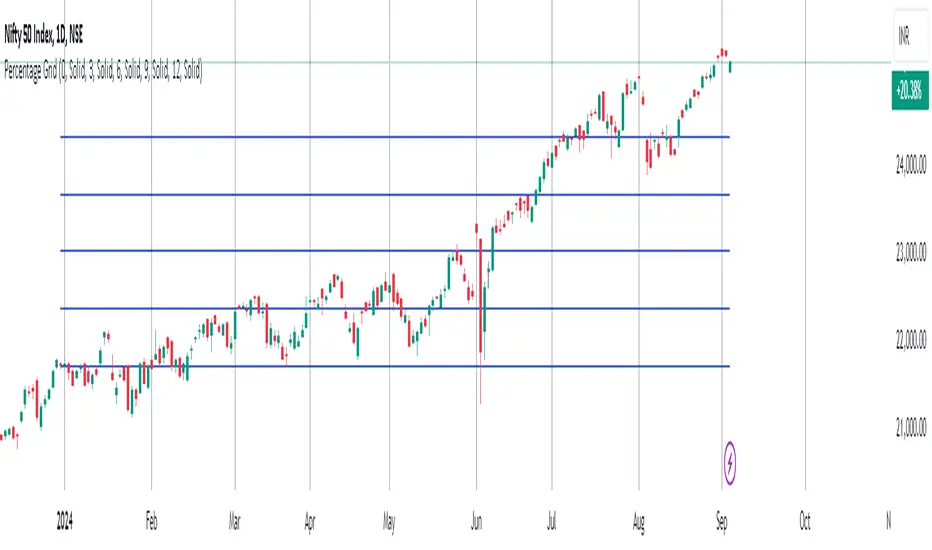
CARNAC Trading Support and Resistance LevelsOverview
The "Carnac Trading Support and Resistance Levels" indicator is a powerful tool designed to help traders identify key support and resistance levels across multiple timeframes. This tool enhances trading strategies by visually marking significant price levels and providing configurable stop-loss and alert features.
Features
Support and Resistance Levels: Automatically calculates and plots support and resistance levels for the following timeframes:
5 minutes (5M)
10 minutes (10M)
15 minutes (15M)
30 minutes (30M)
1 hour (1H)
2 hours (2H)
4 hours (4H)
6 hours (6H)
12 hours (12H)
1 day (1D)
1 week (1W)
1 month (1M)
Configurable Stop-Loss (SL) Levels: Adds a stop-loss line below each support level and above each resistance level with customizable padding (as a percentage).
Visual Labels: Clearly labels support, resistance, and stop-loss levels with the corresponding prices and timeframes for easy identification.
Line Customization:
Support Levels: Green lines with varying thickness based on the timeframe.
Resistance Levels: Red lines with varying thickness based on the timeframe.
Stop-Loss Levels: Gray dotted lines for clear distinction.
Alerts: Alerts trigger when the price gets to a configurable percentage from the support or resistance levels, helping you stay informed about potential buying and selling opportunities.
Visibility Toggling: Easily toggle the visibility of support and resistance levels for each timeframe (default enabled for 2H, 4H, and 1D).
How to Use
Add the Indicator:
Navigate to the TradingView Pine Editor.
Paste the provided Pine Script code and click "Add to Chart."
Configure Inputs:
Lookback Periods: Adjust the lookback periods for each timeframe to suit your analysis needs.
Padding Percentage: Set the padding percentage for the stop-loss levels to define the distance below the support levels and above the resistance levels.
Visibility: Toggle the visibility of the support and resistance levels for each timeframe as needed (default enabled for 2H, 4H, and 1D).
Alert Trigger Distance: Set the alert trigger distance as a percentage to determine when the alerts should be triggered.
Interpret the Plotted Levels:
Green Lines: Indicate support levels for the respective timeframes.
Red Lines: Indicate resistance levels for the respective timeframes.
Gray Dotted Lines: Represent the stop-loss levels below each support level and above each resistance level, with the specified padding.
Labels: Provide clear indications of the price levels and their respective timeframes in white text for visibility.
Identifying Buying and Selling Opportunities:
Buying Opportunities:
Look for the price to approach or bounce off a support level (green line).
Confirm the potential for a reversal by checking if the price is nearing a key support level from multiple timeframes.
Use the stop-loss level (gray dotted line) to set your stop-loss order below the support level to minimize risk.
Selling Opportunities:
Look for the price to approach or get rejected at a resistance level (red line).
Confirm the potential for a reversal by checking if the price is nearing a key resistance level from multiple timeframes.
Use the stop-loss level (gray dotted line) to set your stop-loss order above the resistance level to minimize risk.
Alerts:
Alerts will notify you when the price gets within the specified percentage distance from each support or resistance level.
Use these alerts to stay informed about potential buying and selling opportunities.

Cosine Kernel Regressions [QuantraSystems]Cosine Kernel Regressions
Introduction
The Cosine Kernel Regressions indicator (CKR) uses mathematical concepts to offer a unique approach to market analysis. This indicator employs Kernel Regressions using bespoke tunable Cosine functions in order to smoothly interpret a variety of market data, providing traders with incredibly clean insights into market trends.
The CKR is particularly useful for traders looking to understand underlying trends without the 'noise' typical in raw price movements. It can serve as a standalone trend analysis tool or be combined with other indicators for more robust trading strategies.
Legend
Fast Trend Signal Line - This is the foreground oscillator, it is colored upon the earliest confirmation of a change in trend direction.
Slow Trend Signal Line - This oscillator is calculated in a similar manner. However, it utilizes a lower frequency within the cosine tuning function, allowing it to capture longer and broader trends in one signal. This allows for tactical trading; the user can trade smaller moves without losing sight of the broader trend.
Case Study
In this case study, the CKR was used alongside the Triple Confirmation Kernel Regression Oscillator (KRO)
Initially, the KRO indicated an oversold condition, which could be interpreted as a signal to enter a long position in anticipation of a price rebound. However, the CKR’s fast trend signal line had not yet confirmed a positive trend direction - suggesting that entering a trade too early and without confirmation could be a mistake.
Waiting for a confirmed positive trend from the CKR proved beneficial for this trade. A few candles after the oversold signal, the CKR's fast trend signal line shifted upwards, indicating a strong upward momentum. This was the optimal entry point suggested by the CKR, occurring after the confirmation of the trend change, which significantly reduced the likelihood of entering during a false recovery or continuation of the downtrend.
This is one of the many uses of the CKR - by timing entries using the fast signal line , traders could avoid unnecessary losses by preventing premature entries.
Methodology
The methodology behind CKR is a multi-layered approach and utilizes many ‘base’ indicators.
Relative Strength Index
Stochastic Oscillator
Bollinger Band Percent
Chande Momentum Oscillator
Commodity Channel Index
Fisher Transform
Volume Zone Oscillator
The calculated output from each indicator is standardized and scaled before being averaged. This prevents any single indicator from overpowering the resulting signal.
// ╔════════════════════════════════╗ //
// ║ Scaling/Range Adjustment ║ //
// ╚════════════════════════════════╝ //
RSI_ReScale (_res ) => ( _res - 50 ) * 2.8
STOCH_ReScale (_stoch ) => ( _stoch - 50 ) * 2
BBPCT_ReScale (_bbpct ) => ( _bbpct - 0.5 ) * 120
CMO_ReScale (_chandeMO ) => ( _chandeMO * 1.15 )
CCI_ReScale (_cci ) => ( _cci / 2 )
FISH_ReScale (_fish1 ) => ( _fish1 * 30 )
VZO_ReScale (_VP, _TV ) => (_VP / _TV) * 110
These outputs are then fed into a customized cosine kernel regression function, which smooths the data, and combines all inputs into a single coherent output.
// ╔════════════════════════════════╗ //
// ║ COSINE KERNEL REGRESSIONS ║ //
// ╚════════════════════════════════╝ //
// Define a function to compute the cosine of an input scaled by a frequency tuner
cosine(x, z) =>
// Where x = source input
// y = function output
// z = frequency tuner
var y = 0.
y := math.cos(z * x)
Y
// Define a kernel that utilizes the cosine function
kernel(x, z) =>
var y = 0.
y := cosine(x, z)
math.abs(x) <= math.pi/(2 * z) ? math.abs(y) : 0. // cos(zx) = 0
// The above restricts the wave to positive values // when x = π / 2z
The tuning of the regression is adjustable, allowing users to fine-tune the sensitivity and responsiveness of the indicator to match specific trading strategies or market conditions. This robust methodology ensures that CKR provides a reliable and adaptable tool for market analysis.
FiboSequFiboSequ: Fibonacci Sequence Marking
Leonardo Fibonacci was an Italian mathematician who lived in the 12th century. His real name was Leonardo of Pisa, but he is commonly known as "Fibonacci." Fibonacci is famous for introducing the Hindu-Arabic numeral system to the Western world. This system is the basis of the modern decimal number system we use today.
Fibonacci Sequence
The Fibonacci sequence is a series of numbers that frequently appears in mathematics and nature. The first two numbers in the sequence are 0 and 1, and each subsequent number is the sum of the two preceding numbers.
The sequence is as follows:
0, 1, 1, 2, 3, 5, 8, 13, 21, 34, 55, 89, 144, 233, 377, 610, 987, 1597, 2584, ...
Fibonacci Time Zones:
Fibonacci time zones are used to identify potential turning points in the market at specific time intervals. These time zones correspond to the Fibonacci sequence in terms of consecutive days or weeks.
The Fibonacci sequence has a wide range of applications in both mathematics and nature. Leonardo Fibonacci's work has had a significant impact on the development of modern mathematics and numeral systems. In financial markets, the Fibonacci sequence and ratios are frequently used by technical analysts to predict and analyze market movements.
Description:
Overview:
The FiboSequ indicator marks significant days on a price chart based on the Fibonacci sequence. This can help traders identify potential turning points or areas of interest in the market. The Fibonacci sequence is a series of numbers where each number is the sum of the two preceding ones, often found in nature and financial markets.
Fibonacci Sequence:
The sequence used in this indicator includes: 1, 3, 5, 8, 13, 21, 34, 55, 89, 144, 233, 377, 610, 987, 1597, and 2584.
These numbers represent the days to be marked on the chart, highlighting possible significant market movements.
How It Works:
User Input:
Users can input the starting date (Year, Month, and Day) from which the Fibonacci sequence will begin to be calculated.
This allows flexibility and customization based on the trader's analysis needs.
Calculation:
The starting date is converted into a timestamp in seconds.
For each bar on the chart, the number of days since the starting date is calculated.
The indicator checks if the current day matches any of the Fibonacci sequence days, the previous day, or the next day.
In this indicator, Fibonacci numbers can be displayed on the chart as plus and minus 2 days. For example, for the 145th day, signals start to appear as 143,144 and 145. This is due to dates that sometimes coincide with weekends and public holidays.
Marking the Chart:
When a match is found, a label is placed above the bar indicating the day number from the Fibonacci sequence.
These labels are colored blue with white text for easy visibility.
Usage:
This indicator can be used on any timeframe and market to help identify potential areas where price might react.
It is especially useful for those who employ Fibonacci analysis in their trading strategy.
Example:
If the starting date is January 1, 2020, the indicator will mark significant Fibonacci days (e.g., 1, 3, 5, 8 days, etc.) on the chart from this date onward.
Community Guidelines Compliance:
This indicator adheres to TradingView's Pine Script community guidelines.
It provides customizable user inputs and does not violate any terms of use.
By using the FiboSequ indicator, traders can enhance their technical analysis by incorporating time-based Fibonacci levels, potentially leading to better market timing and decision-making.
Frequently Asked Questions (FAQ)
Q: What is the FiboSequ indicator?
A: The FiboSequ indicator is a technical analysis tool that marks significant days on a price chart based on the Fibonacci sequence. This indicator helps traders identify potential turning points or areas of interest in the market.
Q: What is the Fibonacci sequence and why is it important?
A: The Fibonacci sequence is a series of numbers where each number is the sum of the two preceding ones. The first two numbers are 0 and 1. This sequence frequently appears in nature and financial markets and is used in technical analysis to identify important support and resistance levels.
Q: How do the Fibonacci time zones in the indicator work?
A: Fibonacci time zones are used to identify potential market turning points at specific time intervals. The indicator calculates days based on the Fibonacci sequence (e.g., 1, 3, 5, 8 days, etc.) from the starting date and marks them on the chart.
Q: How can users set the starting date?
A: Users can input the starting date by specifying the year, month, and day. This sets the date from which the indicator begins its calculations, providing flexibility for user analysis.
Q: What do the labels in the indicator represent?
A: The labels mark specific days in the Fibonacci sequence. For example, 1st day, 3rd day, 5th day, etc. These labels are displayed in blue with white text for easy visibility.
Q: Which timeframes can I use the FiboSequ indicator on?
A: The FiboSequ indicator can be used on any timeframe. This includes daily, weekly, or monthly charts, as well as shorter timeframes.
Q: Which markets can the FiboSequ indicator be used in?
A: The FiboSequ indicator can be used in various financial markets, including stocks, forex, cryptocurrencies, commodities, and more.
Q: How can I achieve better market timing with the FiboSequ indicator?
A: The FiboSequ indicator helps identify potential market turning points using time-based Fibonacci levels. This can lead to better market timing and more informed trading decisions for traders.
-Please feel free to write your valuable comments and opinions. I attach importance to your valuable opinions so that I can improve myself.

EngulfScanEngulf Scan
Introduction:
The Engulf Scan indicator helps users identify bullish and bearish engulfing candlestick patterns on their charts. These patterns are often used as signals for trend reversals and are important indicators for traders. Engulf Scan signals are generated when an engulfing pattern is swallowed by another candlestick of the opposite color.The signal of a candle engulfment formation is generated when the 1st candle is engulfed by the 2nd candle and the 2nd candle is engulfed by the 3rd candle.
Features:
Bullish Engulfing Pattern: Indicates the start of an upward trend and typically signals that the market is likely to move higher.
Bearish Engulfing Pattern: Indicates the start of a downward trend and typically signals that the market is likely to move lower.
Color Coding: Users can customize the background colors for bullish and bearish engulfing patterns.
Usage Guide:
Adding the Indicator: Add the "Engulf Scan" indicator to your TradingView chart.
Color Settings: Choose your preferred colors for bullish and bearish engulfing patterns from the indicator settings.
Pattern Detection: View the engulfing patterns on the chart with the specified colors and symbols. These patterns help identify potential trend reversal points.
Parameters and Settings:
Bullish Engulfing Color: Background color for the bullish engulfing pattern.( Green)
Bearish Engulfing Color: Background color for the bearish engulfing pattern. (Red)
Examples:
Bullish Engulfing Example: On the chart below, you can see bullish engulfing patterns highlighted with a green background. (Green)
Bearish Engulfing Example: On the chart below, you can see bearish engulfing patterns highlighted with a red background. (Red)
Frequently Asked Questions (FAQ):
How are engulfing patterns detected?
Engulfing patterns are formed when a candlestick completely engulfs the previous candlestick. For a bullish engulfing pattern, a bullish candlestick follows a bearish one. For a bearish engulfing pattern, a bearish candlestick follows a bullish one.
Which timeframes work best with this indicator?
Engulfing patterns are generally more reliable on daily and higher timeframes, but you can test the indicator on different timeframes to see if it fits your trading strategy.
Can I detect a reversal or trend?
As can be seen in the image, it sometimes appears as a return signal and sometimes as a harbinger of an ongoing trend.But it may be a mistake to use the indicator only for these purposes. However, this indicator may not be sufficient when used alone. It can be combined with different indicators from the Tradingview library.
Updates and Changelog:
v1.0: Initial release. Added detection and color coding for bullish and bearish engulfing patterns.
-Please feel free to write your valuable comments and opinions. I attach importance to your valuable opinions so that I can improve myself.

IV Rank Oscillator by dinvestorqShort Title: IVR OscSlg
Description:
The IV Rank Oscillator is a custom indicator designed to measure and visualize the Implied Volatility (IV) Rank using Historical Volatility (HV) as a proxy. This indicator helps traders determine whether the current volatility level is relatively high or low compared to its historical levels over a specified period.
Key Features :
Historical Volatility (HV) Calculation: Computes the historical volatility based on the standard deviation of logarithmic returns over a user-defined period.
IV Rank Calculation: Normalizes the current HV within the range of the highest and lowest HV values over the past 252 periods (approximately one year) to generate the IV Rank.
IV Rank Visualization: Plots the IV Rank, along with reference lines at 50 (midline), 80 (overbought), and 20 (oversold), making it easy to interpret the relative volatility levels.
Historical Volatility Plot: Optionally plots the Historical Volatility for additional reference.
Usage:
IV Rank : Use the IV Rank to assess the relative level of volatility. High IV Rank values (close to 100) indicate that the current volatility is high relative to its historical range, while low IV Rank values (close to 0) indicate low relative volatility.
Reference Lines: The overbought (80) and oversold (20) lines help identify extreme volatility conditions, aiding in trading decisions.
Example Use Case:
A trader can use the IV Rank Oscillator to identify potential entry and exit points based on the volatility conditions. For instance, a high IV Rank may suggest a period of high market uncertainty, which could be a signal for options traders to consider strategies like selling premium. Conversely, a low IV Rank might indicate a more stable market condition.
Parameters:
HV Calculation Length: Adjustable period length for the historical volatility calculation (default: 20 periods).
This indicator is a powerful tool for options traders, volatility analysts, and any market participant looking to gauge market conditions based on historical volatility patterns.
HilalimSBHilalimSB A Wedding Gift 🌙
HilalimSB - Revealing the Secrets of the Trend
HilalimSB is a powerful indicator designed to help investors analyze market trends and optimize trading strategies. Designed to uncover the secrets at the heart of the trend, HilalimSB stands out with its unique features and impressive algorithm.
Hilalim Algorithm and Fixed ATR Value:
HilalimSB is equipped with a special algorithm called "Hilalim" to detect market trends. This algorithm can delve into the depths of price movements to determine the direction of the trend and provide users with the ability to predict future price movements. Additionally, HilalimSB uses its own fixed Average True Range (ATR) value. ATR is an indicator that measures price movement volatility and is often used to determine the strength of a trend. The fixed ATR value of HilalimSB has been tested over long periods and its reliability has been proven. This allows users to interpret the signals provided by the indicator more reliably.
ATR Calculation Steps
1.True Range Calculation:
+ The True Range (TR) is the greatest of the following three values:
1. Current high minus current low
2. Current high minus previous close (absolute value)
3. Current low minus previous close (absolute value)
2.Average True Range (ATR) Calculation:
-The initial ATR value is calculated as the average of the TR values over a specified period
(typically 14 periods).
-For subsequent periods, the ATR is calculated using the following formula:
ATRt=(ATRt−1×(n−1)+TRt)/n
Where:
+ ATRt is the ATR for the current period,
+ ATRt−1 is the ATR for the previous period,
+ TRt is the True Range for the current period,
+ n is the number of periods.
Pine Script to Calculate ATR with User-Defined Length and Multiplier
Here is the Pine Script code for calculating the ATR with user-defined X length and Y multiplier:
//@version=5
indicator("Custom ATR", overlay=false)
// User-defined inputs
X = input.int(14, minval=1, title="ATR Period (X)")
Y = input.float(1.0, title="ATR Multiplier (Y)")
// True Range calculation
TR1 = high - low
TR2 = math.abs(high - close )
TR3 = math.abs(low - close )
TR = math.max(TR1, math.max(TR2, TR3))
// ATR calculation
ATR = ta.rma(TR, X)
// Apply multiplier
customATR = ATR * Y
// Plot the ATR value
plot(customATR, title="Custom ATR", color=color.blue, linewidth=2)
This code can be added as a new Pine Script indicator in TradingView, allowing users to calculate and display the ATR on the chart according to their specified parameters.
HilalimSB's Distinction from Other ATR Indicators
HilalimSB emerges with its unique Average True Range (ATR) value, presenting itself to users. Equipped with a proprietary ATR algorithm, this indicator is released in a non-editable form for users. After meticulous testing across various instruments with predetermined period and multiplier values, it is made available for use.
ATR is acknowledged as a critical calculation tool in the financial sector. The ATR calculation process of HilalimSB is conducted as a result of various research efforts and concrete data-based computations. Therefore, the HilalimSB indicator is published with its proprietary ATR values, unavailable for modification.
The ATR period and multiplier values provided by HilalimSB constitute the fundamental logic of a trading strategy. This unique feature aids investors in making informed decisions.
Visual Aesthetics and Clear Charts:
HilalimSB provides a user-friendly interface with clear and impressive graphics. Trend changes are highlighted with vibrant colors and are visually easy to understand. You can choose colors based on eye comfort, allowing you to personalize your trading screen for a more enjoyable experience. While offering a flexible approach tailored to users' needs, HilalimSB also promises an aesthetic and professional experience.
Strong Signals and Buy/Sell Indicators:
After completing test operations, HilalimSB produces data at various time intervals. However, we would like to emphasize to users that based on our studies, it provides the best signals in 1-hour chart data. HilalimSB produces strong signals to identify trend reversals. Buy or sell points are clearly indicated, allowing users to develop and implement trading strategies based on these signals.
For example, let's imagine you wanted to open a position on BTC on 2023.11.02. You are aware that you need to calculate which of the buying or selling transactions would be more profitable. You need support from various indicators to open a position. Based on the analysis and calculations it has made from the data it contains, HilalimSB would have detected that the graph is more suitable for a selling position, and by producing a sell signal at the most ideal selling point at 08:00 on 2023.11.02 (UTC+3 Istanbul), it would have informed you of the direction the graph would follow, allowing you to benefit positively from a 2.56% decline.
Technology and Innovation:
HilalimSB aims to enhance the trading experience using the latest technology. With its innovative approach, it enables users to discover market opportunities and support their decisions. Thus, investors can make more informed and successful trades. Real-Time Data Analysis: HilalimSB analyzes market data in real-time and identifies updated trends instantly. This allows users to make more informed trading decisions by staying informed of the latest market developments. Continuous Update and Improvement: HilalimSB is constantly updated and improved. New features are added and existing ones are enhanced based on user feedback and market changes. Thus, HilalimSB always aims to provide the latest technology and the best user experience.
Social Order and Intrinsic Motivation:
Negative trends such as widespread illegal gambling and uncontrolled risk-taking can have adverse financial effects on society. The primary goal of HilalimSB is to counteract these negative trends by guiding and encouraging users with data-driven analysis and calculable investment systems. This allows investors to trade more consciously and safely.

Trend Bars (HTF PO3)Hello Traders!
The innovative TRN Trend Bars are designed to help traders to analyze markets in an intuitive way. The TRN Trend Bars show bullish and bearish trends and reversals based on color coding the bars and give high probability trade opportunities.
How does the Trend Detection work in detail?
The trend analysis is based on a new algorithm that includes several different inputs:
detection of classical and advanced bar patterns
the statistical frequency of these bar patterns and their statistical outcomes are computed based on historical data
probability distributions of price expansions after certain bar patterns
bar information such as wick length in %, overlapping of the previous bar in % and many more
The algorithm weighs these inputs and computes the likelihood of a trend continuation, or a reversal. The likelihood is computed based on statistical information such as occurrence frequency of certain patterns and their historical performance.
The algorithm then outputs a color scheme for the chart bars.
Analyzing the market with the TRN Trend Bar color scheme
Green Bars signify a bullish uptrend. On the other hand, Red Bars indicate a bearish downtrend. The transition from red to green denotes a bullish trend reversal. Conversely, the shift from green to red signals a bearish trend reversal. By monitoring these color changes, traders can identify potential trend reversals and make informed trading decisions.
The presence of gray and black bars indicates a neutral market state, often observed before an impending color change from red to green or green to red. These neutral bars serve as a transition phase between the previous trend and the potential reversal.
How to use TRN Trend Bars for trading?
The TRN Trend Bars are very sensitive. Therefore, they make it easy to find strong short-term trends and pullbacks of the main trend. This can result in high probability entry and exit signals. Here are some trading strategies examples:
Breakouts
After an up breakout of a consolidation or range (or any other chart pattern) you can enter the moment TRN Trend Bars turn green. Alternatively, you wait for a pullback with red bars and enter once a green bar occurs.
Pullbacks
In a trending market you use the TRN Trend Bars for pullback entries. For example, if we are in a strong downtrend and a few green bars occur, then you can enter short once a red bar is displayed.
Exit signals/Trade Management
If you are in a position, you can use the TRN Trend Bars to manage the trade or find good exit points. In case the bar color is not in favor of your position anymore, you can either adjust your stop loss or exit the position completely. E.g. you are in a long position and the bars turn red, then you can either close the trade or tighten your stop loss.
Conclusion
While signals from TRN Trend Bars can be informative, it is important to recognize that their reliability may vary. Various external factors can impact market prices, and it is essential to consider your risk tolerance and investment goals when executing trades.
Risk Disclaimer
The content, tools, scripts, articles, and educational resources offered by TRN Trading are intended solely for informational and educational purposes. Remember, past performance does not ensure future outcomes.
